CRISP-DM: Proven Methodology for Data Scientists
The formulation of machine learning tasks is mathematically very simple. Any classification, regression, or clustering problem is essentially a normal optimization problem with constraints. Despite this, the existing variety of algorithms and methods for their solution makes the data analytics profession one of the most creative IT professions. In order for the solution to the problem not to turn into an endless search for a “golden” solution, but to be a predictable process, it is necessary to follow a fairly clear sequence of actions. Methodologies such as CRISP-DM describe this sequence of actions.
The methodology for analyzing CRISP-DM data is mentioned in many posts on Habré, but I could not find its detailed Russian-language descriptions and decided to fill this gap with my article. At the core of my material is the original description and an adapted description from IBM . An overview lecture on the benefits of using CRISP-DM can be found, for example, here .

* Crisp (English) - crisp, chips
I have been working for CleverDATA (part of the LANIT group) in the position of data scientist since 2015. We are engaged in projects in the field of big data and machine learning, mainly in the field of data-driven marketing (that is, marketing, built on "deep" analysis of customer data). We are also developing a 1DMP data management platform and a 1DMC data exchange . Our typical machine learning projects are the development and implementation of predictive (predictive) and prescriptive (recommending the best action) models to optimize key customer business indicators. In a number of similar projects we used the CRISP-DM methodology.
')
CRoss Industry Standard Process for Data Mining (CRISP-DM) is a standard that describes general processes and approaches to data analytics used in industrial data-mining projects, regardless of a specific task or industry.
On the well-known analytical portal kdnuggets.org, a survey is periodically published (for example, here ), according to which CRISP-DM regularly ranks first among the most popular data analysis methodologies, SEMMA goes further and KDD Process is the least used.
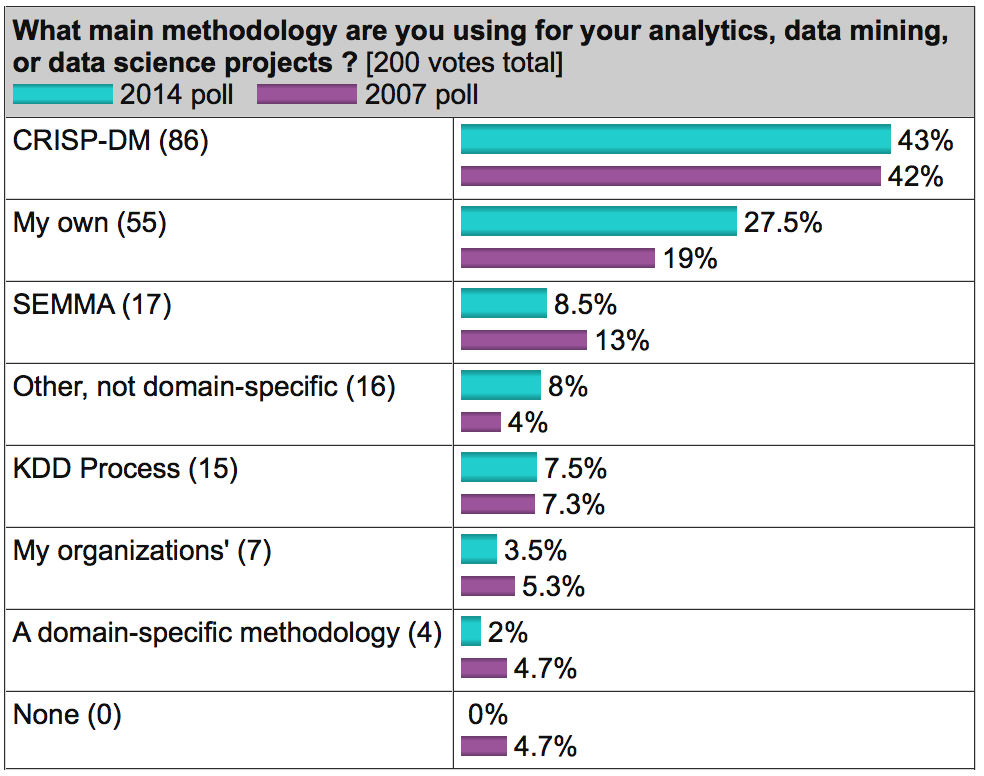 Source: kdnuggets.com
In general, these three methodologies are very similar to each other (it is difficult to come up with something fundamentally new here). However, CRISP-DM has earned popularity as the most complete and detailed. Compared to it, KDD is more general and theoretical, and SEMMA is simply the organization of functions for its intended purpose in the SAS Enterprise Miner tool and affects only the technical aspects of modeling, without any reference to the business formulation of the problem.
The methodology was developed in 1996 on the initiative of three companies (the current DaimlerChrysler, SPSS and Teradata) and was further developed with the participation of 200 companies from various industries with experience in data-mining projects. All these companies used different analytical tools, but they all had a very similar process.
The methodology is actively promoted by IBM. For example, it is integrated into IBM SPSS Modeler (formerly SPSS Clementine).
An important feature of the methodology is paying attention to the company's business goals. This allows management to perceive data analysis projects not as a “sandbox” for experiments, but as a full-fledged element of the company's business processes.
The second feature is a fairly detailed documentation of each step. According to the authors, a well-documented process allows management to better understand the essence of the project, and for analysts to influence decision-making more.
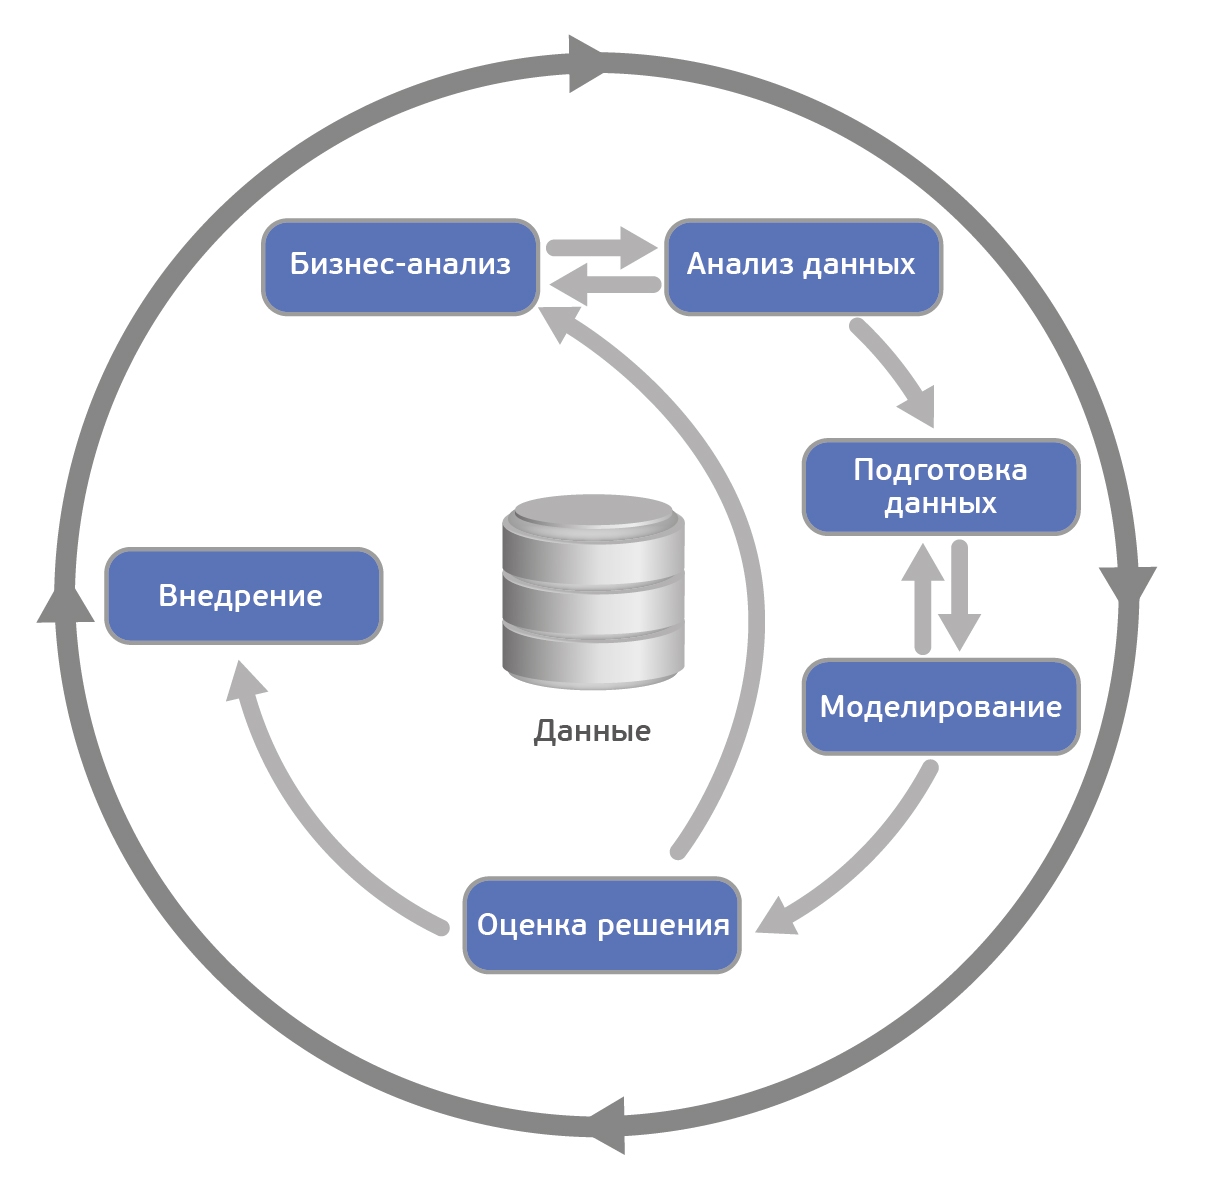
According to CRISP-DM, an analytical project consists of six main steps, carried out sequentially:
The methodology is not rigid. It allows variation depending on the specific project - you can go back to the previous steps, you can skip some steps if they are not important for the task to be solved:
 Wikipedia source
Each of these stages in turn is divided into tasks. The output of each task should have a certain result. The tasks are as follows:
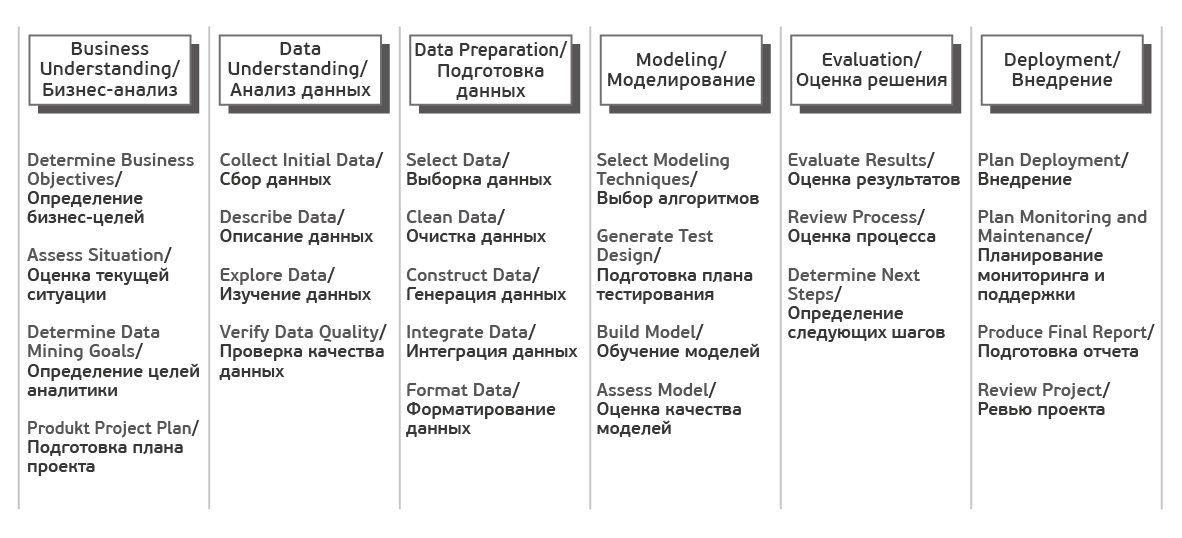
Source Crisp_DM Documentation
In the description of the steps, I deliberately will not delve into mathematics and algorithms, since the article focuses on the process. I assume that the reader is familiar with the basics of machine learning, but just in case, the following section describes the basic terms.
Also note that the methodology is equally applicable both for internal projects, and for situations where the project is being done by consultants.
As a rule, the main result of an analytical project is a mathematical model. What is a model?
Let a business have a certain quantity of interest - y (for example, the probability of a customer churn). And there is also data - x (for example, customer support calls), on which y can depend. The business wants to understand exactly how y depends on x , so that later on by setting x it can influence y . Thus, the task of the project is to find the function f, which best models the studied dependence y = f ( x ).
Under the model, we will understand the formula f (x) or the program that implements this formula. Any model is described, firstly, by its learning algorithm (it can be regression, decision tree, gradient boosting, etc.), and secondly, a set of its parameters (which are different for each algorithm). Model training is the process of finding the parameters at which the model best approximates the observed data.
A training set is a table containing x and y pairs. The rows in this table are called cases , and the columns are attributes . Attributes with sufficient predictive ability will be called predictors . In the case of non-teacher training (for example, in clustering problems), the training sample consists of x only. Scoring is the application of the found function f (x) to new data for which y is not yet known. For example, in the credit scoring task, the probability of late payment by the customer is modeled first, and then the model developed is applied to new applicants to assess their creditworthiness.

A source
In the first step, we need to determine the objectives and the scope of the project.
First of all we get acquainted with the customer and try to understand what he really wants (or tell him). The following questions are good to get an answer.

A source
When, together with the customer, we figured out what we want, we need to evaluate what we can offer, taking into account current realities.
We evaluate whether there are enough resources for the project.
It is necessary to describe the probable risks of the project, as well as to determine a plan of action to reduce them.
Typical risks are as follows.
It is important that the customer and the performer speak the same language, so before starting the project it is better to compile a glossary and agree on the terminology used in the project. So, if we make an outflow model for telecom, it is necessary to immediately agree on what exactly we will consider as outflow - for example, the absence of significant charges on the account for 4 weeks in a row.
Next is (at least roughly) to assess the ROI. In machine-learning projects, a reasonable estimate of payback can often be obtained only after the completion of a project (or pilot simulation), but an understanding of the potential benefits can be a good driver for everyone.
After the task is set in business terms, it is necessary to describe it in technical terms. In particular, we answer the following questions.
Once the answers to all the basic questions have been received and the purpose of the project is clear, it is time to make a project plan. The plan should contain an assessment of all six phases of implementation.
We start the implementation of the project and first look at the data. At this step there is no modeling, only descriptive analytics is used.
The goal of the step is to understand the strengths and weaknesses of the data provided, determine their sufficiency, suggest ideas on how to use them, and better understand the customer's processes. To do this, we build graphs, make samples and calculate statistics.

A source
First you need to understand what data the customer has. Data can be:
It is necessary to analyze all sources, access to which is provided by the customer. If your own data is not enough, it may be worth buying third-party data or organizing new data collection.
Next, look at the data available to us.
With the help of graphs and tables we examine the data in order to formulate hypotheses about how this data will help solve the problem.
In the mini-report we record what is interesting in the data, as well as a list of attributes that are potentially useful.
It is important to assess the quality of the data before modeling, since any inconsistencies can affect the progress of the project. What could be the difficulty with the data?

A source
Data preparation is traditionally the most time-consuming stage of machine learning of a project (in the description it’s about 50-70% of the project time, in our experience it can be even more). The purpose of the stage is to prepare a training set for use in modeling.
First you need to select the data that we will use to train the model.
Both attributes and cases are selected.
For example, if we make product recommendations to site visitors, we limit ourselves to analyzing only registered users.
When selecting data analyst answers the following questions.
When selected potentially interesting data, we check their quality.
The output is 3 attribute lists - quality attributes, corrected attributes and rejected.
Often, feature engineering is the most important step in data preparation: a well-composed feature can significantly improve the quality of a model.
By generating data include:
Well, when the data is taken from a corporate repository (QCD) or a pre-prepared storefront. However, data often needs to be downloaded from several sources and their integration is required to prepare a training set. By integration is meant both a “horizontal” connection (Merge) and a “vertical” association (Append), as well as data aggregation. At the output, as a rule, we have a single analytical table, suitable for delivery to the analytical software as a training sample.
Finally, you need to bring the data to a format suitable for modeling (only for those algorithms that work with a specific data format). So, if we are talking about the analysis of the time series - for example, we predict monthly sales of the trading network - it may be necessary to sort it out.
At the fourth step, the most interesting thing finally begins - model training. As a rule, it is performed iteratively - we try different models, compare their quality, do a brute force of the hyperparameters and choose the best combination. This is the most enjoyable stage of the project.
It is necessary to decide which models we will use (the good, a lot of them). The choice of model depends on the problem to be solved, attribute types and complexity requirements (for example, if the model is further implemented in Excel, then RandomForest and XGBoost obviously will not work). When choosing, pay attention to the following.
Next, you need to decide on what we will teach, and on what to test our model.
The traditional approach is to divide the sample into 3 parts (training, validation and test) in an approximate 60/20/20 proportion. In this case, the training sample is used to adjust the model parameters, and the validation and test to get a quality assessment estimate cleared of the effect of retraining . More complex strategies involve the use of different options for cross-validation .
Here we also figure out how we will do the optimization of the hyperparameters of the models - how many iterations will be for each algorithm, whether we will do grid-search or random-search .
We start the training cycle and after each iteration we fix the result. At the output we get several trained models.
In addition, for each model trained we fix the following.

A source
After the model pool has been formed, it is necessary to analyze them again in detail and select the winning models. At the exit, it is not bad to have a list of models sorted by objective and / or subjective criteria.
Tasks step:
If the success criterion is not achieved, then you can either improve the current model or try a new one.
Before proceeding to the implementation you need to make sure that:

A source
The result of the previous step is a constructed mathematical model (model), as well as findings (findings). In the fifth step, we evaluate the results of the project.
If at the previous stage we evaluated the modeling results from a technical point of view, here we evaluate the results from the point of view of achieving business goals.
We address the following questions:
It is worth getting togetherfor a beer at the table, analyze the course of the project and formulate its strengths and weaknesses. To do this, go through all the steps:
Next, you need to either implement the model if it suits the customer, or, if there is a potential for improvement, try to improve it further.
If at this stage we have several satisfying models, then we select those that will be further implemented.

A source
Before starting a project with the customer, the delivery method of the model is always specified. In one case, it could be just a scammed customer base, in the other - an SQL formula, in the third - a fully developed analytical solution integrated into the information system.
At this step, the model is implemented (if the project involves the implementation phase). Moreover, implementation can be understood as the physical addition of functionality, and the initiation of changes in the company's business processes.
Finally gathered in a heap all the results. Now what?
Very often, project support work is included in the project. This is what is being negotiated.
At the end of the project, as a rule, a report is written on the results of the simulation, to which the results are added for each step, from the primary data analysis to the implementation of the model. Recommendations for the further development of the model can also be included in this report.
The written report is presented to the customer and all interested parties. In the absence of TK, this report is the main project document. It is also important to talk with the employees involved in the project (both on the part of the customer and the contractor) and gather their opinion on the project.
It is important to understand that the methodology is not a universal recipe. This is simply an attempt to formally describe a sequence of actions that, to one degree or another, is performed by any analyst involved in data analysis.
In CleverDATA, following methodology on data-mining projects is not a strict requirement, but, as a rule, when drawing up a project plan, our detailing quite accurately fits into this sequence of steps.
The methodology is applicable to completely different tasks. We followed it in a number of marketing projects, including when we predicted the likelihood of a trading network’s client to respond to an advertising offer, made a model for assessing the creditworthiness of a borrower for a commercial bank, and developed a product recommendation service for an online store.

A source
According to the authors, after each step a certain report should be written. However, in practice it is not very realistic. Like everyone else, we have projects when the customer sets very short deadlines and needs to get results quickly. It is clear that in such conditions it makes no sense to spend time on the detailed documentation of each step. All such intermediate information, if it is needed, we fix in such cases with a pencil “on a napkin”. This allows you to quickly engage in the implementation of the model and meet the deadlines.
In practice, many things are done much less formally than the methodology requires. For example, we usually do not waste time on the selection and coordination of the models used, but we immediately test all the available algorithms (of course, if resources allow). We do the same with attributes - we prepare several variants of each attribute at once, so that the maximum number of variants can be tested. With this approach, irrelevant attributes are eliminated automatically using feature selection algorithms - automatic determination of the predictive ability of attributes.
I suppose that the formalism of the methodology is explained by the fact that it was written back in the 90s, when there was not so much computing power and it was important to correctly plan each action. Now the availability and cheapness of "iron" simplifies many things.
There is always the temptation to "run" the first two stages and go directly to the implementation. Practice shows that this is not always justified.
At the stage of setting business goals (business understanding), it is important to talk as much as possible with the customer to the proposed solution and make sure that your expectations coincide with it. It so happens that a business expects to receive as a result of some kind of "magic" robot, which will immediately solve all its problems and instantly double the revenue. Therefore, so that no one has any disappointments on the results of the project, it is always worthwhile to clearly say what kind of result the customer will receive and what he will give to the business.
In addition, the customer may not always give the correct assessment of the accuracy of the model. As an example: suppose we analyze the response to an advertising campaign on the Internet. We know that about 10% of clients follow the link. The model developed by us selects 1000 clients most inclined to respond, and we see that among them every fourth follows the link - we get an accuracy (precision) of 25%. The model shows a good result (2.5 times better than the “random” model), but for the customer 25% accuracy is too low (he is waiting for numbers in the region of 80-90%). And on the contrary, a completely meaningless model, which classifies all in one class, will show accuracy (accuracy) of 90%, and formally will satisfy the stated criterion of success. Those.together with the customer, it is important to choose the correct measure of the quality of the model and correctly interpret it.
The data understanding stage is important in that it allows both us and the customer to better understand its data. We had examples when, after the presentation of the results of the step, we agreed in parallel with the main project about new ones, since the customer saw the potential in the patterns found at this stage.
As another example, I will cite one of our projects, when we relied on a dialogue with the customer, limited ourselves to a superficial study of the data and found at the modeling stage that some of the data was inapplicable due to numerous omissions. Therefore, it is always worthwhile to pre-examine the data with which to work.
Finally, I want to note that, despite its completeness, the methodology is still quite common. It says nothing about the choice of specific algorithms and does not provide ready-made solutions. Perhaps this is good, as there is always room for creative search, because, I repeat, today the data scientist profession remains one of the most creative in the IT field.
The methodology for analyzing CRISP-DM data is mentioned in many posts on Habré, but I could not find its detailed Russian-language descriptions and decided to fill this gap with my article. At the core of my material is the original description and an adapted description from IBM . An overview lecture on the benefits of using CRISP-DM can be found, for example, here .
* Crisp (English) - crisp, chips
I have been working for CleverDATA (part of the LANIT group) in the position of data scientist since 2015. We are engaged in projects in the field of big data and machine learning, mainly in the field of data-driven marketing (that is, marketing, built on "deep" analysis of customer data). We are also developing a 1DMP data management platform and a 1DMC data exchange . Our typical machine learning projects are the development and implementation of predictive (predictive) and prescriptive (recommending the best action) models to optimize key customer business indicators. In a number of similar projects we used the CRISP-DM methodology.
')
CRoss Industry Standard Process for Data Mining (CRISP-DM) is a standard that describes general processes and approaches to data analytics used in industrial data-mining projects, regardless of a specific task or industry.
On the well-known analytical portal kdnuggets.org, a survey is periodically published (for example, here ), according to which CRISP-DM regularly ranks first among the most popular data analysis methodologies, SEMMA goes further and KDD Process is the least used.
In general, these three methodologies are very similar to each other (it is difficult to come up with something fundamentally new here). However, CRISP-DM has earned popularity as the most complete and detailed. Compared to it, KDD is more general and theoretical, and SEMMA is simply the organization of functions for its intended purpose in the SAS Enterprise Miner tool and affects only the technical aspects of modeling, without any reference to the business formulation of the problem.
About methodology
The methodology was developed in 1996 on the initiative of three companies (the current DaimlerChrysler, SPSS and Teradata) and was further developed with the participation of 200 companies from various industries with experience in data-mining projects. All these companies used different analytical tools, but they all had a very similar process.
The methodology is actively promoted by IBM. For example, it is integrated into IBM SPSS Modeler (formerly SPSS Clementine).
An important feature of the methodology is paying attention to the company's business goals. This allows management to perceive data analysis projects not as a “sandbox” for experiments, but as a full-fledged element of the company's business processes.
The second feature is a fairly detailed documentation of each step. According to the authors, a well-documented process allows management to better understand the essence of the project, and for analysts to influence decision-making more.
According to CRISP-DM, an analytical project consists of six main steps, carried out sequentially:
- Business Analysis
- Data Analysis
- Data preparation (Data preparation)
- Modeling
- Result Evaluation
- Deployment
The methodology is not rigid. It allows variation depending on the specific project - you can go back to the previous steps, you can skip some steps if they are not important for the task to be solved:
Each of these stages in turn is divided into tasks. The output of each task should have a certain result. The tasks are as follows:
Source Crisp_DM Documentation
In the description of the steps, I deliberately will not delve into mathematics and algorithms, since the article focuses on the process. I assume that the reader is familiar with the basics of machine learning, but just in case, the following section describes the basic terms.
Also note that the methodology is equally applicable both for internal projects, and for situations where the project is being done by consultants.
A few basic concepts of machine learning
As a rule, the main result of an analytical project is a mathematical model. What is a model?
Let a business have a certain quantity of interest - y (for example, the probability of a customer churn). And there is also data - x (for example, customer support calls), on which y can depend. The business wants to understand exactly how y depends on x , so that later on by setting x it can influence y . Thus, the task of the project is to find the function f, which best models the studied dependence y = f ( x ).
Under the model, we will understand the formula f (x) or the program that implements this formula. Any model is described, firstly, by its learning algorithm (it can be regression, decision tree, gradient boosting, etc.), and secondly, a set of its parameters (which are different for each algorithm). Model training is the process of finding the parameters at which the model best approximates the observed data.
A training set is a table containing x and y pairs. The rows in this table are called cases , and the columns are attributes . Attributes with sufficient predictive ability will be called predictors . In the case of non-teacher training (for example, in clustering problems), the training sample consists of x only. Scoring is the application of the found function f (x) to new data for which y is not yet known. For example, in the credit scoring task, the probability of late payment by the customer is modeled first, and then the model developed is applied to new applicants to assess their creditworthiness.
Step-by-step description of the methodology
A source
1. Business Analysis (Business Understanding)
In the first step, we need to determine the objectives and the scope of the project.
Project Objective (Business objectives)
First of all we get acquainted with the customer and try to understand what he really wants (or tell him). The following questions are good to get an answer.
- Organizational structure: who participates in the project from the customer, who allocates money for the project, who makes key decisions, who will be the main user? We collect contacts.
- What is the business goal of the project?
For example, reducing customer churn. - Are there any solutions already developed? If there are, then what and what exactly the current solution does not suit?
1.2 Current situation (Assessing current solution)
A source
When, together with the customer, we figured out what we want, we need to evaluate what we can offer, taking into account current realities.
We evaluate whether there are enough resources for the project.
- Is there available iron or should it be purchased?
- Where and how data is stored, will access to these systems be provided, do you need to additionally buy / collect external data?
- Will the customer be able to select his experts for consultations on this project?
It is necessary to describe the probable risks of the project, as well as to determine a plan of action to reduce them.
Typical risks are as follows.
- Do not meet the deadlines.
- Financial risks (for example, if the sponsor loses interest in the project).
- Low or poor quality data that does not allow for an efficient model.
- These are qualitative, but there are no regularities in principle and, as a result, the results obtained are not interesting to the customer.
It is important that the customer and the performer speak the same language, so before starting the project it is better to compile a glossary and agree on the terminology used in the project. So, if we make an outflow model for telecom, it is necessary to immediately agree on what exactly we will consider as outflow - for example, the absence of significant charges on the account for 4 weeks in a row.
Next is (at least roughly) to assess the ROI. In machine-learning projects, a reasonable estimate of payback can often be obtained only after the completion of a project (or pilot simulation), but an understanding of the potential benefits can be a good driver for everyone.
1.3 Tasks to be solved from the point of view of analytics (Data Mining goals)
After the task is set in business terms, it is necessary to describe it in technical terms. In particular, we answer the following questions.
- What metric will we use to evaluate the simulation result (and choose from which: Accuracy, RMSE, AUC, Precision, Recall, F-measure, R 2 , Lift, Logloss, etc.)?
- What is the criterion for the success of the model (for example, we assume AUC equal to 0.65 - the minimum threshold, 0.75 - optimal)?
- If we do not use an objective quality criterion, how will the results be evaluated?
1.4 Project Plan
Once the answers to all the basic questions have been received and the purpose of the project is clear, it is time to make a project plan. The plan should contain an assessment of all six phases of implementation.
2. Data Analysis (Data Understanding)
We start the implementation of the project and first look at the data. At this step there is no modeling, only descriptive analytics is used.
The goal of the step is to understand the strengths and weaknesses of the data provided, determine their sufficiency, suggest ideas on how to use them, and better understand the customer's processes. To do this, we build graphs, make samples and calculate statistics.
2.1 Data collection
A source
First you need to understand what data the customer has. Data can be:
- own (1 st party data),
- third-party data (3 rd party),
- “Potential” data (for which it is necessary to organize collection).
It is necessary to analyze all sources, access to which is provided by the customer. If your own data is not enough, it may be worth buying third-party data or organizing new data collection.
2.2 Data description
Next, look at the data available to us.
- It is necessary to describe the data in all sources (table, key, number of rows, number of columns, volume on the disk).
- If the volume is too large for the software used, create a sample of the data.
- We count key statistics on attributes (minimum, maximum, spread, cardinality, etc.).
2.3 Data exploration
With the help of graphs and tables we examine the data in order to formulate hypotheses about how this data will help solve the problem.
In the mini-report we record what is interesting in the data, as well as a list of attributes that are potentially useful.
2.4 Data quality
It is important to assess the quality of the data before modeling, since any inconsistencies can affect the progress of the project. What could be the difficulty with the data?
- Missing values.
For example, we make a classification model for bank customers according to their product preferences, but, since only borrowing clients fill in the questionnaires, the salary level attribute for depositor clients is not completed. - Data Errors (Typos)
- Non-consistent coding of values (for example, “M” and “male” in different systems)
3. Data Preparation
A source
Data preparation is traditionally the most time-consuming stage of machine learning of a project (in the description it’s about 50-70% of the project time, in our experience it can be even more). The purpose of the stage is to prepare a training set for use in modeling.
3.1 Data Selection
First you need to select the data that we will use to train the model.
Both attributes and cases are selected.
For example, if we make product recommendations to site visitors, we limit ourselves to analyzing only registered users.
When selecting data analyst answers the following questions.
- What is the potential relevance of the attribute to the problem being solved?
So, the email or telephone number of the client as predictors for prediction is clearly useless. But the domain of the mail (mail.ru, gmail.com) or operator code in theory may already have a predictive ability. - Is the quality attribute enough to use in the model?
If we see that most of the attribute values are empty, then the attribute is most likely useless. - Should I include attributes that correlate with each other?
- Are there any restrictions on the use of attributes?
For example, company policy may prohibit the use of attributes with personal information as predictors .
3.2 Data Cleaning
When selected potentially interesting data, we check their quality.
- Missing values => you must either fill them in or remove them from consideration
- Errors in data => try to fix manually or remove from consideration
- Inappropriate encoding => result in a single encoding
The output is 3 attribute lists - quality attributes, corrected attributes and rejected.
3.3 Constructing new data
Often, feature engineering is the most important step in data preparation: a well-composed feature can significantly improve the quality of a model.
By generating data include:
- attribute aggregation (calculation of sum, avg, min, max, var, etc.),
- case generation (for example, oversampling or the SMOTE algorithm),
- conversion of data types for use in different models (for example, SVM traditionally works with interval data, and CHAID with nominal data),
- attribute normalization ( feature scaling ),
- filling in missing data imputation .
3.4 Integrating data
Well, when the data is taken from a corporate repository (QCD) or a pre-prepared storefront. However, data often needs to be downloaded from several sources and their integration is required to prepare a training set. By integration is meant both a “horizontal” connection (Merge) and a “vertical” association (Append), as well as data aggregation. At the output, as a rule, we have a single analytical table, suitable for delivery to the analytical software as a training sample.
3.5 Formatting Data
Finally, you need to bring the data to a format suitable for modeling (only for those algorithms that work with a specific data format). So, if we are talking about the analysis of the time series - for example, we predict monthly sales of the trading network - it may be necessary to sort it out.
4. Modeling
At the fourth step, the most interesting thing finally begins - model training. As a rule, it is performed iteratively - we try different models, compare their quality, do a brute force of the hyperparameters and choose the best combination. This is the most enjoyable stage of the project.
4.1 Selecting the modeling technique
It is necessary to decide which models we will use (the good, a lot of them). The choice of model depends on the problem to be solved, attribute types and complexity requirements (for example, if the model is further implemented in Excel, then RandomForest and XGBoost obviously will not work). When choosing, pay attention to the following.
- Is there enough data, since complex models usually require a larger sample?
- Will the model be able to handle data omissions (some implementations of algorithms are able to work with passes, some are not)?
- Can the model work with the existing data types or is it necessary to convert?
4.2 Generating a test design
Next, you need to decide on what we will teach, and on what to test our model.
The traditional approach is to divide the sample into 3 parts (training, validation and test) in an approximate 60/20/20 proportion. In this case, the training sample is used to adjust the model parameters, and the validation and test to get a quality assessment estimate cleared of the effect of retraining . More complex strategies involve the use of different options for cross-validation .
Here we also figure out how we will do the optimization of the hyperparameters of the models - how many iterations will be for each algorithm, whether we will do grid-search or random-search .
4.3 Building the models
We start the training cycle and after each iteration we fix the result. At the output we get several trained models.
In addition, for each model trained we fix the following.
- Does the model show any interesting patterns?
For example, that 99% accuracy of prediction is explained by only one attribute. - What is the speed of learning / application of the model?
If the model is trained for 2 days, it may be worthwhile to look for a more efficient algorithm or reduce the training sample. - Were there any problems with data quality?
For example, cases with missing values were included in the test sample, and because of this, not all of the sample was missed.
4.4 Assessing the model
A source
After the model pool has been formed, it is necessary to analyze them again in detail and select the winning models. At the exit, it is not bad to have a list of models sorted by objective and / or subjective criteria.
Tasks step:
- Conduct a technical analysis of the quality of the model (ROC, Gain, Lift, etc.),
- assess whether the model is ready for implementation in QCD (or where needed),
- whether the specified quality criteria are achieved,
- evaluate results in terms of achieving business goals. This can be discussed with the analysts of the customer.
If the success criterion is not achieved, then you can either improve the current model or try a new one.
Before proceeding to the implementation you need to make sure that:
- the simulation result is clear (model, attributes, accuracy)
- simulation result is logical
For example, we forecast customer churn and received a ROC AUC of 95%. Too good result - a reason to check the model again. - we tried all available models
- infrastructure is ready for model implementation
Customer: “Let's introduce! Only we have no place in the window ... ".
5. Evaluation of the result (Evaluation)
A source
The result of the previous step is a constructed mathematical model (model), as well as findings (findings). In the fifth step, we evaluate the results of the project.
5.1 Evaluation of simulation results (Evaluating the results)
If at the previous stage we evaluated the modeling results from a technical point of view, here we evaluate the results from the point of view of achieving business goals.
We address the following questions:
- Formulation of the result in business terms. It is much easier for business to communicate in terms of $ and ROI than in abstract Lift or R 2
Classic dialogue example
Analyst: Our model shows a tenfold lift!
Business: I'm not impressed ...
Analyst: You earn an extra $ 100K per year!
Business: We had to start with this! More detail, please ... - In general, how well do the obtained results solve a business problem?
- Has any valuable new information been found separately?
For example, the retailer focused its marketing efforts on the “active youth” segment, but, taking up prediction of the likelihood of response, was surprised to find that their target segment was quite different - “provided 40+ women”.
5.2 Review the process
It is worth getting together
- Could any steps have been made more effective?
For example, because of the slowness of the IT department of the customer, a whole month went away to agree on access. Not good! - What mistakes were made and how to avoid them in the future?
At the planning stage, they underestimated the complexity of downloading data from sources and, as a result, did not meet the deadlines. - Were there any hypotheses that failed? If so, is it worth repeating them?
Analyst: "And now let's try the convolutional neural network ... Everything is getting better with neural networks!" - Were there any surprises when taking the steps? How to foresee them in the future?
Customer: “Ok. And we thought that the training sample for the development of the model is not needed ... "
5.3 Determining the next steps
Next, you need to either implement the model if it suits the customer, or, if there is a potential for improvement, try to improve it further.
If at this stage we have several satisfying models, then we select those that will be further implemented.
6. Deployment
A source
Before starting a project with the customer, the delivery method of the model is always specified. In one case, it could be just a scammed customer base, in the other - an SQL formula, in the third - a fully developed analytical solution integrated into the information system.
At this step, the model is implemented (if the project involves the implementation phase). Moreover, implementation can be understood as the physical addition of functionality, and the initiation of changes in the company's business processes.
6.1 Planning Deployment
Finally gathered in a heap all the results. Now what?
- It is important to fix exactly what and in what form we will implement, as well as to prepare a technical implementation plan (passwords, attendances, etc.)
- Think about how users will work with the model being implemented.
For example, on the screen of a call center employee, we show the tendency of the client to connect additional services. - Determine the principle of monitoring decisions. If necessary, prepare for pilot production.
For example, we agree on using the model for a year and tuning the model once every 3 months.
6.2 Setting up model monitoring (Planning Monitoring)
Very often, project support work is included in the project. This is what is being negotiated.
- What model quality indicators will be tracked?
In our banking projects, we often use the popular in banks indicator population stability index PSI. - How do we understand that the model is outdated?
For example, if PSI is greater than 0.15, or simply agree on a regular recalculation every 3 months. - If the model is outdated, will it be enough to retrain it or is it necessary to organize a new project?
With significant changes in the business processes of tuning the model is not enough, we need a full cycle of retraining - with the addition of new attributes, selection of predictors, etc.
6.3 Report on the simulation results (Final Report)
At the end of the project, as a rule, a report is written on the results of the simulation, to which the results are added for each step, from the primary data analysis to the implementation of the model. Recommendations for the further development of the model can also be included in this report.
The written report is presented to the customer and all interested parties. In the absence of TK, this report is the main project document. It is also important to talk with the employees involved in the project (both on the part of the customer and the contractor) and gather their opinion on the project.
What about practice?
It is important to understand that the methodology is not a universal recipe. This is simply an attempt to formally describe a sequence of actions that, to one degree or another, is performed by any analyst involved in data analysis.
In CleverDATA, following methodology on data-mining projects is not a strict requirement, but, as a rule, when drawing up a project plan, our detailing quite accurately fits into this sequence of steps.
The methodology is applicable to completely different tasks. We followed it in a number of marketing projects, including when we predicted the likelihood of a trading network’s client to respond to an advertising offer, made a model for assessing the creditworthiness of a borrower for a commercial bank, and developed a product recommendation service for an online store.
One hundred and one report
A source
According to the authors, after each step a certain report should be written. However, in practice it is not very realistic. Like everyone else, we have projects when the customer sets very short deadlines and needs to get results quickly. It is clear that in such conditions it makes no sense to spend time on the detailed documentation of each step. All such intermediate information, if it is needed, we fix in such cases with a pencil “on a napkin”. This allows you to quickly engage in the implementation of the model and meet the deadlines.
In practice, many things are done much less formally than the methodology requires. For example, we usually do not waste time on the selection and coordination of the models used, but we immediately test all the available algorithms (of course, if resources allow). We do the same with attributes - we prepare several variants of each attribute at once, so that the maximum number of variants can be tested. With this approach, irrelevant attributes are eliminated automatically using feature selection algorithms - automatic determination of the predictive ability of attributes.
I suppose that the formalism of the methodology is explained by the fact that it was written back in the 90s, when there was not so much computing power and it was important to correctly plan each action. Now the availability and cheapness of "iron" simplifies many things.
About the importance of planning
There is always the temptation to "run" the first two stages and go directly to the implementation. Practice shows that this is not always justified.
At the stage of setting business goals (business understanding), it is important to talk as much as possible with the customer to the proposed solution and make sure that your expectations coincide with it. It so happens that a business expects to receive as a result of some kind of "magic" robot, which will immediately solve all its problems and instantly double the revenue. Therefore, so that no one has any disappointments on the results of the project, it is always worthwhile to clearly say what kind of result the customer will receive and what he will give to the business.
In addition, the customer may not always give the correct assessment of the accuracy of the model. As an example: suppose we analyze the response to an advertising campaign on the Internet. We know that about 10% of clients follow the link. The model developed by us selects 1000 clients most inclined to respond, and we see that among them every fourth follows the link - we get an accuracy (precision) of 25%. The model shows a good result (2.5 times better than the “random” model), but for the customer 25% accuracy is too low (he is waiting for numbers in the region of 80-90%). And on the contrary, a completely meaningless model, which classifies all in one class, will show accuracy (accuracy) of 90%, and formally will satisfy the stated criterion of success. Those.together with the customer, it is important to choose the correct measure of the quality of the model and correctly interpret it.
The data understanding stage is important in that it allows both us and the customer to better understand its data. We had examples when, after the presentation of the results of the step, we agreed in parallel with the main project about new ones, since the customer saw the potential in the patterns found at this stage.
As another example, I will cite one of our projects, when we relied on a dialogue with the customer, limited ourselves to a superficial study of the data and found at the modeling stage that some of the data was inapplicable due to numerous omissions. Therefore, it is always worthwhile to pre-examine the data with which to work.
Finally, I want to note that, despite its completeness, the methodology is still quite common. It says nothing about the choice of specific algorithms and does not provide ready-made solutions. Perhaps this is good, as there is always room for creative search, because, I repeat, today the data scientist profession remains one of the most creative in the IT field.
Source: https://habr.com/ru/post/328858/
All Articles