Data-driven Production Approach / Stock Filters

What awaits you in the article:
A description of the approach we used to study the filters on the site of one of our clients, as well as a detailed description of the technologies.
For whom the article is intended:
The article will be of interest to web analysts and anyone who is faced with the tasks of researching user experience based on quantitative data.
')
Disclaimer:
Everything described in the article is only the opinion of the author (Artem Kulbasov, AGIMA web analyst) and is not the only correct solution to the problem. Many of the technologies described in the article can be replaced by analogues.

1. Description of the task
The task from the client sounded like this: to conduct a comprehensive analysis of user behavior and, based on the analysis of the obtained data, create a task for designing a new site. What is important, it should be done taking into account the whole philosophy of the User Experience and in the blissful feeling that you are helping the user, you must do him good!
One of the works was the analysis of the use of filters by users on the site in the section of stocks, which would potentially fit the user model (mental) and would serve as the foundation for justifying the development and implementation of filters based on users' behavioral patterns.
In the collection and analysis of data we used the following technologies:
Ecosystem # 1
- jQuery (for quick markup)
- GTM (as part of an isolated and convenient hierarchical front-end tree that works atomically and independently of the site's muzzle)
- Google Universal Analytics Enhanced Ecommerce Abstraction (this data scheme is applicable in ecommerce, but nobody forbids using an abstract approach here and implementing it on content sites that do not sell online)
Ecosystem №2
- Pandas (for data analysis)
- Seaborn (for data visualization)
- PGA (self-developed library for uploading data from GUA, detailed description of the library )
2. Collect the necessary data
We will not paint the basic tasks and capabilities of GTM, we will immediately get to the point.
When marking up the section of stocks with filters, we used GUA extended e-commerce abstraction. Since, in fact, the site is not an online store, we chose a store card as a product for a page with a list of stores. For adding a product to the cart - click on the store card, viewing the item card - go to the store page.
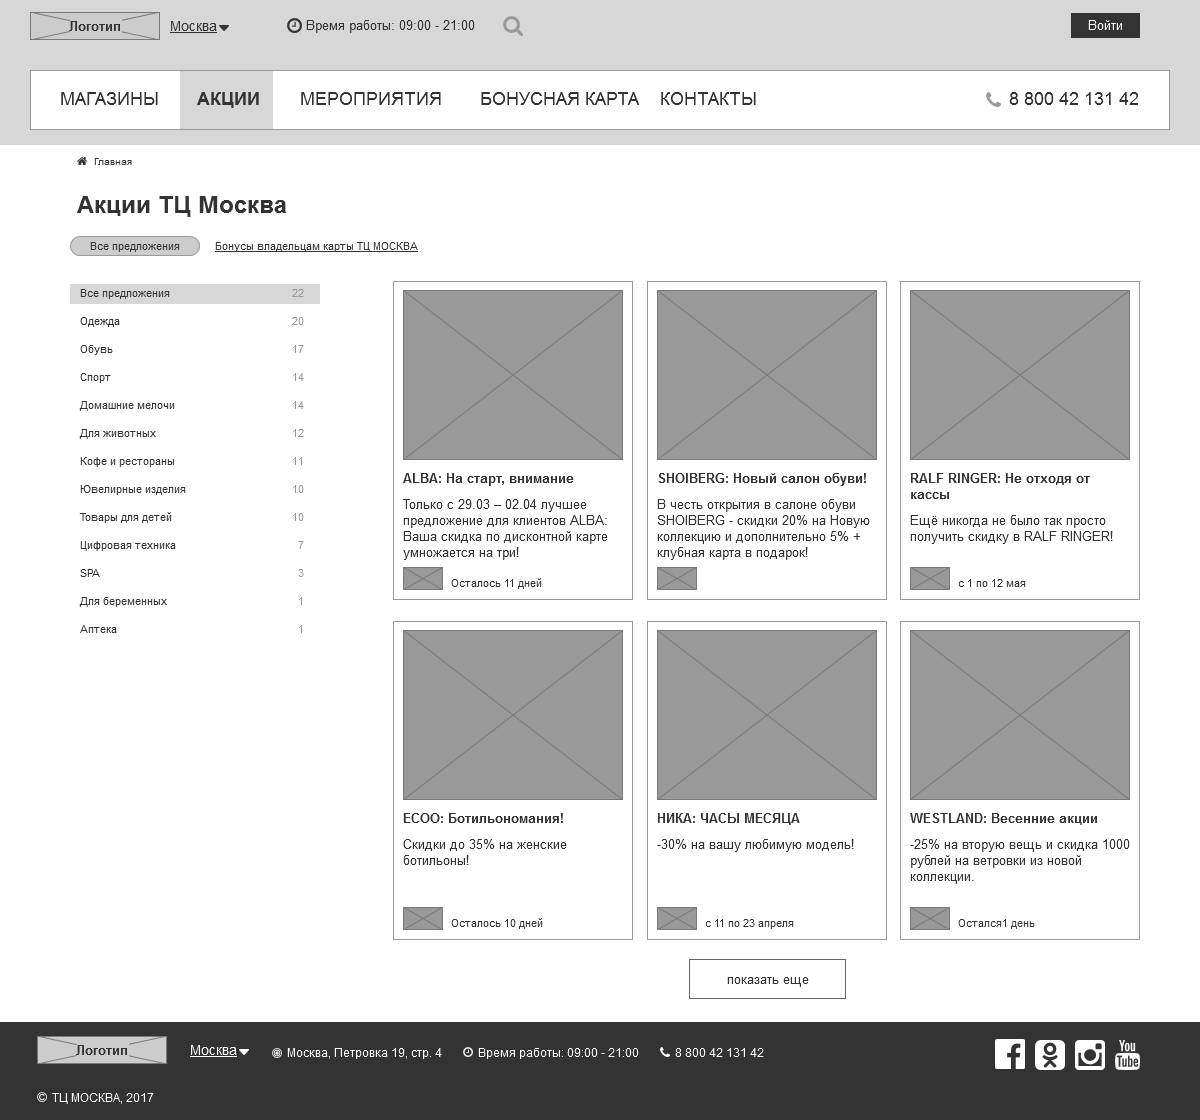

As values of the fields Product List Name and Product Variant, we send data in the format of a serialized object, in which the values are:
In the first version - information on the current filter settings.
In the second option - additional information on the action, for example, the time when the action will end. In the future, we will parse the serialized object using Pandas .
In fact, this problem can be solved more simply by using GA user parameters. But, as you know, there are only 20 of them in one resource in the standard GA, and this number is not enough. In GAP with 200 user parameters, the same problem can be solved much easier.
An example of the form in which an Enhanced Ecommerce structure is transmitted:
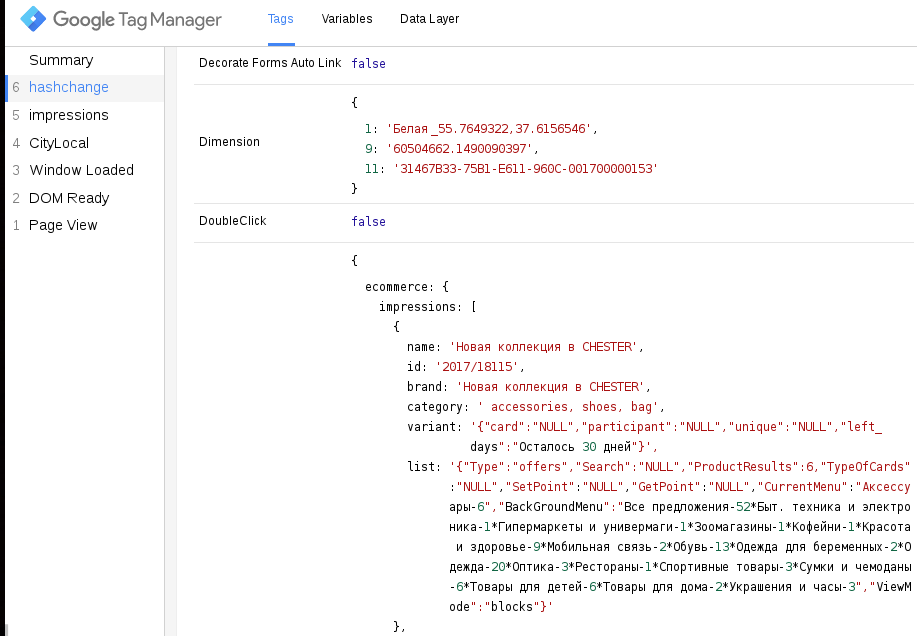
Consider chunks of the markup implementation code:
For all the code, we have two main selectors, the mainItemSelectorForClick and mainItemSelectorForView , to which JS events cling, in this piece of code it is scrolling.
When scrolling, we once send only those shares that are currently within the scope of the screen by the selector “: in-viewport: visible”. The global object window.ec_ is the Enhanced Ecommerce data structure. This allows you to further substitute values in the tags for hits. Next, we push 'event': 'scroll', in order to bind another tag to this event with the value window.ec_
At the very end, the algorithm substitutes a class for each stock, which says that the stock has already been viewed with an 'impressionSent' and in the future it does not need to be added to the Enhanced Ecommerce array. This is done in order to avoid oversaturation of data and not much exceed the limits on hits per day.

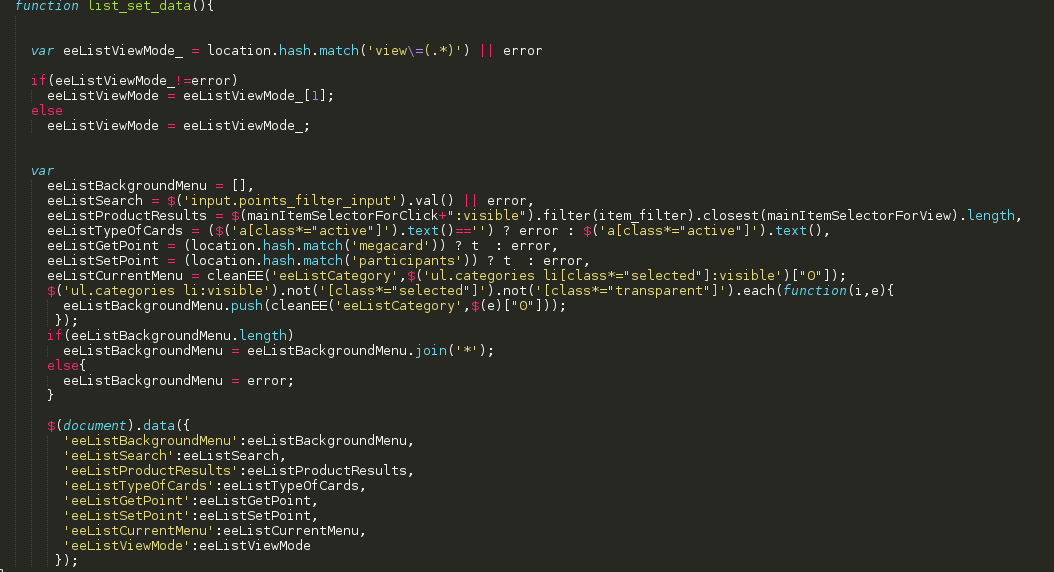
The list_set_data () function substitutes data- * attributes for $ (document), in other words, we save the current value of the filters into one global object - document.
At the output we have a saved data structure, which can be accessed from other tags or pieces of code.
Let's dwell on the item_generate_json function.
The function is responsible for creating a product object with serialized fields using the JSON.stringify ({}) function, which converts the object into a string. Some of the object's field values are initialized using the data - * jQuery attributes, which were previously created in other pieces of code.

If you walk specifically on the serialized objects, then the following parameters:
Type - sheet type (in our example, these are stocks). In the article we consider the analysis of the section of shares, but this is not the only section of the site.
Search - this field contains the current key request for this promotion, or NULL, depending on the existence / absence of the search.
ProductResults - calculates the number of entities on the page, in our case the number of shares.
TypeOfCards - a card type, in this case, the business had a deposit option of the card, or a credit
CurrentMenu - the current clamped category filter in this hit.
BackGroundMenu - current residual category filter menu in a given hit (which is left)
ViewMode - stock sorting type (block or list)
...
In addition, SetPoint - scoring points, GetPoint - scoring points ...
The following is what we get in the Google Universal Analytics interface:
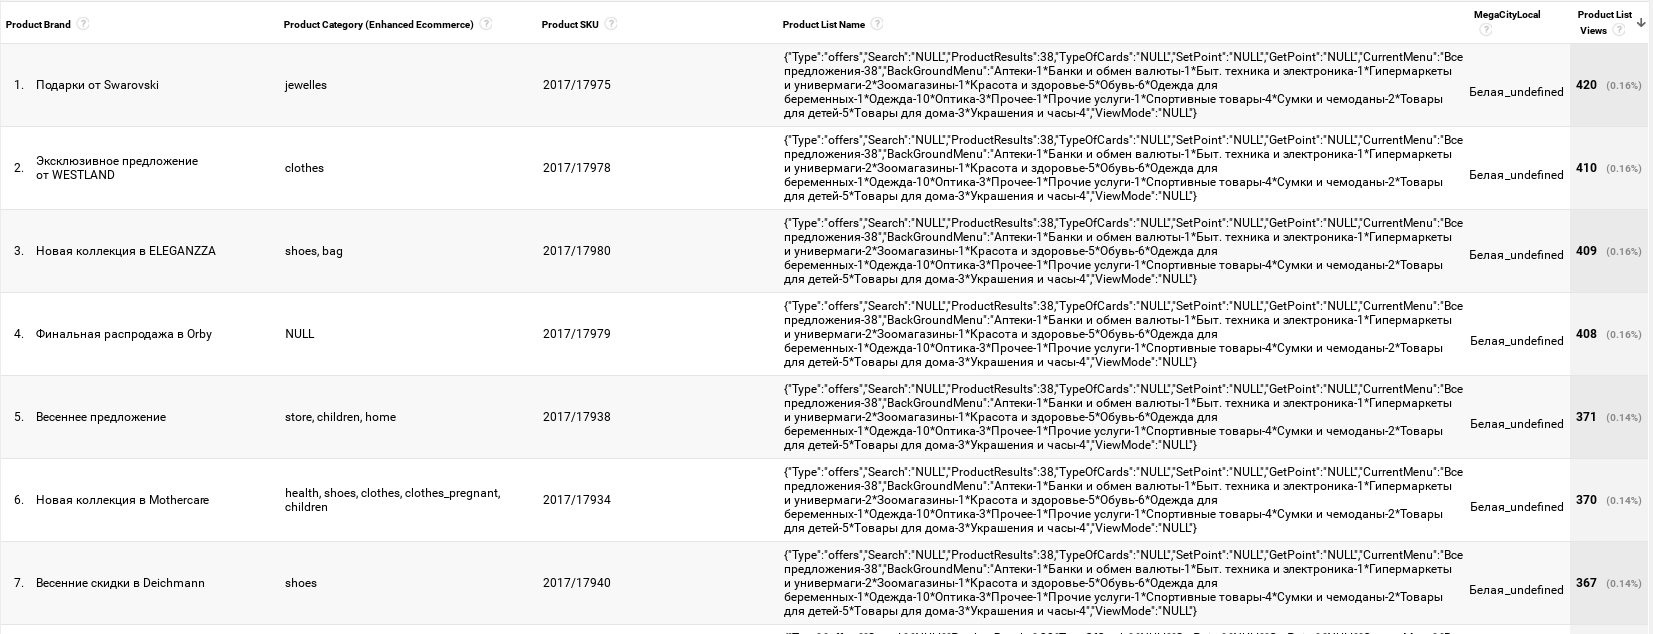
Also, do not forget that in the case of streaming or batching data into your own database, the serialized objects will at first glance be out of place and do not meet all the standards of the database. However, I can assure you that using, for example, ClickHouse, this functionality can be implemented through functions for working with JSON .
3. After collecting enough data, we proceed to analyze them.

Unloaded data using PGA script. The script allows you to upload data by the day, which allowed for a large amount of data to exclude the sampling of data and obtain exact figures on the behavior of users.
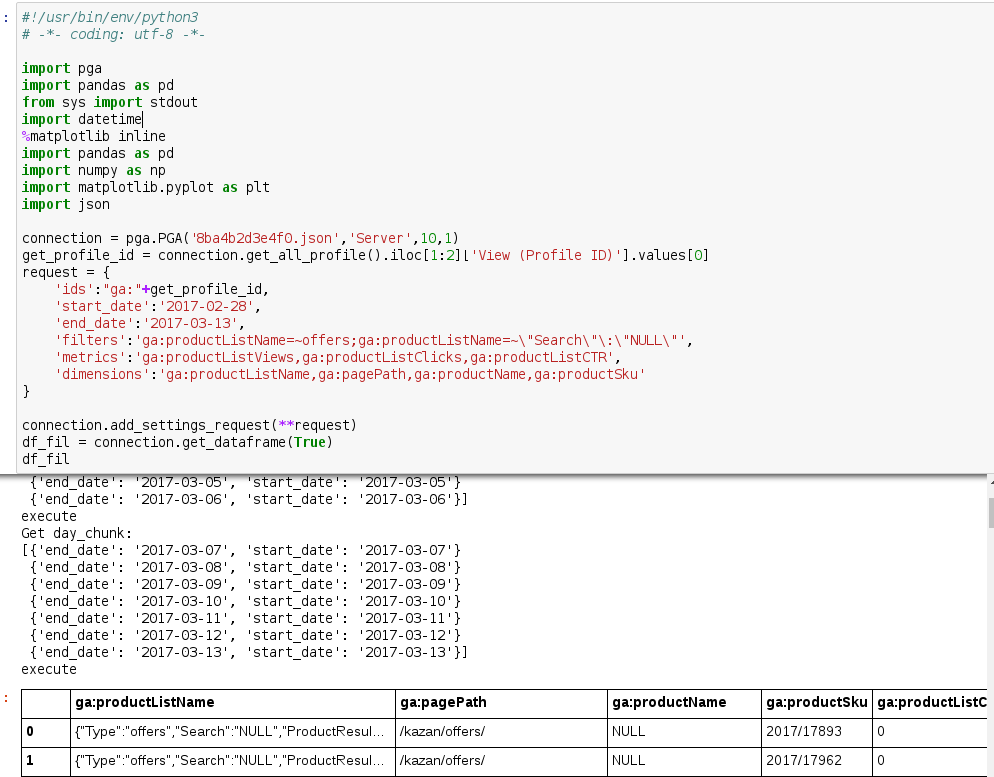
Let us analyze in parts the code algorithm:
We connect libraries. All the libraries listed above in this article are imported here.

2. We generate a query from Core Reporting V3 to Google Analytics with server connection settings (since the Jupyter notebook was launched from under the server). Do not forget to specify that the raw data for each day is grouped automatically.

3. The code below creates a new DataFrame and joins the Series into it with values from the ga: productListName column from the source DataFrame previously decoded by json.loads.
In other words, we took a function that gives the “right” or “permission” to use the format of the current value as JSON on the column 'ga: productListName' from Google Universal Analytics and got a new DataFrame from it on the already new columns.

4. We filter the columns, removing the excess and select the ones related to the shares.

5. In our case, the category menu consists of text, for example, 'Clothing - 1', (where the number indicates the number of shares in this category), so we must divide this entity into two: Category, Number of shares in this category. Since we are not interested in the number of stocks, we can already write a list / array in the new Pandas column using Series split lines

6. Create new columns with the values “Names of the current category” as a row and the number of stocks in this category as a number with the type 'int'

7. After, we do groupby on the current category ('Current Category Name'). After that, depending on the type, we average or summarize the grouped columns of Google Analytics metrics (product list click, ctr and count).
We also select only those lists that have collected enough data by applying the df_fil_ac_g ['ga: productListViews']> 1000 filter and sort the list.
As a result, we obtain a list of columns with metrics and filter categories.

Since the categories are written in Russian, and some libraries curse encodings, we translate them with English writing:

8. The result obtained was visualized by a hit-maker using Seaborn, and the result was the following:
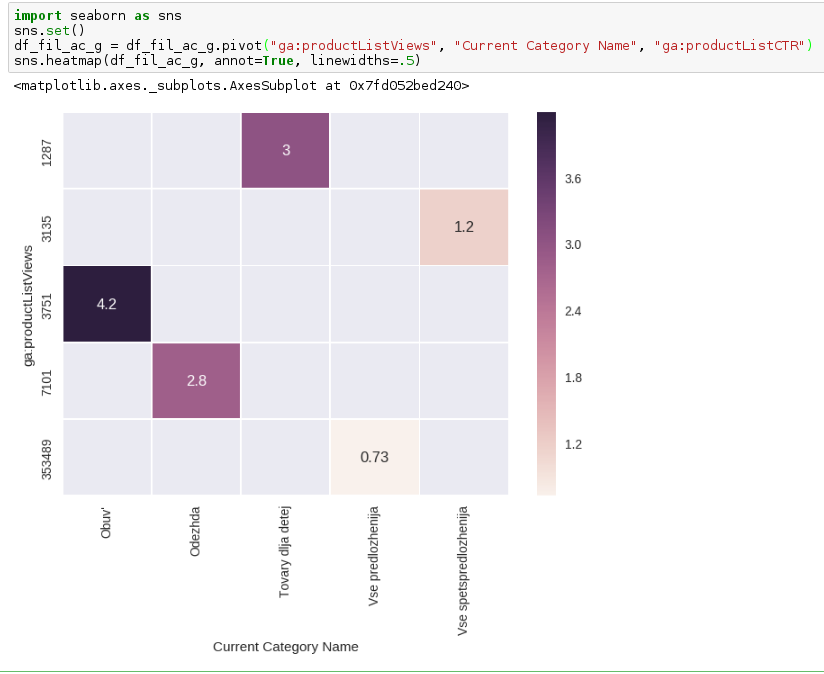
X-axis - filter categories
On the y axis - the number of views of cards with filters
Numbers in squares - CTR by filter cards
The result can be interpreted as:
Almost every fourth person changes the filter from the standard 'All offers' to another one.
The overwhelming majority of stocks with the filter "All offers" or "All special offers" (and yes, they differ in shares) have a low CTR in comparison with other filters. Perhaps people have a different behavior pattern. There is a chance that with clamped values, for example, Shoes, Clothes or combining these categories into one, the mental model of a person who is used to seeing unique actions on the first interaction with the business for quite logical groups of goods rather than all that are in the database will be better suited .
However, this statement is just a hypothesis and must be verified. In the context of our task, we have prepared a proposal for conducting a split test in combat, where, by default, in each variant, squeezed shares alternate.
Source: https://habr.com/ru/post/328742/
All Articles