Discipline, accuracy, attention to detail, part two (OLAP, SSAS)
Introduction
In this article, I will continue to talk about my experience with Microsoft Analysis Services. In addition to the previous article, I want to write about non-standard solutions that were made in the last project. These solutions brought me closer to Microsoft Analysis Services more closely, I began to respect him more and do with it something that previously seemed incredible to me.
The sum of the average for the period
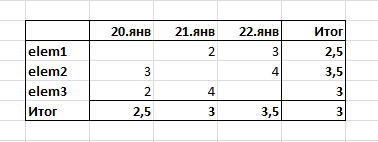
The customer requested a sum of average values for each element for the period, as shown in the picture below:
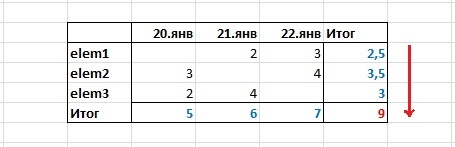
That is, the idea is that, in terms of the elem1, elem2, ..., elemN elements, the cube counted the average for each element for the selected period, in all other cases the sum was considered. It is required how to change the behavior of the cube for one dimension, and for all others to leave the standard one (in the described case, the standard behavior is SUM).
Solutions:
- First option:
')
For this option, you need to create a hidden dimension [ELEM COPY] by simply creating a copy of [ELEM] and setting the Visible property to False. Next in the “Calculations” cube section, select “New Calculated Member”, as shown in the figure: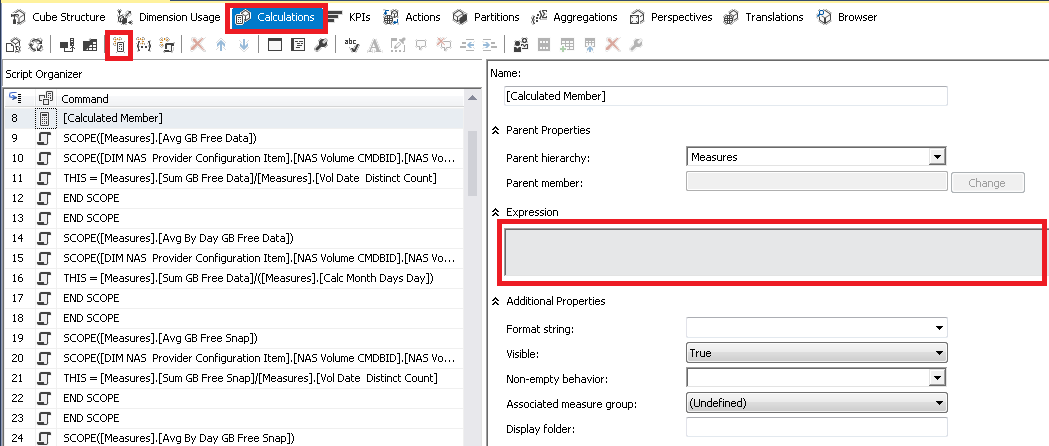
and in the window for entering expressions write:iif ( not isleaf([ELEM].[ELEM SK].currentmember), sum(EXISTING [ELEM COPY].[ELEM SK].currentmember.Children,[Measures].[FCT VAL]), [Measures].[FCT VAL] )
where [ELEM COPY]. [ELEM SK] is a key attribute of the hidden measurement.
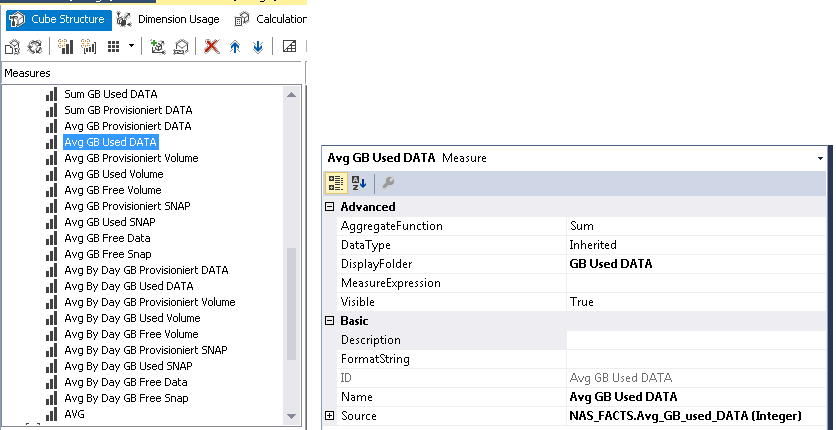
[Measures]. [FCT VAL] is an AvarageOfChildren aggregation, i.e. when assembling the cube, they created an AvarageOfChildren dimension type and it automatically calculated it. An example of how to create a dimension with AvarageOfChildren aggregation is shown in the figure below: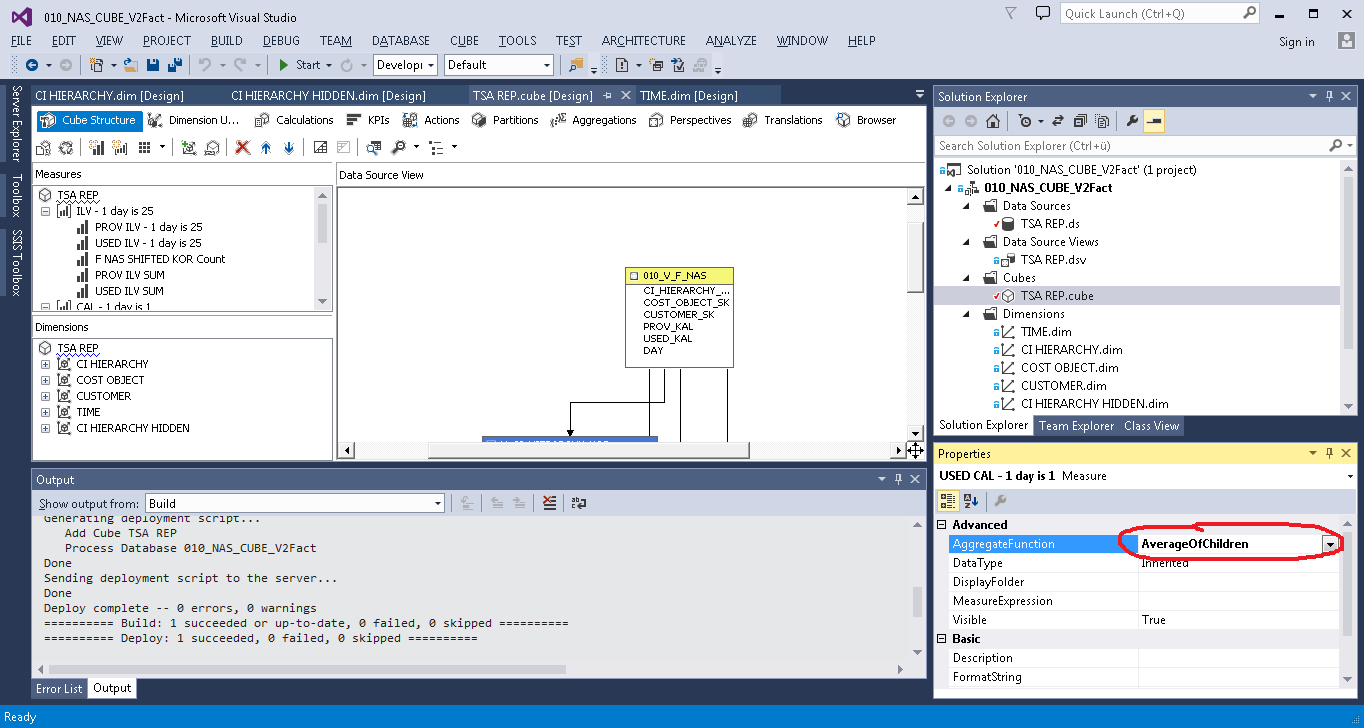
- SCOPE solution:
This decision showed me my colleague, in my opinion, it is more simple to understand, although a little more difficult to implement.
What need to do:
Rewrite the select for the fact table:
Instead:SELECT [DATE] ,ID_CO ,ID_CUST ,ID_SYS ,ID_VOL ,ID_QUAL ,GB_used_DATA FROM [000_REP].NAS_FACTS
Write:SELECT [DATE] ,ID_CO ,ID_CUST ,ID_SYS ,ID_VOL ,ID_QUAL ,GB_used_DATA ,CONVERT(VARCHAR(10), [DATE], 120) + '|' + CAST(ID_VOL AS VARCHAR(MAX)) AS VolDate ,NULL AS Avg_GB_used_DATA FROM [000_REP].NAS_FACTS
where GB_used_DATA is a fact that we want to add to the cube. We want to make non-standard behavior for measurements with the ID_VOL key, for the remaining measurements with the ID_CO, ID_CUST, ID_SYS and ID_QUAL keys, the behavior should be standard and in our problem everything should be summed up. Only for ID_VOL should be considered the average for the period for each element, and the total for ID_VOL elements should also be summed up, should be the sum of the average values for ID_VOL.
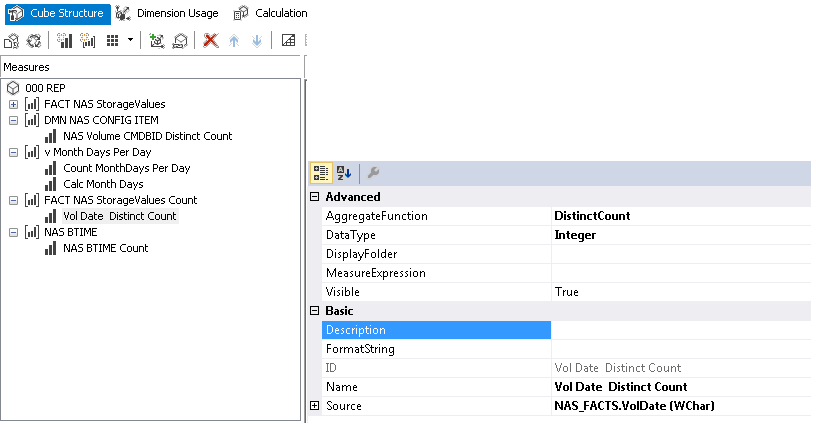
In the second query, 2 columns were added:- The 1st column will uniquely determine the date combination with ID elements, by which the sum of the average values should be calculated. In a cube on this column, a dimension with the DistinctCount aggregation function is added. The example in the figure below:
- The 2nd column always stores the NULL value in all rows of the table. In the second column, its name is important, it is necessary in order to be able to create a dimension in the cube, to which it would be possible to bind using the SCOPE function. It is also important that the aggregation function Sum is used for this measure. Example below:
Further, in the “Calculations” cube section, select “Script View”, and in the window for editing the script, insert the following code:SCOPE([Measures].[Avg GB Used DATA]); SCOPE([ID_VOL Items].[ID VOL].[ID VOL].MEMBERS); THIS = [Measures].[Sum GB Used DATA]/[Measures].[Vol Date Distinct Count]; END SCOPE; END SCOPE;
where [ID_VOL Items] is a dimension, the key of which is ID_VOL.
The figure shows the sequence of actions for this step: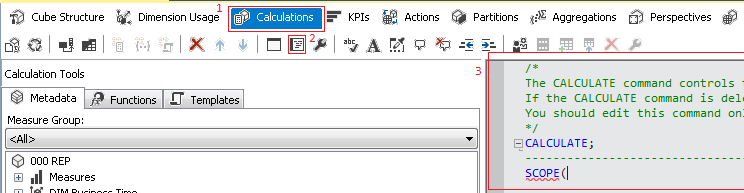
In this solution, we only summarize the expression that is written in SCOPE, since without a formula in SCOPE, we store there the value NULL, which comes from the query to the Database.
- The 1st column will uniquely determine the date combination with ID elements, by which the sum of the average values should be calculated. In a cube on this column, a dimension with the DistinctCount aggregation function is added. The example in the figure below:
Both solutions gave the same result and considered the sum of the average at the output, which was required in the assignment.
Statistical Average
After some time, the customer returned to the topic of calculating averages. This time, he demanded not the sum of averages, but the classical average, that is, the same functionality as the AVERAGE function in Excel. The customer constantly operated on the concept of “Statistical Average”, hence the name of this chapter.
It was necessary to calculate the average value over the entire range. Take the average of all elements for each day, summed up and divided by the number of days in the period. The result is the average value of one element for the period. The following solution was proposed:
CREATE MEMBER CURRENTCUBE.[Measures].[Avg GB Used DATA (AvgAll Only valid days)] as [Measures].[Sum GB Used DATA]/[Measures].[Count VCMDB Only valid days], VISIBLE = 1 ; CREATE MEMBER CURRENTCUBE.[Measures].[Count VCMDB Only valid days] as Count(NonEmpty({crossjoin([DIM Business Time HD].[DAY].currentmember.Children,[DIM NAS Provider Configuration Item HD].[NAS Volume CMDBID].currentmember.Children)}, [Measures].[Sum GB Free Data] )), VISIBLE = 1 ; 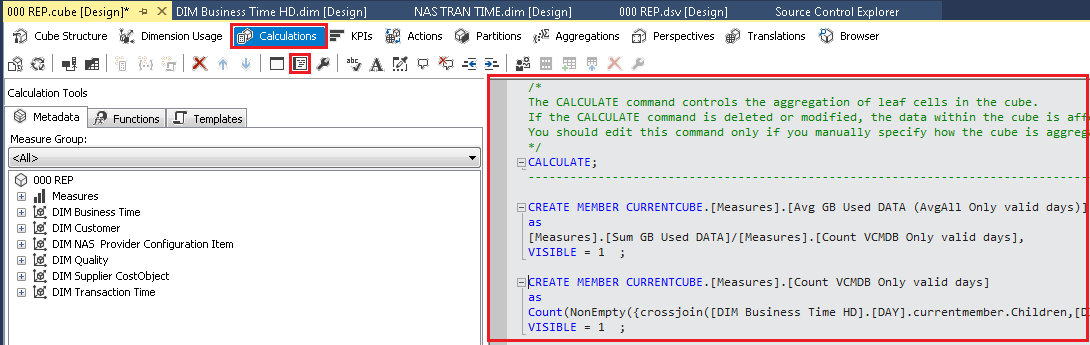
In this decision, only the days were taken, where the values of the elements were. A hidden measurement trick was also used (these are [DIM Business Time HD]. [DAY] and [DIM NAS Provider Configuration Item HD]. [NAS Volume CMDB]] measurements). I got the number of days I was using crossjoin.
If it is necessary to obtain an average over all values for all days, where the absence of a value for any day equals 0, then I used the following expression:
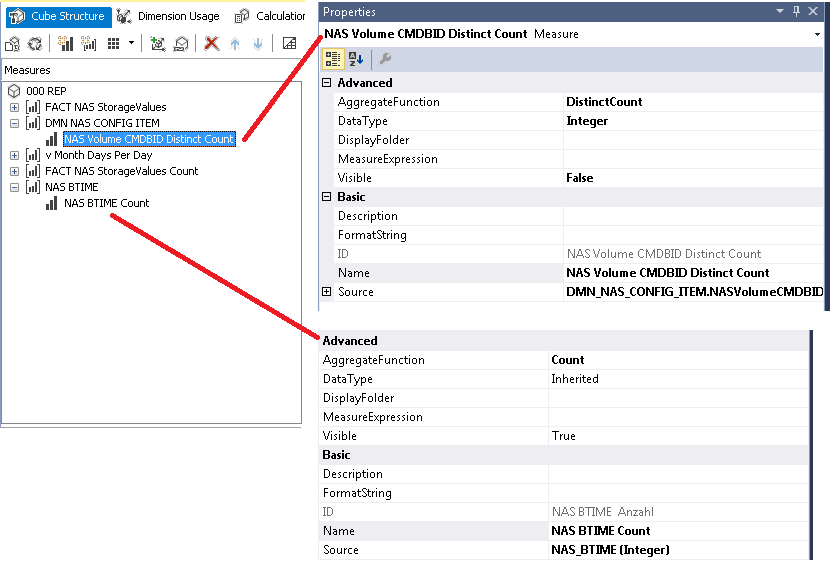
CREATE MEMBER CURRENTCUBE.[Measures].[Count VCMDB All days] as [Measures].[NAS Volume CMDBID Distinct Count] * [Measures].[NAS BTIME Count], VISIBLE = 1 ; CREATE MEMBER CURRENTCUBE.[Measures].[Count VCMDB All days] as [Measures].[NAS Volume CMDBID Distinct Count] * [Measures].[NAS BTIME Count], VISIBLE = 1 ; where [Measures]. [NAS Volume CMDBID Distinct Count] and [Measures]. [NAS BTIME Count] are cube measures based on dimension tables (time dimension and member dimension):
Another useful feature
In the process of working with the cube, demands were made in which the calculation of values varied from the level at which the hierarchy wanted to see it. That is, if days are selected, then we see the average for the period, if months is the amount. This was done using the level function:
CREATE MEMBER CURRENTCUBE.[Measures].[ML] as case when [DIM Business Time].[HIERARCHY CAL].currentmember.level is [DIM Business Time].[HIERARCHY CAL].[YEAR] then 3 when [DIM Business Time].[HIERARCHY CAL].currentmember.level is [DIM Business Time].[HIERARCHY CAL].[PERIOD KAL] then 2 when [DIM Business Time].[HIERARCHY CAL].currentmember.level is [DIM Business Time].[HIERARCHY CAL].[DAY] then 1 else 4 end, VISIBLE = 1; Total
To be honest, when I saw the requirements for calculating averages, I wanted to laugh and cry at the same time. Laugh from the fact that sometimes the average value was either greater than all the values in the selected range (as in the example with the sum of averages), or less. I did not describe the case with less in the article, because I could not understand the meaning - the customer required to divide the value for each day by the number of days in the month. And we had to cry because these requirements had to be implemented somehow.
Attempts will be limited to the standard AvarageOfChildren, which summarizes all the figures for the day, then adds these amounts and divides by the number of days in the period, but did not succeed. The customer insistently demanded compliance of reality with his picture of the world. All our solutions were subjected to rigorous and rigorous testing. The question of trust between us and the client has disappeared in the early stages of interaction. He was constantly looking for a dirty trick and the solution, instead of simple and intuitive, turned into something strange and monstrous. But in all there is a benefit. Thanks to these requirements, I had to deal more closely with the work of the OLAP cube and learn how to work with arbitrary aggregations. So that this experience was not in vain and helped in the future to solve similar tasks not only for me, I decided to share it with you. In general, as in a joke about plumbers:
They attached a trainee to the plumbing. Call on departure. Come over. Sewer manhole. Shit flows from it. Plumber coming to the hatch and diving.
In a minute, he emerges, shouting:
- The key is at 19.
Dives again. Half a minute comes to the surface:
- Gasket No.6.
Dives again. Emerges:
- The key to 26.
Dives. In a minute, he comes up. It turns out, shakes off and lights. He sat down, caught his breath and said to the intern:
- That's it! Study, student! Otherwise, you'll be serving the keys all your life ...
Source: https://habr.com/ru/post/328688/
All Articles