WebGL Application Performance
Kirill Dmitrenko (Yandex)
Hello! My name is Kirill Dmitrenko, the last 4.5 years I have been working in Yandex as a front-end developer. And all this time I was haunted by the panorama. When I came to the company, I did internal services for panoramas, after that I solved problems on panoramas on large Yandex cards, and recently made a web player of panoramas on Canvas 2D, HTML and WebGL. Today I want to talk to you about the performance of WebGL applications.
First, we will look at what WebGL is, then we will discuss how to measure the performance of WebGL applications, and finish by discussing some optimizations of WebGL applications and how I managed to apply them in the panorama player.
So what is WebGL? WebGL is an API that gives a web platform access to graphics card resources, i.e. it allows you to draw hardware-accelerated graphics, including three-dimensional, directly in the browser, directly from your Javascript.
')
The structure of a WebGL application can, in a sense, be compared to how our ancestors saw the universe. Well, at least with one of these visions.

Those. This is a kind of world that relies on elephants, and they, in turn, stand on a big turtle. And in this picture a world in which all logic, all meaning, and everything happens, will be our application. And our WebGL application will rely on three main types of resources:
- Buffers - such large blocks of bytes, where we put our geometry, which we want to show to the user, our models.
- Textures - pictures that we want to impose on our models so that they look more beautiful, more natural, look like objects of the real world.
- Shaders are small programs that run directly on the GPU and tells the GPU how we want to show our geometry, how we want our textures to be applied to it, etc.
And all these resources live, are born and die in the context of the WebGL context. WebGL context is such a big turtle in our picture, through it we get access to all resources, we create them and, besides, there is still a big state in it that tells how we connect these resources to each other, how we we link together these buffers, shaders, textures, and how we use the results of shader calculations. Those. a great condition that affects rendering. And, of course, it would be cool for our application to work faster.
But before talking about optimization, you first need to learn how to measure. It is impossible to improve what we cannot measure. And the simplest tool that allows us to do this is the frame count per second.

It is available in Chrom, it is easy to do it yourself, and with it, in general, everything is clear, that is, if we have a lot of frames per second, then this is good, few frames are bad. But one thing to keep in mind is that the FPS in the application is limited by the refresh rate of the user's screen. For most users in the wild, this is 60 Hz, i.e. 60 frames per second, and therefore it does not matter whether we generate our frame in 5 ms, 10 ms ... There will always be 60 frames. The frame per second counter must be treated with a certain amount of skepticism. And yet, if we have few frames per second, the application slows down, we start looking for bottlenecks in it. We are starting to try to optimize it.
I usually think in such cases as you - turn on the profiler, start profiling the application, look at the functions in which my JavaScript spends the most time, examine these functions under the microscope and try to do something with them.
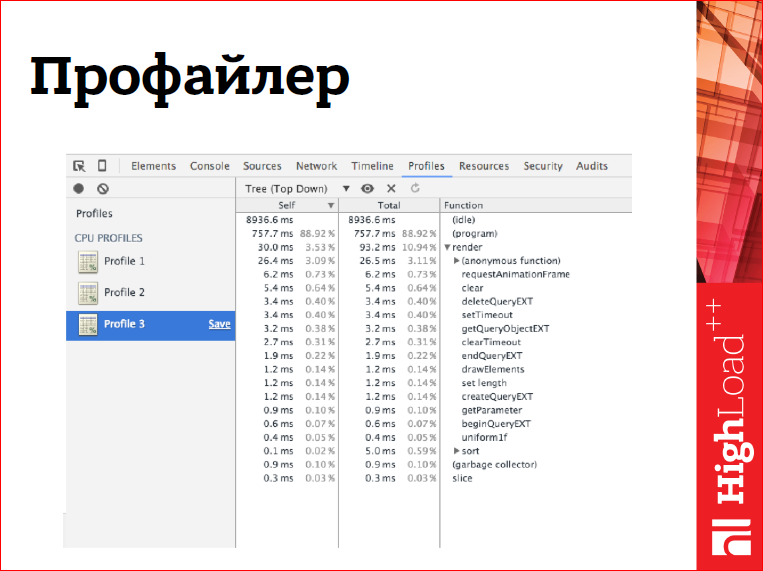
However, in the case of OpenGL applications, the profiler faces a problem.

The fact is that the WebGL API is partially asynchronous, i.e. all draw calls are asynchronous, some other calls are also asynchronous. What does this mean, for example, with draw calls? That when, the call returned control to our JS, then the drawing did not end by this moment, it will end sometime later. Moreover, it may begin even later than we regained control. Those. all that the draw call does is - it generates some command, puts it in the buffer and returns to us and says: “Go! Farther!". Accordingly, in the profiler such calls will not come up to the top, and even if our drawing is slow, we will not see it.
But not everything is so bad, some calls are still synchronous, and some calls, they are not only synchronous, but they also synchronize our context in a malicious way. Those. They not only do the work that we put on them synchronously, they also, while blocking our application while waiting for the end of the execution of all the tasks that we put on the context before that, i.e. all drawings, all some state changes, etc. Just such problems profiler helps us catch.
And with drawing, another tool called EXT_disjoint_timer_query can help us.
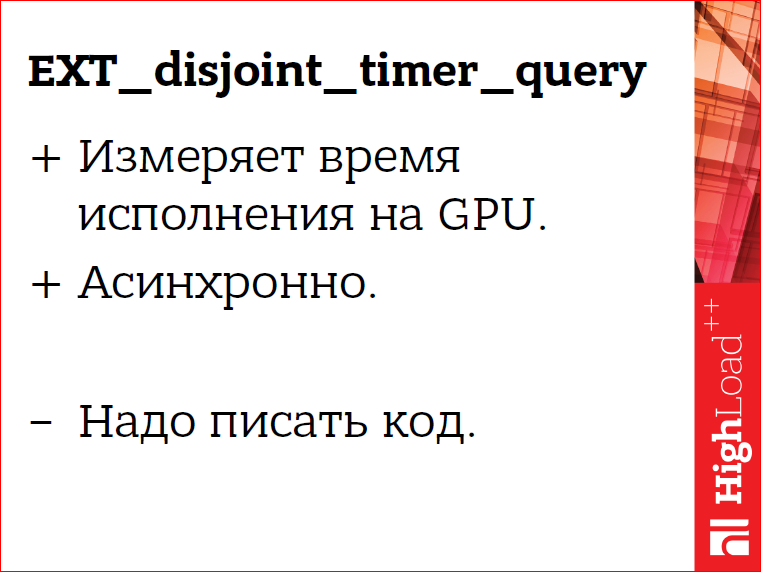
This is an extension for WebGL, it is still terribly experimental, i.e. This is another draft extension. It allows you to measure the execution time of our teams on the GPU. At the same time, which is very cool, it makes it asynchronous. Those. it does not synchronize our context in any way superfluous, it does not add much runtime overheads, i.e. All the code we write to measure the performance of the application can be ship directly into production, directly to users. And, for example, collect statistics. Or, even better, based on these data, on the basis of these measurements, adjust the picture quality to the user's equipment, i.e. On smartphones, show users one picture, on tablets - a better quality, because there is usually more powerful hardware, and on desktops, where there is a very powerful hardware, show the coolest picture with the coolest effects. But at the same time, you need to write some code around it - this is a small minus.

EXT_disjoint_timer_query allows you to measure the execution time of the first or several calls directly on the GPU. It also allows you to set accurate time measurements in the pipeline. Those. it allows, for example, to measure how much time our GL teams go from our JS to the GPU, i.e. what are our delays in the pipeline.
Another EXT_disjoint_timer_query is a synchronous API, it allows you to create query objects for the driver, for the WebGL implementation, and work with query objects goes with it. You create a query object and say: “No, I want to put an exact time stamp on this object or start measuring the execution time of a group of commands with it”. After that, you finish building the frame and usually to the next frame, though, perhaps later, you will be able to see the measurement results in nanoseconds, which is quite accurate. And these measurements can be used.
Let us summarize the conclusions about the measurements.
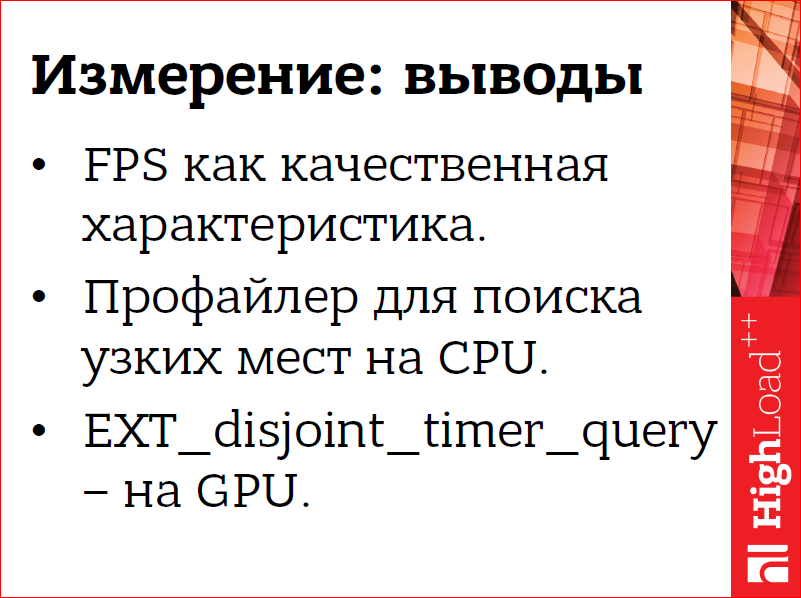
We have a frame count per second as a kind of quality characteristic of the application, which allows you to tell us whether we are slowing down or not. And if we slow down, then the JS profiler will help us with finding bottlenecks on the CPU in our JS, in some kind of math, in some kind of supporting code. EXT_disjoint_timer_query will help us with finding the bottlenecks on the GPU.
Ok, we learned to measure performance, we learned to look for bottlenecks, now we need to understand what to do with them further. Here we discuss only some of the optimization. Computer graphics is such a large area of hacks, deceptions and optimizations of strange ones. We will discuss only some general optimizations, the way I applied them in the panorama player.
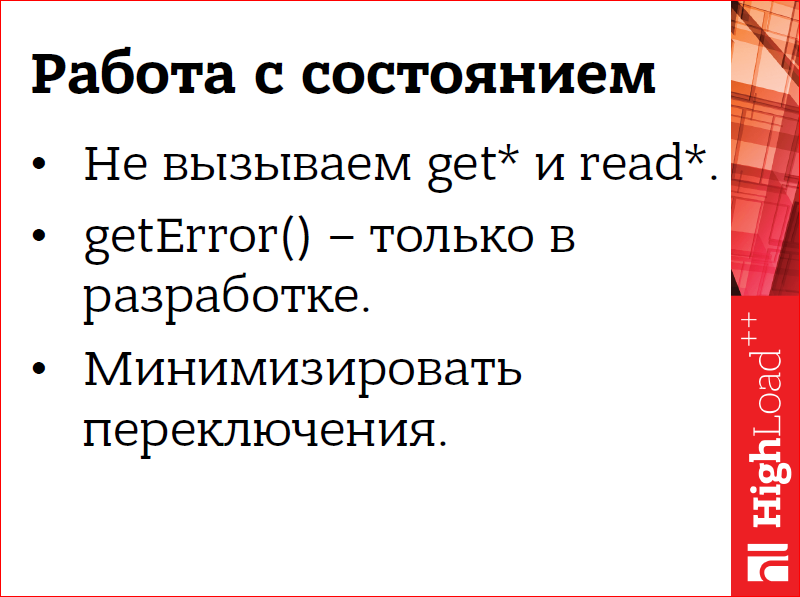
And the first rule that needs to be adopted on the way to the fast GL application is to work carefully with the WebGL state. As I said at the very beginning, in a WebGL context there is a large chunk of state that affects rendering and you need to work with it carefully. In particular, you do not need to make calls to get * and read *, i.e. calls that request the current state of the context or read data from the video card. If we really need it. Why? Because these calls, not only are synchronous, they can also cause the synchronization of the entire context, thereby slowing down our applications. In particular, the getError () method, which checks whether we have an error in working with the WebGL context. It should be called only in development, never in development. And it is necessary to minimize state switching, not to do it too often, because each switching costs us something, including it can also cause context synchronization, and generally does not do any useful work.
How can it look like in our code?
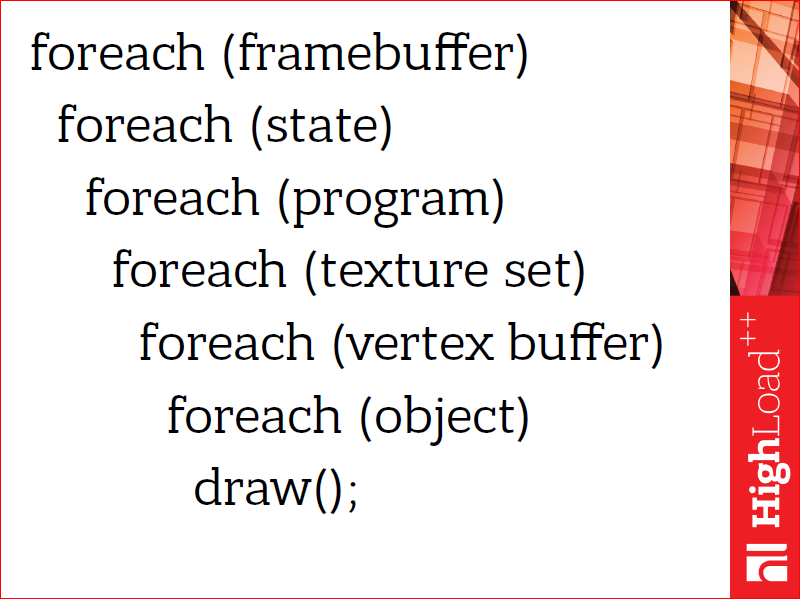
In particular, it may look something like this, i.e. nested loops, where in the outer loops we switch more expensive states, we switch them less often, and in more nested loops we switch states that are cheaper to switch. In particular, connecting framebuffers or switching shader programs is quite expensive switching, they are almost guaranteed to cause synchronization and, in general, take a long time. And switching textures and shader parameters - they are faster, they can be done more often.
But in this remarkable design can be further optimized.
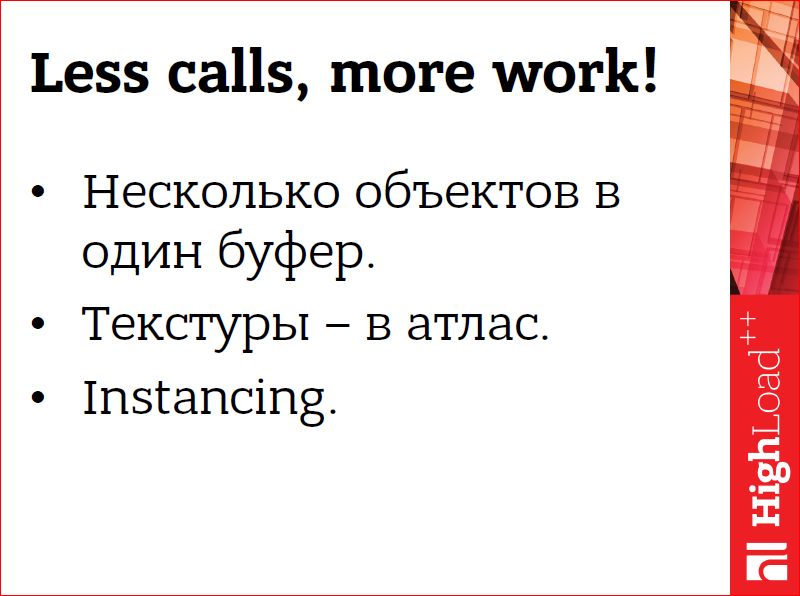
You can make fewer draw calls and more work for each, i.e. Each draw call adds some overhead to the validation of the state, to send this data to the video card. And this overhead would be good to blur. And you can blur it in one way only - by making these calls smaller, adding less overheads, while doing more work for each call. In particular, you can put several objects, several models that we want to draw, in one buffer with data. And if they use textures, then all these textures should be put in one big picture, which is usually called texture atlas. And in this way we will bring several objects to the fact that they will require the same state for drawing, and we will be able to draw them in one call.
There is such a good technique, called Instancing, which allows you to draw several copies of the same object with different parameters in one call. A good example of Instancing optimization is the particle system. I wanted to show the logo of our wonderful conference we are at, drawn using a particle system, i.e. these are small objects, small models, of which there are a lot of them, there were 50 thousand of them. And in the first case, I drew each of them separately, with a naive approach. And in the second case, I used a special extension.
In general, using extensions is a good practice, they often have very cool features, without which it is difficult or impossible to do some things. On the contrary, it is necessary to use them carefully, i.e. you should always leave a siding in the code that will work without extensions.
I used ANGLE_instanced_arrays there, which implements Instancing for WebGL, i.e. I put all my parameters for all copies of the objects into a large buffer, told WebGL that this is a buffer with copy parameters, and - hop! and it was drawn. And then there was a beautiful effect, that from 10 to 60 FPS everything went up there.
What did we have with this business in panoramas?

In panoramas, the minimization of context switching was actually free. Why did this happen? Because our task itself was so, i.e. we draw in the player first a panorama, then object signatures, and then controls, transition arrows and a quick transition washer. And from this formulation it followed that we draw the same objects side by side in the code. In this case, we applied Instancing for markers, i.e. we draw all markers, all object labels in one draw call. And we also do not generate draw calls for panorama sectors that are not visible. Why generate a call for something we still won't see on the screen? Those. a technique commonly called viewport culling or frustrum culling.
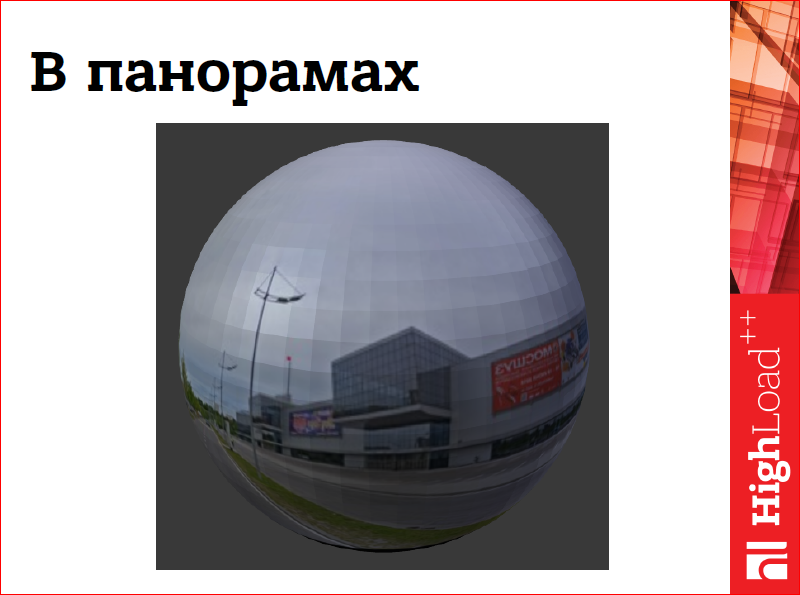
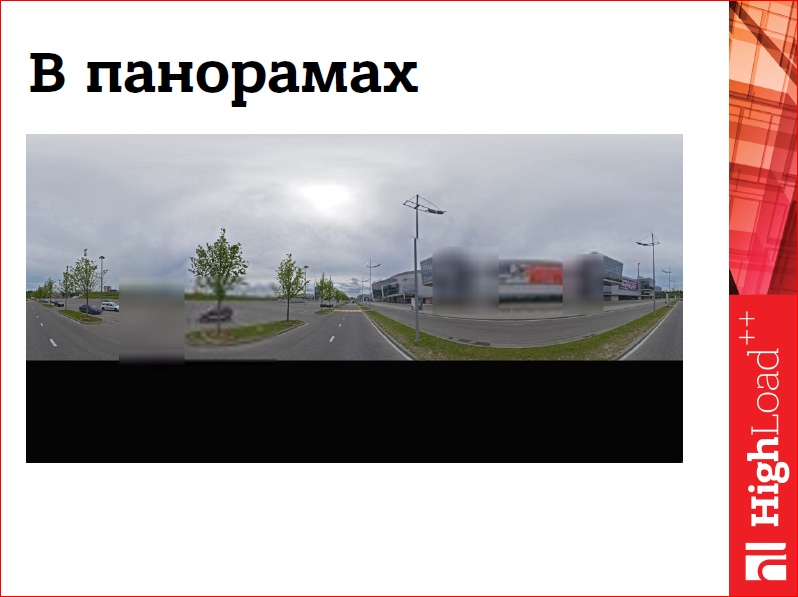
And in this place, it is important to say that in Yandex we have spherical panoramas, i.e. this is some kind of picture superimposed on a sphere. When you open the player, you are “standing” in the center of this picture and look outside. So it looks, if you look outside the sphere, and not from the inside.
This is the panoramic structure, the panoramic picture coming from the server, i.e. we have it in an equal-rectangular projection, and we keep it in this way:
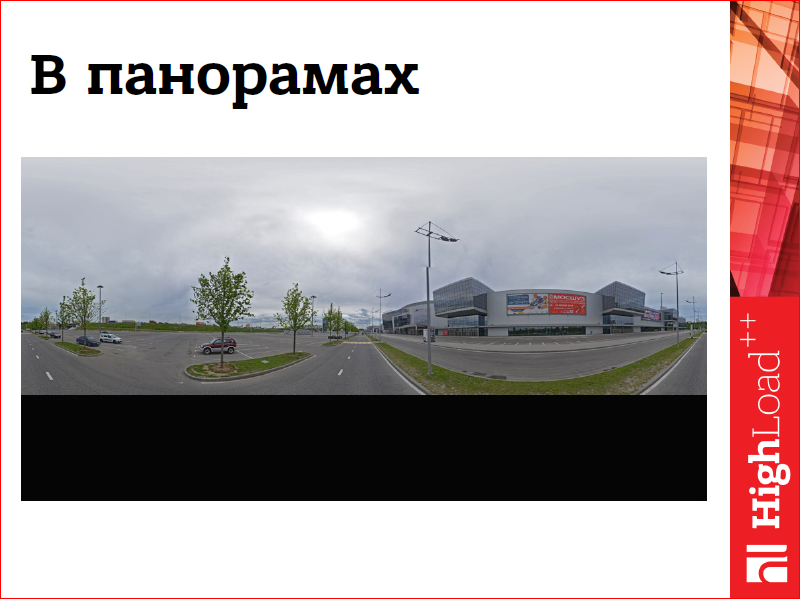
We also cut it into small sectors so that it is convenient to work with it in WebGL:
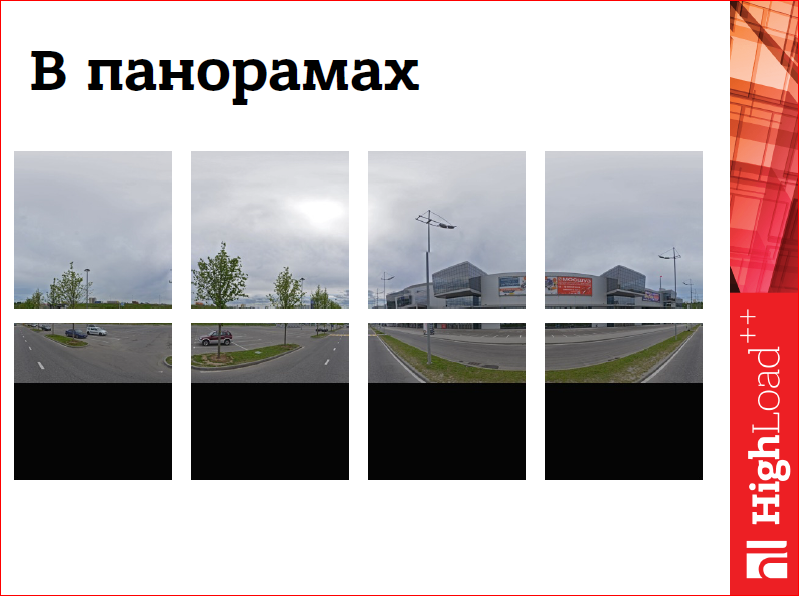
WebGL cannot create very large textures.
And for each such sector, we can calculate whether it falls on our screen or not. If it does not fall, we not only exclude it from the list for drawing, we also delete the resources it occupies, so save memory. As soon as it becomes visible again, we allocate an empty texture for it, and we reload this image from the browser cache.
Somehow it looks like in geometry, i.e. each sector of the texture corresponds to a sector in the geometry of the sphere, and this is how it is drawn:

Another big and terrible sin in WebGL applications is Overdraw.

What is Overdraw? This is when we count the pixels several times. For example, as in the diagram shown on the slide. If we first draw a rectangle, then a circle, and then a triangle, it turns out that part of the rectangle, and after that, we considered part of the circle in vain. We still do not see them, and the resources spent on them. It would be nice to avoid it. There are different techniques for this.

The first is to count, as we do with texture sectors, invisible objects, i.e. Objects that are closed by other objects from us, on the CPU in our JS and do not draw them, do not generate draw calls for them. This technique is called occlusion culling. It's not always easy to do in JS, JS is not very fast with math.
You can apply simpler techniques, for example, sort objects by depth, i.e. draw them from near to far, and then the video card itself will be able to exclude from this calculation those pixels that it will know for sure that they will not get on the screen, that they are farther than those that are already in the frame.
And if it is difficult to do this, for example, because objects are extended or slyly self-intersect, you can make a Depth pre-pass, i.e. using very simple shaders to fill the depth buffer, thus telling the video card the distance of each pixel from the screen, etc., the video card can apply exactly the same optimization as in the previous case.

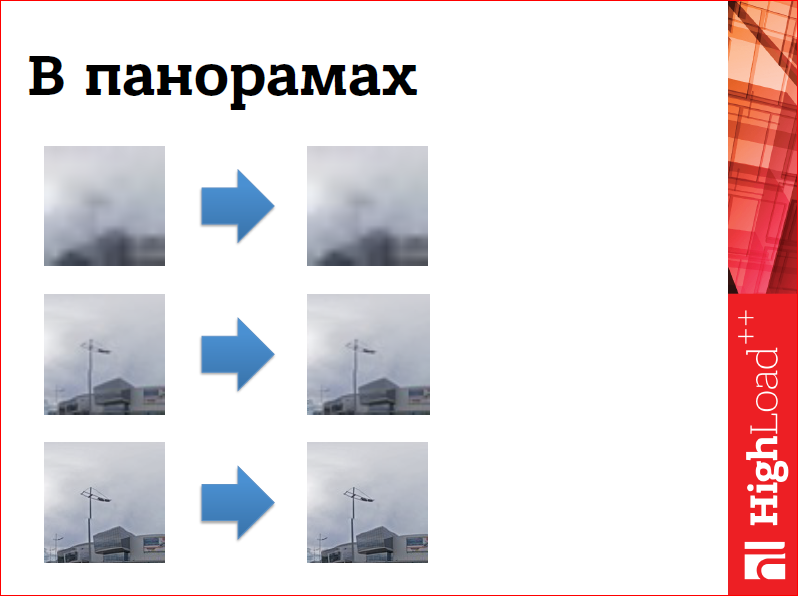
In the panoramas we faced overdrow, solving another problem. It should be that the panoramic image is sawed on the server in several sizes, in several resolutions, and we want to display to the user the size of the image that is most suitable for the current zoom player or the current zoom panorama. However, at the same time we want to show him the best quality that we already have, which is not always optimal, may be of lower quality. What does this look like?

First we draw the worst quality of the picture, the most blurry, the most soapy, because it comes the fastest. After that, we draw on top of it everything that we have better quality.
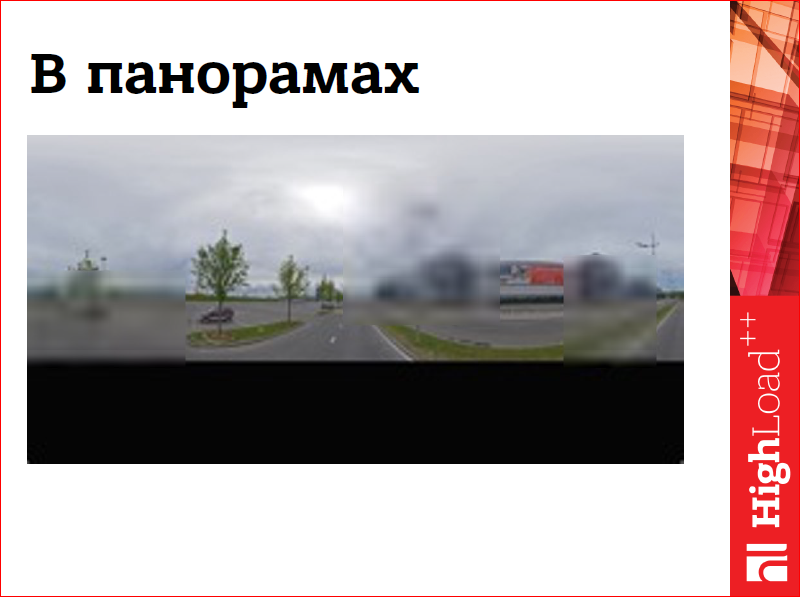
And here it is clear that not all parts of the picture we have, some are missing and they are transparent and through them we see less quality.
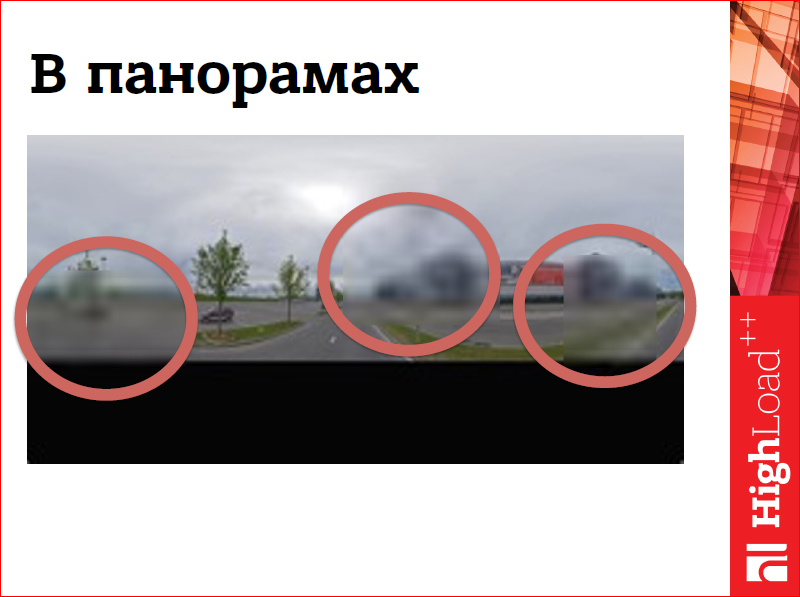
And after that we draw the best quality that we have, which can also be partially transparent, because more details of the picture have not arrived yet.
And again we have openings through which the previous layer is visible:

Thus, in four passes, we generate a panorama picture on the screen for the user. Why did this happen? Because, firstly, a part of the texture can be transparent, and it was not very trivial to calculate which, generally speaking, transparent, and which less quality parts of the texture, are closed with parts of better quality. Therefore, I had to suffer so much. On Retina-screens it was very slow, because there are a lot of pixels, and it didn’t work very well on mobiles.
How did we get around this? If you look closely at this scheme, which I have just shown, then we can assume that, generally speaking, this operation can be done at one time. Those. Once collapsing these layers into one kind of intermediate buffer, it can be called a cache, and then only draw it in the frame. Exactly what we did.
Suppose we have arrived data of poor quality, i.e. on the right we have the data, on the left - a panoramic texture, well, a piece of it. Good quality data flew in from us - we rendered the texture. Better data arrived - we painted its texture on top of existing bad data. Very good data arrived - and we also drew them on top. We always have one picture that is offline collected from the arriving data.
Of course, everything is not always so good, the network is unpredictable, and the data may not come in that order. But solving the problem is quite simple.
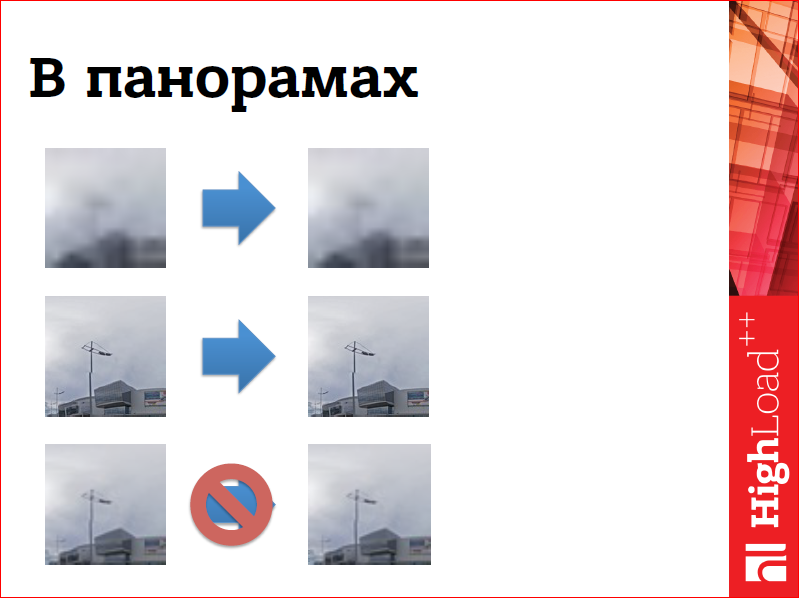
Again a bad picture flies to us, then the best picture flies in, we draw it on top. And then a smaller picture arrives; we, of course, do not display it. We leave the best quality we already have. So we reduce several passes of rendering the panorama to one, and this hastened us on different devices, including Retina-devices.
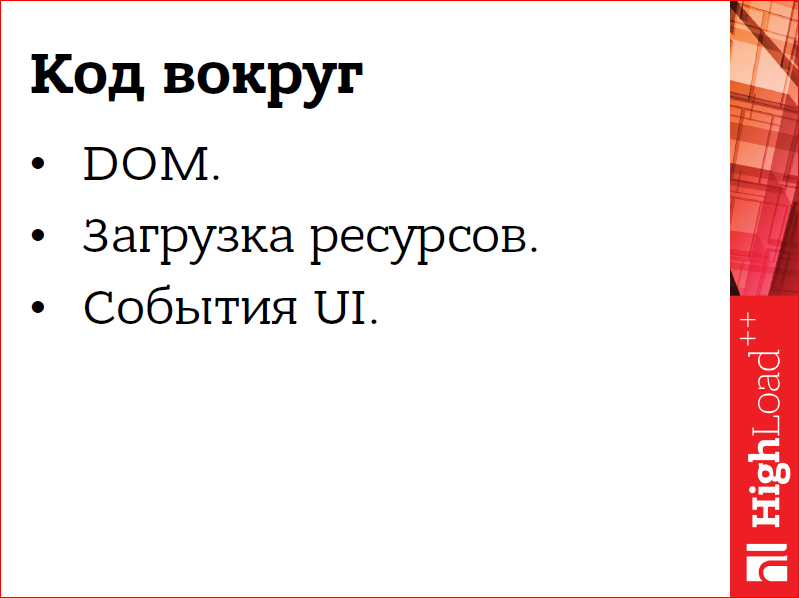
Often our rendering code, which is written on WebGL, works very quickly, it is capable of outputting 60 fps on smartphones, tablets, and desktop computers. But any code around that is inevitably present in our web application, code that updates the DOM, code that loads resources, code that handles user events, UI events, it starts to slow us down, i.e. it takes control for a long time, causing delays in animations, delays in rendering and slows down our application.

With this code, it seems, nothing can be done, except to break it into small parts, i.e. if we have 100 pictures loaded, then we don’t need to load 100 at once, we need to load 10, dozen, and five, as convenient. And write a scheduler that will execute this code only when there really is a time for it, when it will not slow down the animation.
For us in panoramas, this code was loading of tiles and crowding out the invisible parts of the panorama, about which I spoke at the very beginning. We did it very simply with him - we never do this while the panorama is moving, because if we have a static picture, it doesn't matter what our fps is, how many frames per second we show, maybe 1, maybe 60 - the user is not notice differences, the picture does not move, nothing changes on the screen. Therefore, we wait until the animation is over and recalculate visible tiles, recalculate visible sectors, textures. We create requests and manage resources.
In addition, the sources of problems were the events of the player's software interface. A player is a widget that is embedded in large maps, and large maps use some external events in order to display some of their additional interface elements.
With API events we acted quite simply. First of all, we slaughtered them, i.e. those events that need to be generated constantly, for example, while the direction of the user's gaze changes, the direction of gaze in the panorama, we have eroded these events, significantly reduced the frequency of their generation. But even this was not enough, for example, many problems in this place were created by the browser history browser API. We tried to update the link in the address bar for each change event, but it terribly slowed down everything.And so a special event was made that told the external code that the panorama had stopped and you could do hard work. The same scheme, by the way, is applied in the Yandex Maps API. There are special events for which you can do some more difficult work.
Let's draw conclusions about optimization.

The first and most important thing is that you need to carefully work with the state, because in the most unexpected place a malicious synchronization may occur, slow down our application. Do not call the reading state, do not read if there is no urgent need to read data from the video card and not cause a get error in production. It's the most important.
Make smaller draw calls and more work for each of them, so we blur the overhead they add.
Avoid overdraw by a variety of techniques, any that suit your application.
And the scheduler for the code around, i.e. scheduler for a code that supports rendering, and so that it does not take control for a long time and does not slow down.
Contacts
» Dmikis@yandex-team.ru
» Profile on Github
» Profile on Facebook
This report is a transcript of one of the best speeches at the conference of developers of high-loaded HighLoad ++ systems.
, , « ».
HighLoad++ YouTube, :(
- Frontend Conf WebGL:
- 3D- / (Avito);
- Web- / (Liberty Global);
- GLSL Web- , ? / (Liberty Global);
- Web immersion or virtual reality with WebVR / Tatyana Kuznetsova (DevExpress).
Interesting?Then we are waiting for you at the conference ! But this is for the money.
Or for free on the broadcast , which we organize together with Habr :). It will not be broadcast by Frontend Conf itself, but by the best reports from the whole festival .
Source: https://habr.com/ru/post/328526/
All Articles