How on Instagram disconnected the Python garbage collector and started living
By disabling the Python garbage collector (GC), which frees up memory by tracking and deleting unused data, Instagram started to work 10% faster. Yes, you heard it right! By disabling the garbage collector, you can reduce the amount of memory consumed and increase the efficiency of the processor cache. Want to know why this is happening? Then fasten your seat belts!
The Instagram web server runs on Django in multiprocess mode, where the master process copies itself, creating dozens of workflows that accept requests from users. As an application server, we use uWSGI in prefork mode to regulate the allocation of memory between the master process and workflows.
To prevent Django from running out of memory, the uWSGI master process provides the ability to restart the workflow when its resident memory (RSS) exceeds a predetermined limit.
First, we decided to find out why RSS workflows start to grow so quickly immediately after they are generated by the wizard. We noticed that although RSS starts at 250 MB, the size of the shared memory used is reduced from 250 MB to almost 140 MB in a few seconds (the size of the shared memory can be viewed in
')
In the Linux kernel, there is a copy -on-write mechanism ( Copy-on-Write , CoW), which serves to optimize the work of child processes. The child process at the beginning of its existence shares each page of memory with its parent. The page is copied to its own process memory only during recording.
But in the world of Python, interesting things happen because of the reference counting. Each time the Python object is read, the interpreter will increase its reference count, which is essentially a write operation to its internal data structure. This causes CoW. It turns out that with Python we actually use Copy-on-Read (CoR)!
The question arises: do we perform copying while writing for immutable objects, such as code objects? Since
We start with Instagram simple. As an experiment, we added a small hack to the CPython interpreter, made sure that the reference count does not change for code objects, and then installed this CPython on one of the working servers.
The result disappointed us: nothing has changed in the use of shared memory. When we tried to figure out why this was happening, we realized that we could not find any reliable metrics to prove that our hack worked, and also we could not prove the connection between shared memory and a copy of the code object. Obviously, we have missed something. Conclusion: before you follow your theory, prove it.
A little googling on the topic of Copy-on-Write, we found out that Copy-on-Write is related to errors in the absence of pages in memory (page faults, or page breaks). Each CoW operation causes a page break in the process. The performance monitoring tools built into Linux allow you to record system events, including page breaks, and, when possible, even output a stack trace!
We again went to the production server, rebooted it, waited until the master process spawned child processes, learned the PID of the workflow, and then executed the following command:
With the help of stack-traces, we got an idea of when page breaks occur in the process.
The results were different from what we expected. The main suspect was not the copying of code objects, but the
The garbage collector in CPython is called deterministically based on a threshold value. The default threshold is very low, so the garbage collector runs at very early stages. It maintains linked lists containing information about the creation of objects, and linked lists are mixed during garbage collection. Since the structure of the linked list exists along with the object itself (just like
Well, since the garbage collector treacherously betrayed us, let's turn it off!
We added the
The msgpack patch was unacceptable for us, as it opened the way for other libraries to do the same without making us aware. First, you need to prove that disabling the garbage collector really helps. The answer again lies in
Thus, we have successfully increased the amount of shared memory for each workflow from 140 MB to 225 MB, and the total amount of memory used on the host has dropped to 8 GB on each machine. This saved 25% of RAM on all Django servers. With such a reserve of free space, we can both run a lot more processes and raise the threshold for resident memory. As a result, this increases the throughput of the Django layer by more than 10%.
After experimenting with a variety of settings, we decided to test our theory in a wider context: on a cluster. The results were not long in coming, and our continuous deployment process collapsed, because with the garbage collector turned off, the web server began to reboot much slower. It usually took less than 10 seconds to restart, but when the garbage collector was turned off, it sometimes took up to 60 seconds.
This bug was difficult to reproduce, since the behavior was not deterministic. After a lot of experiments, we managed to determine the exact reproduction steps. When this happened, the free memory on this host dropped to almost zero and jumped back, filling the entire cache. Then there came a time when all the code or data had to be read from disk (DSK 100%), and everything worked slowly.
This could signal that Python performs the final garbage collection while the interpreter is stopped, which can cause a huge jump in the amount of memory used in a very short period of time. And again, I decided to first prove it, and then decide how to fix it. So, I commented out the
Obviously, we could not just turn off
Finally, we needed to apply our solution on a larger scale. We tried to use it on all servers, but this again broke the process of continuous deployment. However, this time only the machines with old processor models (Sandy Bridge) suffered, and it was even harder to reproduce. Conclusion: Always test old customers / equipment, as they are the easiest to break.
Since our continuous deployment process is fast enough to understand what is happening, I added a separate
And again, performing performance profiling, we meet
And why do something to clean? The process will die and we will get a replacement for it. What we should worry about is the atexit function handlers, which clean up behind our applications. But do not worry about cleaning up Python. Here is how we eventually changed our boot script:
The decision is based on the fact that the atexit functions are started from the register in the reverse order. The atexit function completes the rest of the cleanup, and then calls
Having changed only two lines, we finally rolled out the solution to all our servers. By carefully setting the memory thresholds, we got a total performance increase of 10%!
When thinking about improving performance, we had a couple of questions:
First, shouldn't Python memory overflow without garbage collection, since it is no longer cleared? (Recall that there is no real stack in Python memory, since all objects are stored on the heap.)
Fortunately, it is not. The main mechanism for releasing objects in Python is reference counting. When an object reference is deleted (when
The second question: where does the performance gain come from?
Turning off the garbage collector gives a double win:
With the garbage collector disabled, the number of cache cache miss rates drops by 2–3%, which is the main reason for the 10% improvement in IPC. Cash misses are expensive because they slow down the processor’s compute pipeline. A small increase in the CPU cache hit rate can significantly improve IPC. The fewer copy-on-write (CoW) operations are performed, the more cache lines with different virtual addresses (in different workflows) point to the same address in physical memory, which leads to an increase in cache hit rate.
As you can see, not every component works as we think, and the results can sometimes be unexpected. Therefore, continue research and be surprised at how everything is arranged in reality!
How we run our web server
The Instagram web server runs on Django in multiprocess mode, where the master process copies itself, creating dozens of workflows that accept requests from users. As an application server, we use uWSGI in prefork mode to regulate the allocation of memory between the master process and workflows.
To prevent Django from running out of memory, the uWSGI master process provides the ability to restart the workflow when its resident memory (RSS) exceeds a predetermined limit.
How memory works
First, we decided to find out why RSS workflows start to grow so quickly immediately after they are generated by the wizard. We noticed that although RSS starts at 250 MB, the size of the shared memory used is reduced from 250 MB to almost 140 MB in a few seconds (the size of the shared memory can be viewed in
/proc/PID/smaps ). The numbers here are not very interesting, as they are constantly changing, but how quickly the allocated memory is released (almost 1/3 of the total memory) is of interest. Then we decided to find out why this shared memory becomes the private memory of each process at the beginning of its life.')
Our guess: Copy-on-Read
In the Linux kernel, there is a copy -on-write mechanism ( Copy-on-Write , CoW), which serves to optimize the work of child processes. The child process at the beginning of its existence shares each page of memory with its parent. The page is copied to its own process memory only during recording.
But in the world of Python, interesting things happen because of the reference counting. Each time the Python object is read, the interpreter will increase its reference count, which is essentially a write operation to its internal data structure. This causes CoW. It turns out that with Python we actually use Copy-on-Read (CoR)!
#define PyObject_HEAD \ _PyObject_HEAD_EXTRA \ Py_ssize_t ob_refcnt; \ struct _typeobject *ob_type; ... typedef struct _object { PyObject_HEAD } PyObject; The question arises: do we perform copying while writing for immutable objects, such as code objects? Since
PyCodeObject is actually a “subclass” of PyObject , obviously, yes. Our first idea was to turn off reference counting for PyCodeObject.Attempt number 1: disable reference counting for code objects
We start with Instagram simple. As an experiment, we added a small hack to the CPython interpreter, made sure that the reference count does not change for code objects, and then installed this CPython on one of the working servers.
The result disappointed us: nothing has changed in the use of shared memory. When we tried to figure out why this was happening, we realized that we could not find any reliable metrics to prove that our hack worked, and also we could not prove the connection between shared memory and a copy of the code object. Obviously, we have missed something. Conclusion: before you follow your theory, prove it.
Paging Analysis
A little googling on the topic of Copy-on-Write, we found out that Copy-on-Write is related to errors in the absence of pages in memory (page faults, or page breaks). Each CoW operation causes a page break in the process. The performance monitoring tools built into Linux allow you to record system events, including page breaks, and, when possible, even output a stack trace!
We again went to the production server, rebooted it, waited until the master process spawned child processes, learned the PID of the workflow, and then executed the following command:
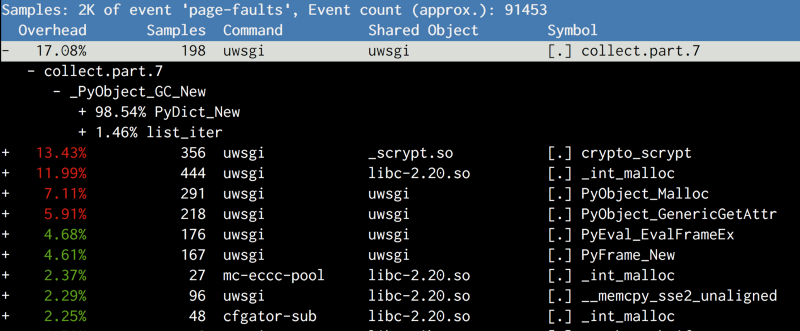
perf record -e page-faults -g -p <PID> With the help of stack-traces, we got an idea of when page breaks occur in the process.
The results were different from what we expected. The main suspect was not the copying of code objects, but the
collect method of gcmodule.c , which was called when the garbage collector was started. After reading how GC works in CPython, we developed the following theory:The garbage collector in CPython is called deterministically based on a threshold value. The default threshold is very low, so the garbage collector runs at very early stages. It maintains linked lists containing information about the creation of objects, and linked lists are mixed during garbage collection. Since the structure of the linked list exists along with the object itself (just like
ob_refcount ), mixing these objects in linked lists will cause the CoW of the relevant pages, which is an annoying side effect. /* GC information is stored BEFORE the object structure. */ typedef union _gc_head { struct { union _gc_head *gc_next; union _gc_head *gc_prev; Py_ssize_t gc_refs; } gc; long double dummy; /* force worst-case alignment */ } PyGC_Head; Attempt number 2: Let's try to disable the garbage collector
Well, since the garbage collector treacherously betrayed us, let's turn it off!
We added the
gc.disable() call to our boot script. Reboot the server and fail again! If you look at perf again, we see that gc.collect is still being called, and copying to memory is still in progress. After a little debugging in GDB, we found that one of the external libraries we used (msgpack) calls gc.enable() to revive the garbage collector, so gc.disable() was useless in the boot script.The msgpack patch was unacceptable for us, as it opened the way for other libraries to do the same without making us aware. First, you need to prove that disabling the garbage collector really helps. The answer again lies in
gcmodule.c . As an alternative to gc.disable we gc.set_threshold(0) , and this time no library returned this value to its place.Thus, we have successfully increased the amount of shared memory for each workflow from 140 MB to 225 MB, and the total amount of memory used on the host has dropped to 8 GB on each machine. This saved 25% of RAM on all Django servers. With such a reserve of free space, we can both run a lot more processes and raise the threshold for resident memory. As a result, this increases the throughput of the Django layer by more than 10%.
Attempt number 3: Disable garbage collector completely
After experimenting with a variety of settings, we decided to test our theory in a wider context: on a cluster. The results were not long in coming, and our continuous deployment process collapsed, because with the garbage collector turned off, the web server began to reboot much slower. It usually took less than 10 seconds to restart, but when the garbage collector was turned off, it sometimes took up to 60 seconds.
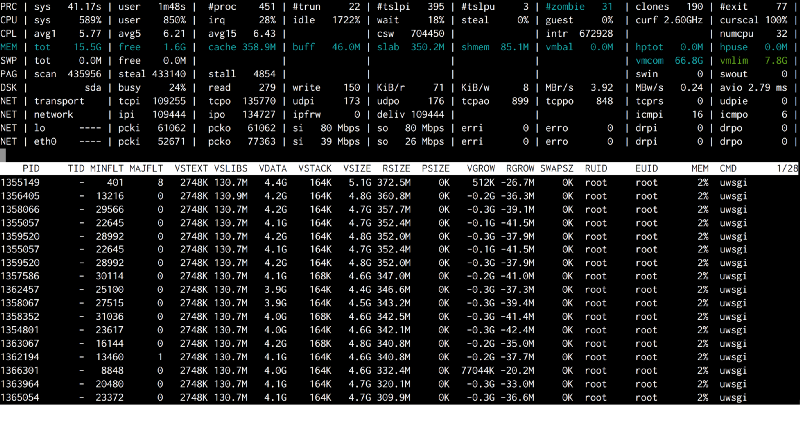
2016-05-02_21:46:05.57499 WSGI app 0 (mountpoint='') ready in 115 seconds on interpreter 0x92f480 pid: 4024654 (default app) This bug was difficult to reproduce, since the behavior was not deterministic. After a lot of experiments, we managed to determine the exact reproduction steps. When this happened, the free memory on this host dropped to almost zero and jumped back, filling the entire cache. Then there came a time when all the code or data had to be read from disk (DSK 100%), and everything worked slowly.
This could signal that Python performs the final garbage collection while the interpreter is stopped, which can cause a huge jump in the amount of memory used in a very short period of time. And again, I decided to first prove it, and then decide how to fix it. So, I commented out the
Py_Finalize call in the uWSGI plugin for Python, and the problem disappeared.Obviously, we could not just turn off
Py_Finalize . Many important cleaning procedures depended on this method. In the end, we added a dynamic flag to CPython that completely turned off garbage collection.Finally, we needed to apply our solution on a larger scale. We tried to use it on all servers, but this again broke the process of continuous deployment. However, this time only the machines with old processor models (Sandy Bridge) suffered, and it was even harder to reproduce. Conclusion: Always test old customers / equipment, as they are the easiest to break.
Since our continuous deployment process is fast enough to understand what is happening, I added a separate
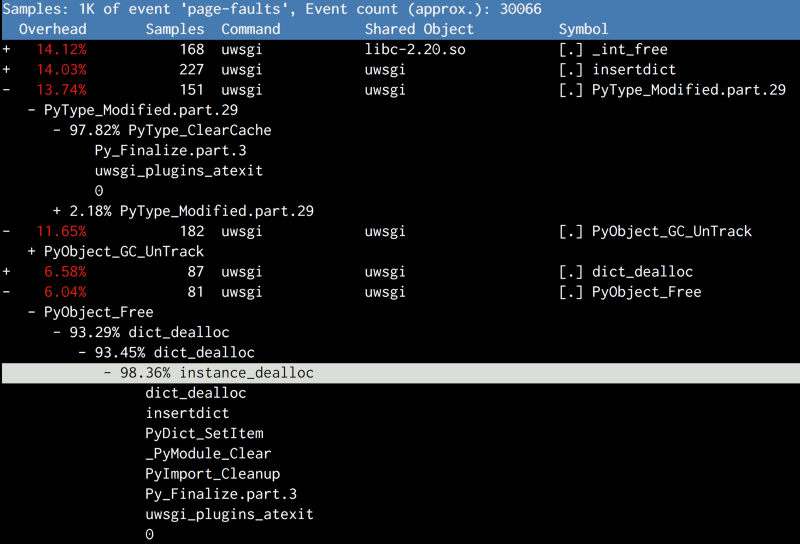
atop utility to our installation script. Now we could catch the moment when the cache was almost completely filled, and all uWSGI processes were throwing out a lot of MINFLT (minor errors in the absence of pages in memory).And again, performing performance profiling, we meet
Py_Finalize . When shutting down, except garbage collection, Python performs several operations related to cleaning: such as destroying type objects or unloading modules. And this again harmed the shared memory.Attempt number 4: The final step to shutting down the garbage collector: no cleaning
And why do something to clean? The process will die and we will get a replacement for it. What we should worry about is the atexit function handlers, which clean up behind our applications. But do not worry about cleaning up Python. Here is how we eventually changed our boot script:
# gc.disable() doesn't work, because some random 3rd-party library will # enable it back implicitly. gc.set_threshold(0) # Suicide immediately after other atexit functions finishes. # CPython will do a bunch of cleanups in Py_Finalize which # will again cause Copy-on-Write, including a final GC atexit.register(os._exit, 0) The decision is based on the fact that the atexit functions are started from the register in the reverse order. The atexit function completes the rest of the cleanup, and then calls
os._exit(0) to complete the current process.Having changed only two lines, we finally rolled out the solution to all our servers. By carefully setting the memory thresholds, we got a total performance increase of 10%!
Look back
When thinking about improving performance, we had a couple of questions:
First, shouldn't Python memory overflow without garbage collection, since it is no longer cleared? (Recall that there is no real stack in Python memory, since all objects are stored on the heap.)
Fortunately, it is not. The main mechanism for releasing objects in Python is reference counting. When an object reference is deleted (when
Py_DECREF called), Python always checks to see if the reference count for this object is zero. In this case, the object allocator will be called. The main task of garbage collection is to destroy cyclic dependencies when the reference counting mechanism does not work. #define Py_DECREF(op) \ do { \ if (_Py_DEC_REFTOTAL _Py_REF_DEBUG_COMMA \ --((PyObject*)(op))->ob_refcnt != 0) \ _Py_CHECK_REFCNT(op) \ else \ _Py_Dealloc((PyObject *)(op)); \ } while (0) Let us see where the gain is
The second question: where does the performance gain come from?
Turning off the garbage collector gives a double win:
- We freed up almost 8 GB of RAM on each server and were able to use them to create more working processes on servers with limited memory bandwidth, or to reduce the number of process restarts on servers with limited CPU power;
- The CPU throughput has also increased, as the number of instructions executed per cycle (IPC) increases by almost 10%.
# perf stat -a -e cache-misses,cache-references -- sleep 10 Performance counter stats for 'system wide': 268,195,790 cache-misses # 12.240 % of all cache refs [100.00%] 2,191,115,722 cache-references 10.019172636 seconds time elapsed With the garbage collector disabled, the number of cache cache miss rates drops by 2–3%, which is the main reason for the 10% improvement in IPC. Cash misses are expensive because they slow down the processor’s compute pipeline. A small increase in the CPU cache hit rate can significantly improve IPC. The fewer copy-on-write (CoW) operations are performed, the more cache lines with different virtual addresses (in different workflows) point to the same address in physical memory, which leads to an increase in cache hit rate.
As you can see, not every component works as we think, and the results can sometimes be unexpected. Therefore, continue research and be surprised at how everything is arranged in reality!
Oh, and come to work with us? :)wunderfund.io is a young foundation that deals with high-frequency algorithmic trading . High-frequency trading is a continuous competition of the best programmers and mathematicians of the whole world. By joining us, you will become part of this fascinating fight.
We offer interesting and challenging data analysis and low latency tasks for enthusiastic researchers and programmers. Flexible schedule and no bureaucracy, decisions are quickly made and implemented.
Join our team: wunderfund.io
Source: https://habr.com/ru/post/328404/
All Articles