12 tools for debugging .NET-applications for performance and memory
In a recent interview with John Skit, we concluded that professional work with any technology implies the ability to diagnose problems and understand how your applications work under the hood. In pursuit of that conversation, I learned from Sasha goldshtn Goldstein, one of the world's best .NET performance experts, the author of Pro .NET Performance , about which tools .NET developers should pay attention to.
Some of them are relatively simple, others will take time and effort to master. Under the cat you will find a brief overview of 12 tools that will be useful for performance engineers, top-level support specialists and developers in general who are concerned about the performance of their applications.
In more detail about all the tools and how to solve problems with the performance of your applications in practice, Sasha will tell on May 21 at a training in St. Petersburg .
')
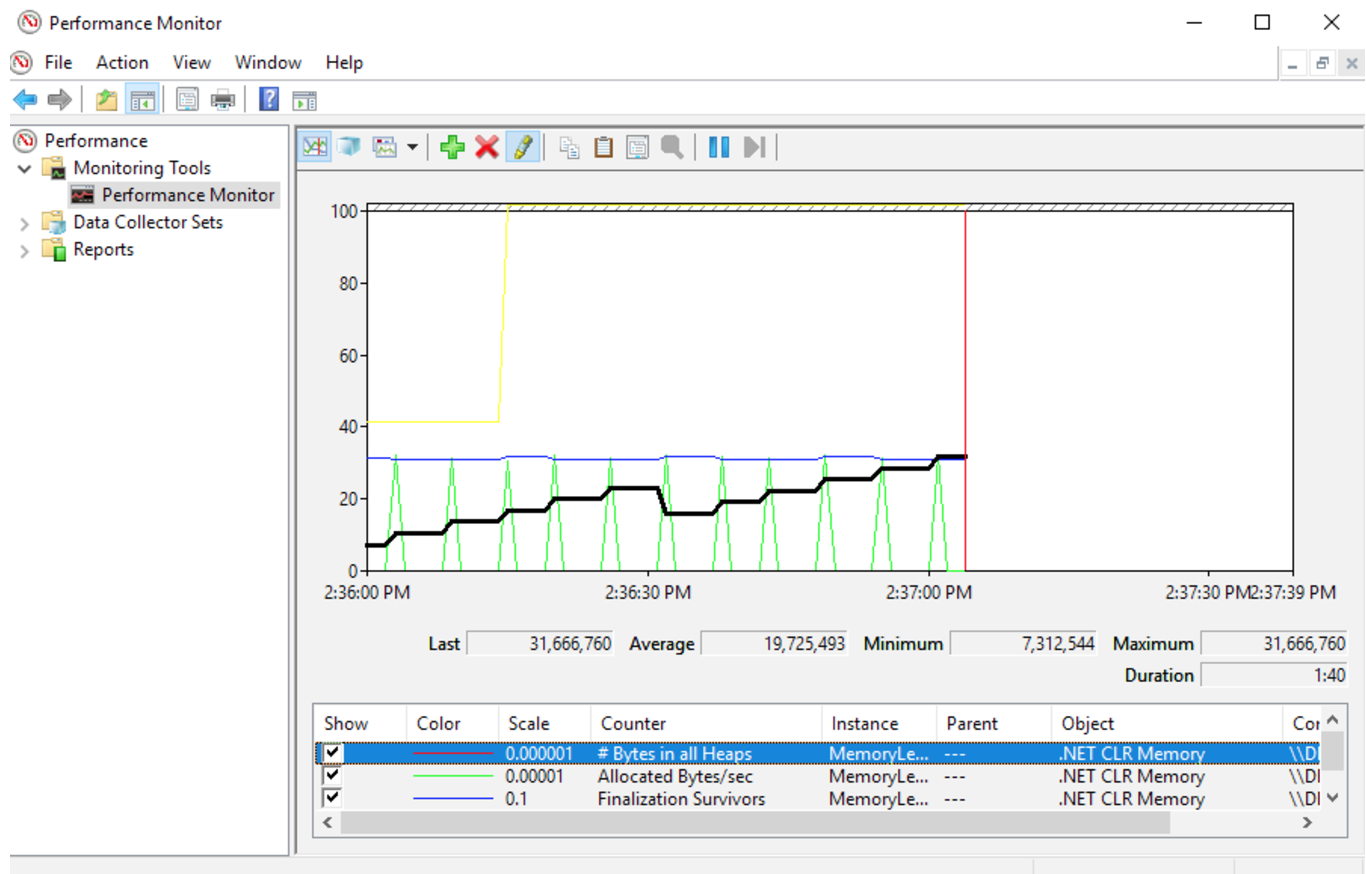
Windows performance counters are the first step to getting a high-level overview of what your system is doing. Monitoring the use of CPU and memory, disk and I / O, network packets and HTTP requests allows you to get an overview of the system from a bird's eye view with a low overhead and understand where to dig further. Perfmon (Performance Monitor) is a built-in Windows tool that not only provides access to the real-time performance counter panel, but also allows you to record counter data to view it later on another computer, and even set up automatic notifications in case something happens. then go wrong. For lovers of the command line, there is Typeperf , a tool that writes meter data to a CSV file, which can be easily parsed and automatically analyzed later. These two tools allow you to quickly understand what you should pay attention to in the first place, as well as whether your system is working normally. However, they are certainly not suitable for in-depth research, since the counters simply show you the numbers that reflect certain aspects of the operating system.
Over the past 10 years, ETW (Event Tracing for Windows) has become a very common tool and in fact has become the de facto standard among Windows performance analysis tools. By recording and analyzing ETW data, you can profile CPUs at the OS level, examine locks, find out which parts of your application create a high load on the disk or the network, and even track garbage collection, memory allocation and NET download events. XPerf is an older console tool for recording ETW events that has several analytical modules for measuring I / O performance, compiling reports on CPU performance and calculating the “cost” of running applications. In addition, he is able to convert ETW records to CSV format, which can be easily parsed with other tools and scripts. WPR (Windows Performance Recorder) is a graphical shell that allows you to select the events that you would like to record.
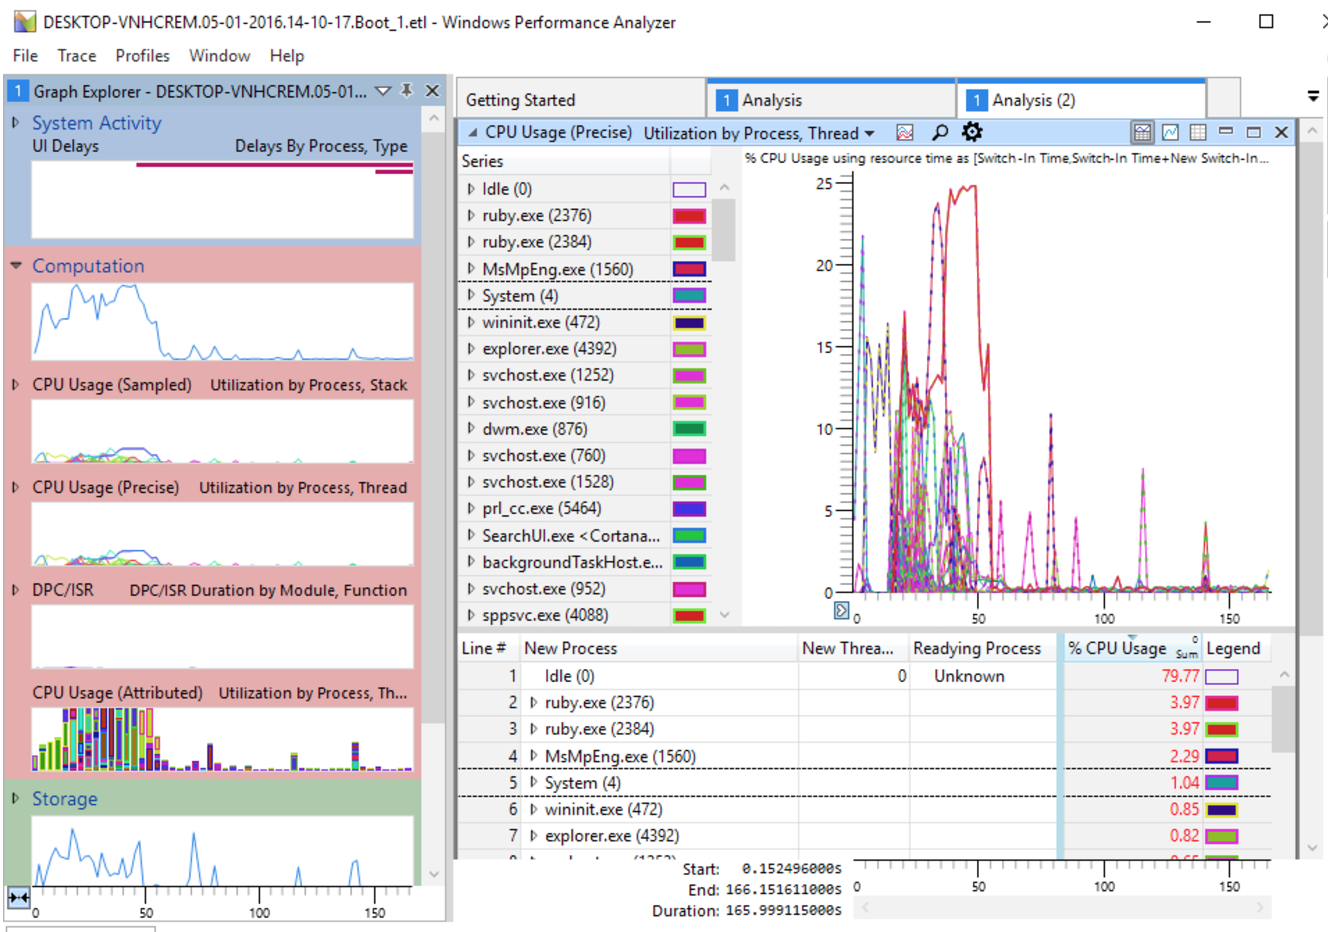
There is also WPA (Windows Performance Analyzer) , a modern tool for viewing ETW records, which is able to build graphs, pivot tables with different filters and groupings, as well as individual views for specific events: CPU stacks, memory allocations, I / O requests and loading steps. More recently, support has appeared for flame graphs, a new method for displaying large stack trees, making it easy to analyze them.
In general, the tools under ETW are excellent for production analysis, although they can also be used in development. The main disadvantage of these solutions is the relative inconvenience of their use compared to commercial profilers.
Windows Performance Toolkit documentation on MSDN
The main problem with the Windows Performance Toolkit is that they are not sharpened for monitoring on managed processes and CLR-specific events, such as garbage collection, managed exceptions, assembly loading, or JIT compilation. PerfView is Microsoft's open source tool that can record, collect, and display CLR events, including events that you initiate yourself using the EventSource API, available since .NET 3.5. PerfView has several unique features: for example, displaying heap dumps of managed processes in a very convenient way (in which it is very easy to detect memory leaks); folding and grouping call stacks, allowing you to quickly deal with thousands of data points, and collecting data on .NET events like GC and allocations. Unfortunately, the PerfView interface was made by a performance engineer, so it is not very intuitive and requires a certain addiction period, after which you can work with the tool for 100.
About Sasha PerfView told on the past DotNext in St. Petersburg .
PerfView tutorial video series on Channel 9
At DotNext 2017 Piter, Sasha will introduce several of his own open source development, which he himself uses for “full-time” performance research and which do not require the generation of large amounts of data and their subsequent analysis. The first one is etrace , which generates a live log of interesting ETW events and provides many opportunities for filtering them. Example: you can ask etrace to display a message when a particular file is used, when full (generation 2) garbage collection occurs, when a particular .NET assembly is loaded, or when an ASP.NET application throws a managed exception. Working from the command line allows you to use etrace in scripts and quickly get results without digging into the GUI.
The second tool is LiveStacks , a profiler-like tool designed to capture and merge event stacks in real time. More specifically, LiveStacks collects managed call stacks (method names) by examining the memory of the target process, as opposed to the traditional ETW approach, which requires the completion of the profiling session for generating and parsing the CLR rundown events. As a result of this approach, a fast, lightweight and efficient tool that can keep a stack in a compact form suitable for forming a flame graph. If you need fast results in production and you do not hesitate to work on the console, I hope these tools will be useful to you.

The tools described above are primarily aimed at optimizing performance, although with the help of the same ETW I caught a lot of bugs and memory leaks. However, in some cases, you may need a complete memory dump of a broken process that could be learned from the production system or later in your development environment. There are several tools in Windows to create dumps; we’ll talk about two of them here: Procdump , a very flexible free console application from Sysinternals that generates dumps on various triggers (% of CPU usage, amount of used memory, unresponsive windows, etc.); and DebugDiag , a monitoring tool that can be very finely tuned for background tracking of your processes in anticipation of problems. There are a lot of mistakes, which can only be found by studying a dump, or even a few dumps made with a certain frequency, so creating the infrastructure for obtaining such dumps can be the number one task.
Procdump documentation on TechNet
DebugDiag documentation on MSDN
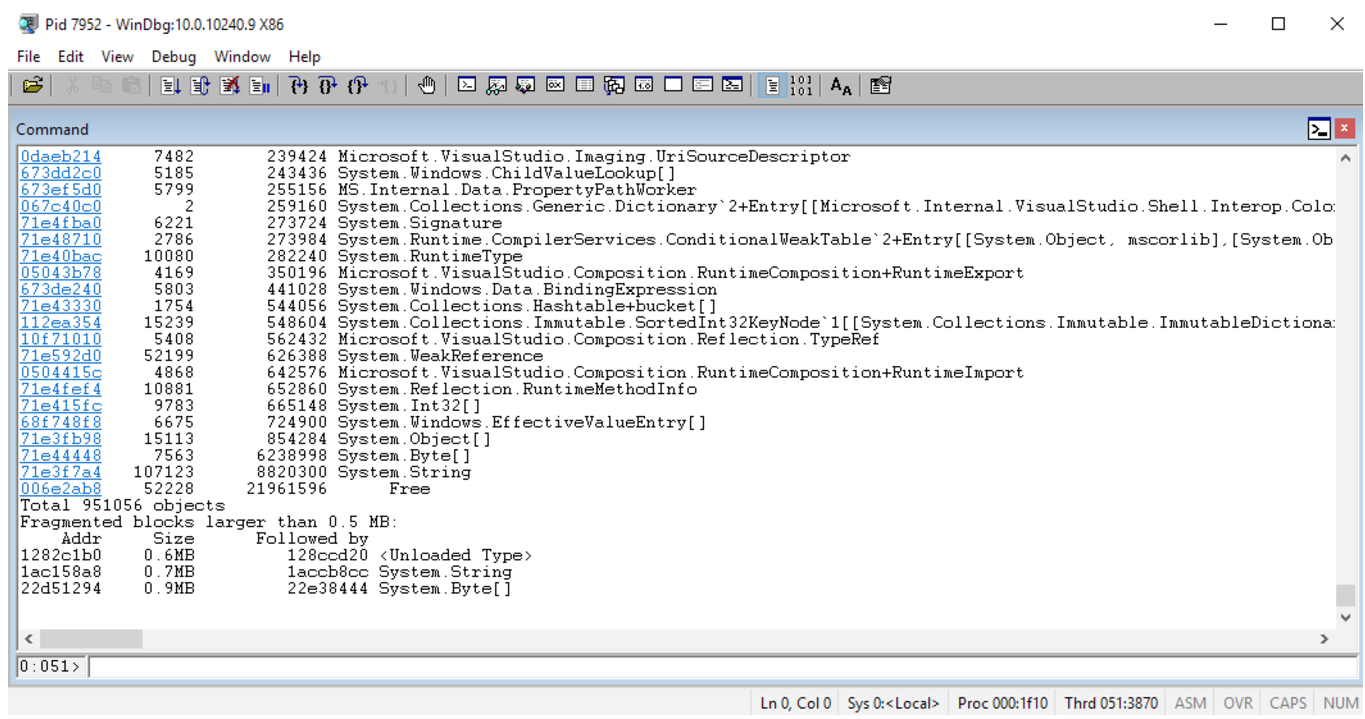
In general, you can use Visual Studio to analyze the dumps and get the most out of them, but it’s better to pay attention to WinDbg and its various extensions. WinDbg, Windows Debugger , is a powerful and very unfriendly tool for debugging working processes and analyzing dumps. Armed with extensions (such as SOS, SOSEX, NetExt, and MEX), you will get tremendous opportunities: researching a managed heap, searching for unused and unrecoverable objects, finding the restricted threads with one command, detecting ASP.NET requests in real time and doing many other studies. It is important to note that WinDbg can be managed both by external scripts (running it from the command line with certain parameters) and internal (written in scripting languages or C / C ++ / C # DLL). All this gives much more flexible possibilities for debugging in comparison with VS or other IDEs, and its lightness allows you to put it on production and use it for real-time monitoring. Believe me, you will appreciate this opportunity not to copy a 50 gigabyte dump to yourself, when it turns out that your server is located 5000 kilometers away from you, and the width of the channel does not exceed 1 megabit per second.
By the way, in the past DotNext , Sasha already told a lot of interesting things about WinDbg.
WinDbg reference on MSDN
This list would be incomplete if it were not for another application (which Sasha wrote himself), designed to solve one very unpleasant problem with dump analysis: I had files with Windows Phone, and for WinPhone CLR there is no public SOS extension, which is so necessary for any kind of managed analysis of dumps in WinDbg. Because I wrote my open-source debugger based on the Windows Debugging API (DbgEng) and the Microsoft CLRMD library. Msos is an open-source framework that provides a managed shell for SOS interfaces. Over time, msos acquired unique features that separated it from WinDbg and SOS:
msos GitHub repository
Hope it was helpful. And if you want more details,there are still a few tickets left for the training .
And if you don’t want to devote a whole day to debugging and performance, then you can meet with Sasha and 30 other .NET gurus from around the world at DotNext 2017 Piter .
UPD. We are doing the training with Sasha again, this time in Moscow: registration and participation conditions are on the site .
Some of them are relatively simple, others will take time and effort to master. Under the cat you will find a brief overview of 12 tools that will be useful for performance engineers, top-level support specialists and developers in general who are concerned about the performance of their applications.
In more detail about all the tools and how to solve problems with the performance of your applications in practice, Sasha will tell on May 21 at a training in St. Petersburg .
')
Typeperf and perfmon
Windows performance counters are the first step to getting a high-level overview of what your system is doing. Monitoring the use of CPU and memory, disk and I / O, network packets and HTTP requests allows you to get an overview of the system from a bird's eye view with a low overhead and understand where to dig further. Perfmon (Performance Monitor) is a built-in Windows tool that not only provides access to the real-time performance counter panel, but also allows you to record counter data to view it later on another computer, and even set up automatic notifications in case something happens. then go wrong. For lovers of the command line, there is Typeperf , a tool that writes meter data to a CSV file, which can be easily parsed and automatically analyzed later. These two tools allow you to quickly understand what you should pay attention to in the first place, as well as whether your system is working normally. However, they are certainly not suitable for in-depth research, since the counters simply show you the numbers that reflect certain aspects of the operating system.
XPerf, WPR, and WPA (Windows Performance Toolkit)
Over the past 10 years, ETW (Event Tracing for Windows) has become a very common tool and in fact has become the de facto standard among Windows performance analysis tools. By recording and analyzing ETW data, you can profile CPUs at the OS level, examine locks, find out which parts of your application create a high load on the disk or the network, and even track garbage collection, memory allocation and NET download events. XPerf is an older console tool for recording ETW events that has several analytical modules for measuring I / O performance, compiling reports on CPU performance and calculating the “cost” of running applications. In addition, he is able to convert ETW records to CSV format, which can be easily parsed with other tools and scripts. WPR (Windows Performance Recorder) is a graphical shell that allows you to select the events that you would like to record.
There is also WPA (Windows Performance Analyzer) , a modern tool for viewing ETW records, which is able to build graphs, pivot tables with different filters and groupings, as well as individual views for specific events: CPU stacks, memory allocations, I / O requests and loading steps. More recently, support has appeared for flame graphs, a new method for displaying large stack trees, making it easy to analyze them.
In general, the tools under ETW are excellent for production analysis, although they can also be used in development. The main disadvantage of these solutions is the relative inconvenience of their use compared to commercial profilers.
Windows Performance Toolkit documentation on MSDN
Perfview
The main problem with the Windows Performance Toolkit is that they are not sharpened for monitoring on managed processes and CLR-specific events, such as garbage collection, managed exceptions, assembly loading, or JIT compilation. PerfView is Microsoft's open source tool that can record, collect, and display CLR events, including events that you initiate yourself using the EventSource API, available since .NET 3.5. PerfView has several unique features: for example, displaying heap dumps of managed processes in a very convenient way (in which it is very easy to detect memory leaks); folding and grouping call stacks, allowing you to quickly deal with thousands of data points, and collecting data on .NET events like GC and allocations. Unfortunately, the PerfView interface was made by a performance engineer, so it is not very intuitive and requires a certain addiction period, after which you can work with the tool for 100.
About Sasha PerfView told on the past DotNext in St. Petersburg .
PerfView tutorial video series on Channel 9
Etrace and LiveStacks
At DotNext 2017 Piter, Sasha will introduce several of his own open source development, which he himself uses for “full-time” performance research and which do not require the generation of large amounts of data and their subsequent analysis. The first one is etrace , which generates a live log of interesting ETW events and provides many opportunities for filtering them. Example: you can ask etrace to display a message when a particular file is used, when full (generation 2) garbage collection occurs, when a particular .NET assembly is loaded, or when an ASP.NET application throws a managed exception. Working from the command line allows you to use etrace in scripts and quickly get results without digging into the GUI.
The second tool is LiveStacks , a profiler-like tool designed to capture and merge event stacks in real time. More specifically, LiveStacks collects managed call stacks (method names) by examining the memory of the target process, as opposed to the traditional ETW approach, which requires the completion of the profiling session for generating and parsing the CLR rundown events. As a result of this approach, a fast, lightweight and efficient tool that can keep a stack in a compact form suitable for forming a flame graph. If you need fast results in production and you do not hesitate to work on the console, I hope these tools will be useful to you.
Procdump and DebugDiag
The tools described above are primarily aimed at optimizing performance, although with the help of the same ETW I caught a lot of bugs and memory leaks. However, in some cases, you may need a complete memory dump of a broken process that could be learned from the production system or later in your development environment. There are several tools in Windows to create dumps; we’ll talk about two of them here: Procdump , a very flexible free console application from Sysinternals that generates dumps on various triggers (% of CPU usage, amount of used memory, unresponsive windows, etc.); and DebugDiag , a monitoring tool that can be very finely tuned for background tracking of your processes in anticipation of problems. There are a lot of mistakes, which can only be found by studying a dump, or even a few dumps made with a certain frequency, so creating the infrastructure for obtaining such dumps can be the number one task.
Procdump documentation on TechNet
DebugDiag documentation on MSDN
WinDbg
In general, you can use Visual Studio to analyze the dumps and get the most out of them, but it’s better to pay attention to WinDbg and its various extensions. WinDbg, Windows Debugger , is a powerful and very unfriendly tool for debugging working processes and analyzing dumps. Armed with extensions (such as SOS, SOSEX, NetExt, and MEX), you will get tremendous opportunities: researching a managed heap, searching for unused and unrecoverable objects, finding the restricted threads with one command, detecting ASP.NET requests in real time and doing many other studies. It is important to note that WinDbg can be managed both by external scripts (running it from the command line with certain parameters) and internal (written in scripting languages or C / C ++ / C # DLL). All this gives much more flexible possibilities for debugging in comparison with VS or other IDEs, and its lightness allows you to put it on production and use it for real-time monitoring. Believe me, you will appreciate this opportunity not to copy a 50 gigabyte dump to yourself, when it turns out that your server is located 5000 kilometers away from you, and the width of the channel does not exceed 1 megabit per second.
By the way, in the past DotNext , Sasha already told a lot of interesting things about WinDbg.
WinDbg reference on MSDN
Msos
This list would be incomplete if it were not for another application (which Sasha wrote himself), designed to solve one very unpleasant problem with dump analysis: I had files with Windows Phone, and for WinPhone CLR there is no public SOS extension, which is so necessary for any kind of managed analysis of dumps in WinDbg. Because I wrote my open-source debugger based on the Windows Debugging API (DbgEng) and the Microsoft CLRMD library. Msos is an open-source framework that provides a managed shell for SOS interfaces. Over time, msos acquired unique features that separated it from WinDbg and SOS:
- Requests to fetch objects from the heap, for example, “Find all HTTP requests that wait more than 2 seconds” or “find all objects of type CustomerData where AmountDue is negative”;
- Deadlock detection in managed and native synchronization mechanisms;
- Hip indexing support for fast graph traversal;
- Custom memory dump generator, ignoring memory regions that are not needed for analyzing managed dumps (thus saving up to 80% of disk space);
- Automatic sorting mode, generating a concise JSON report with a minimum of data required for more in-depth research. I understand that most of you will continue to use VS for everyday debugging, and this is normal. However, my tool will allow you to cope with the most unpleasant situations.
msos GitHub repository
Hope it was helpful. And if you want more details,
UPD. We are doing the training with Sasha again, this time in Moscow: registration and participation conditions are on the site .
Source: https://habr.com/ru/post/328294/
All Articles