As we did a short-term forecast of precipitation. Lecture in Yandex
At the beginning of winter, Yandex.Pogoda learned how to show whether precipitation will occur in the next two hours. After a couple of months, the topic of weather forecasting became central at one of the events of Data & Science. Among the speakers that day was Alexey Preobrazhensky - a developer from the Yandex.Pogoda team. Alexey talked about our algorithm for nauchasing and the convolutional neural network underlying this algorithm.
Under the cut - decoding lectures and slides.
My name is Alexey Preobrazhensky, I’m not a meteorologist, but a developer, and I’ll tell you about technical things, about data analysis.
')
How many people are involved in data analysis - are they competing at Kaggle, for example? Lot. And who is involved in the training of Yandex machine learning? The same, great. My report is organized roughly as a workout. Waiting for you a story about how we in the team of Yandex.Pogoda built nauchsting, what algorithms used, what data was used, how they measured and what we did.
Everyone who watched the film “Back to the Future 2” probably knows what naunting is. When doc Brown gets out of the car and says that the rain will end in 5 seconds, this is a naunting. But this is naughting in movies. Real-life science research — at least in the heads of managers — looks either as a notice to a person in the form of text or push notification, or as a precipitation map that moves with time. The task was precisely to develop a product that would combine both notifications and a precipitation map. The forecast of precipitation on the future map was required, floating clouds.
A year and a half ago, when we started, we had nothing but data. Unlike the participants at Kaggle, we had no fixed metrics, no baseline solutions. The only thing that happened was the constant technology race in which we wanted to overtake ourselves.
The first decision is simply Groundhog Day. Overtake the forecast, decide that tomorrow will be the same as yesterday. And the next model should improve the previous one.
What is needed to predict precipitation? Need data, radar images. It is necessary to understand how particles move in the atmosphere, what winds blow and how to apply this movement to particles. I'll tell you about all three components of the forecast.

The first - radar images. They come in very different formats and come from very different suppliers. These are just separate pictures in PNG, with the agreement that such and such intensity of the reflected signal is indicated by color with such a code. This is GeoTIFF - a picture in TIFF format with geo-information inside itself, where it is indicated which coordinates it refers to. Or - the scientific format NetCDF.
Radars differ greatly in update frequency. There are radars that are updated every 10 minutes, every 15 minutes. The worst thing is that the data from the radar - in contrast to the relatively clean data for the competition - contain artifacts. Radars operate on physical principles, on wave reflection, so that they have blind zones. And when small fragments of the visibility zone are radially closed by buildings, this is still far from the most difficult case.

Some radars are closed for about 50% of the range. There are also artifacts made by people. For example, during the beta testing period, we ran into a person who bought a Wi-Fi point, incorrectly tuned the frequency and channel number on it, and then put it out of the window. As a result, we hung over Ivanovo huge laser sword in the form of a cloud. We saw it on the map and could not do anything with it until we called Frequency Surveillance. Please, if you buy Wi-Fi-points somewhere in China, tune them to Russian frequencies.

In addition to radar data, it is necessary to take a vector field from somewhere else. In principle, it can be taken from just two places: either by analyzing previous radar images and applying, say, optical flow algorithms, or from some other sources. For example, you can use the weather modeling and the result of the work of the same RUF or Meteum. We take the field of winds and use it to transfer the pictures that the radar returns.
Both ways of getting vector fields have disadvantages. Optical flow can not be calculated in places where the cloud does not fly. There is nothing to reflect on the radar beam, and there is no data on air velocity and direction of motion.
Weather modeling may not coincide with reality. Therefore, if we used only the data of the weather models, it could happen that in the historical data of the radar the cloud flies in one direction, and then in the forecast of the winds it turns sharply and flies in the other direction.
The third component of nauchsting is an algorithm for applying a vector field. Here science can pretty much. We took as a basis the thin plate spline transform - the transformation of a picture that represents it in the form of a thin rubber plate and stretches some places. We parametrize this transformation with just a few reference vectors, and restore all other motion vectors inside the image by spline interpolation. This technology is used, for example, in the restoration of motion on the last frame of the video. Known scientific work.
Armed with the knowledge gained, we began to try to build a forecast. The first solution that came to mind was to simply train several neural networks so that the first neural network predicted the situation on the radar in 10 minutes, the second - in 20 minutes, the third - in 30. The requirement was as follows: predict radar data for about two hours forward.

Predictions turned out like this. At about the same time when we trained 12 neural networks, we had the opportunity to visualize the data on the map. Looking at the jumping clouds, the managers said: we will not release it for sure. One of them said: of course, I understand that this maximizes the likelihood of something there, but this cannot be explained to the user - in real life the clouds do not jump like that.
During the next iteration, we decided to count only the vector field and multiply the support vectors by 2 and 3 in order to get the transfer not by 10, but by 20 minutes and 30 minutes, respectively.

At near horizons, the results looked pretty decent, but the farther, the more often artifacts appeared on the edge. It turned out that in the vector field too large vectors break the thin plate spline, and we have the second mirror image of our image. Then the reflections merge. In the near horizons, the artifact was not noticeable, but it manifested itself very strongly on distant ones. A cloud appeared from nowhere.

The third solution was to consistently apply the same thin plate spline transformation to the same picture. On the one hand, it contributed to the accumulation of errors. This was the first really working solution, which we showed in the internal beta test. The neural network received six radar images at the input in the last hour, several convolutions brought them to the tensor of 16 4 x 4 vectors. The spline transform was reconstructed from the vectors and consistently applied to the picture to get each next forecast horizon.
The solution did quite well, but the only question left was: why do we need a neural network? If red convolutions are the only part that we teach, why don't we calculate the vector field on our own, algorithmically? So the fourth solution, which noticeably improved the result, used an explicit minimization of the loss function.
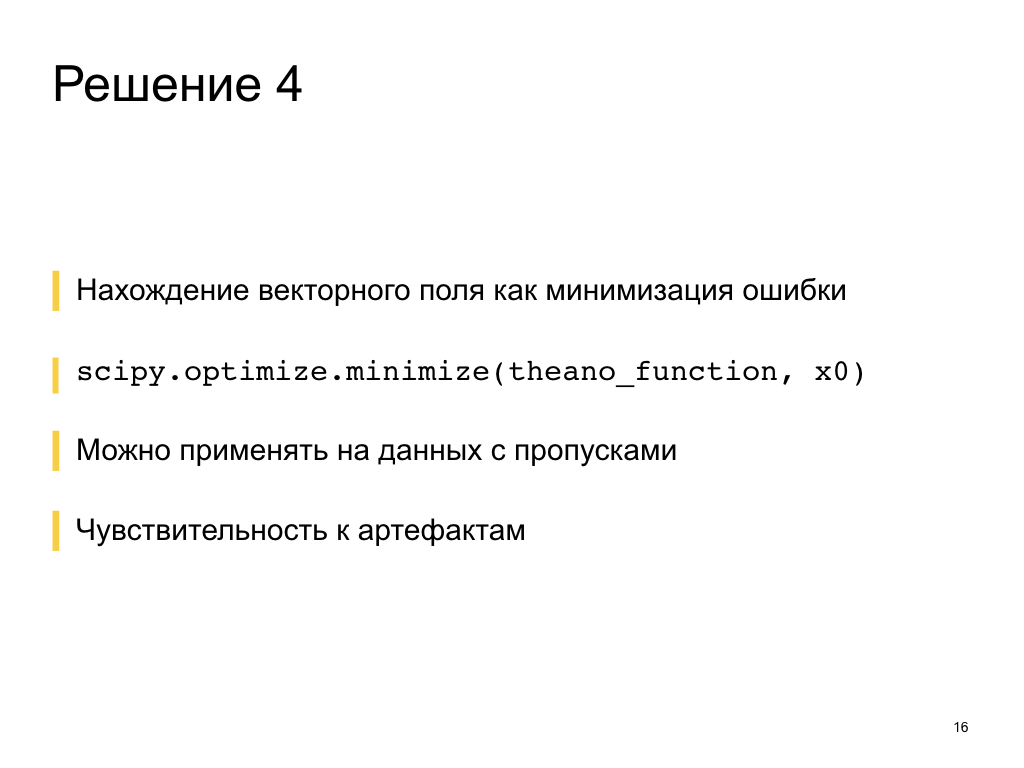
We were looking for a vector field that would equally well approximate the transition by 10 minutes in the last hour. From –60 minutes to –50, then to –40, and so on. We applied this vector field to t0 to get a forecast 10 minutes further.
Algorithmically it is much better to find a vector field using minimization. It works faster, does not require training. The most interesting - it does not require all the data. You can skip some data - and the radars are often delayed. We have long thought what to leave - neural networks or algorithmic calculations of a vector field. But all won the same laser sword in Ivanovo. When it hangs over you like a sword of Damocles and zooms out all the vectors around itself, the clouds can neither cross it nor move in the same area with it. Even some kind of physical movement in the picture does not occur.
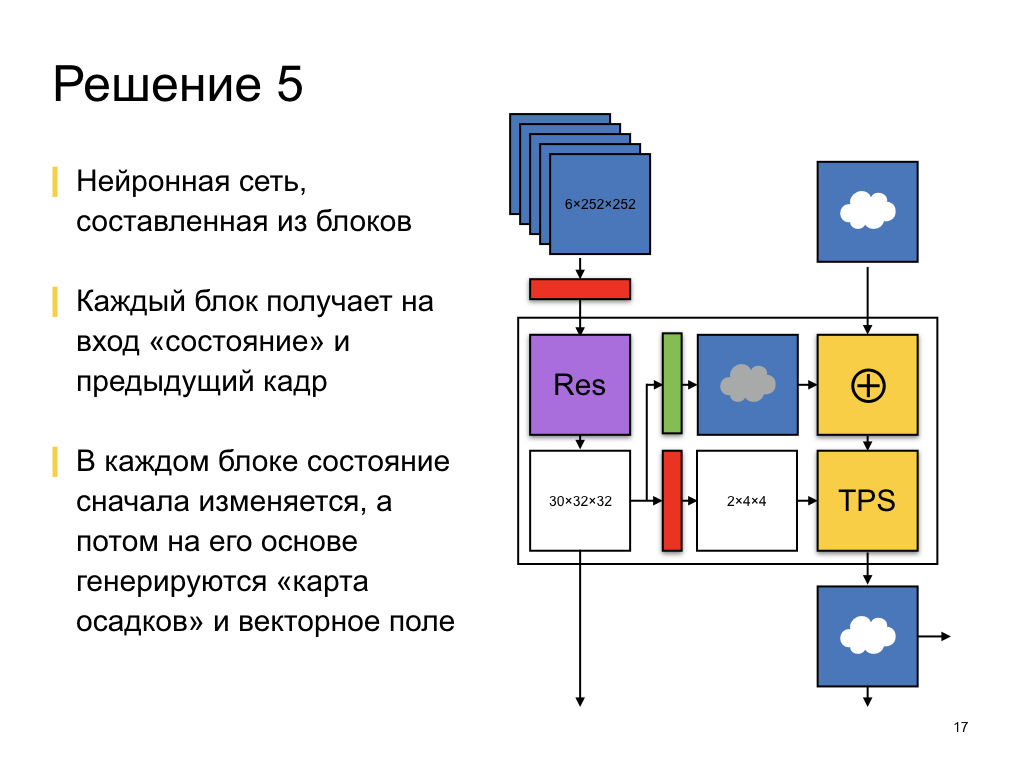
Therefore, in the end, we came to the neural network. Now the neural network works and gives predictions, its architecture is shown schematically here. It is composed of about 12 identical blocks. Each block consistently builds a forecast over its horizon, receiving as input a state tensor and the last radar snapshot, the last prediction from the previous horizon.
The state tensor has a rather small dimension, only 32 x 32 by 30 channels, but by convolution to involution we get from it a vector field, support vectors for the transformation of the thin plate spline. And, conversely, by convolution to deconvolution, we get the places where precipitation falls. This neural network architecture takes into account that in some places precipitation falls traditionally. For example, a cloud that has flown over a city is more likely to spill than over a forest, because there is a different atmosphere over the city, a microclimate. There, for example, is simply warmer.
From horizon to horizon, from block to block, we transfer the state in question, and in the process we change it a little by means of the residual network. Residual is when we ourselves change the tensor quite a bit, adding measurements to it. The trained part is the delta of the trained part, the change of the tensor.
We take the memorized state, with the help of deconvolution we make of it some kind of precipitation map, we add them to the clouds and move them. This is the current network architecture. It works, predicts, and the results are pretty good - you can see them on the site .
But they are pretty good in terms of data science, ROC AUC, and F1-metrics, and the business is not interested in abstract figures and curves that we draw. Business is interested in the accuracy of these predictions, the accuracy of the text that the rain will end in 10 minutes and 20 seconds. We are now faced with another task. Now the neural network is learning with some kind of loss function. It maximizes the probability of correct classification using binary entropy. But in fact, it is necessary to improve other business metrics - not the correct classification, but the correct determination of the start and end time of precipitation. Studies on how to get loss functions for training neural networks from business metrics are very important and interesting. We continue to develop in the right direction.
In addition to business requirements, we still have quite a few plans for the development of the current solution. For example, at the moment we only use pictures, but we have a huge amount of information. The most interesting is the radial speed. Radar on the Doppler effect determines not only the presence of particles in the air, but also their speed. The length of the reflected wave, he understands the speed with which to move, to or from the radar. The results can also be used to predict a vector field. But unfortunately, we only have radial speed and only in places where there are really some particles, precipitation.
You can mix vector fields from weather modeling. There is wind, and you can add something else - for example, temperature.
We have a relief, height, land use, the type of underlying surface. In cities, precipitation behave differently than over the huge Baltic Sea. They fly over him and fall already in St. Petersburg.
An even bigger task that we are currently solving is the transfer of forecasts between radars. Now the neural network is building a forecast for only one zone, around one radar. A cloud that approaches the radar visibility boundary will never spill over to the next radar, because the neighboring radar will not know that there was a cloud somewhere. There is no such information in the input data, and the indicated question remains open.
It's all. I told about all the differences and similarities between the solutions of the competitions on Kaggle and the tasks of the business. Our current architecture is a convolutional neural network. It predicts not only movement, but also precipitation. Thank.
Under the cut - decoding lectures and slides.
My name is Alexey Preobrazhensky, I’m not a meteorologist, but a developer, and I’ll tell you about technical things, about data analysis.
')
How many people are involved in data analysis - are they competing at Kaggle, for example? Lot. And who is involved in the training of Yandex machine learning? The same, great. My report is organized roughly as a workout. Waiting for you a story about how we in the team of Yandex.Pogoda built nauchsting, what algorithms used, what data was used, how they measured and what we did.
Everyone who watched the film “Back to the Future 2” probably knows what naunting is. When doc Brown gets out of the car and says that the rain will end in 5 seconds, this is a naunting. But this is naughting in movies. Real-life science research — at least in the heads of managers — looks either as a notice to a person in the form of text or push notification, or as a precipitation map that moves with time. The task was precisely to develop a product that would combine both notifications and a precipitation map. The forecast of precipitation on the future map was required, floating clouds.
A year and a half ago, when we started, we had nothing but data. Unlike the participants at Kaggle, we had no fixed metrics, no baseline solutions. The only thing that happened was the constant technology race in which we wanted to overtake ourselves.
The first decision is simply Groundhog Day. Overtake the forecast, decide that tomorrow will be the same as yesterday. And the next model should improve the previous one.
What is needed to predict precipitation? Need data, radar images. It is necessary to understand how particles move in the atmosphere, what winds blow and how to apply this movement to particles. I'll tell you about all three components of the forecast.
The first - radar images. They come in very different formats and come from very different suppliers. These are just separate pictures in PNG, with the agreement that such and such intensity of the reflected signal is indicated by color with such a code. This is GeoTIFF - a picture in TIFF format with geo-information inside itself, where it is indicated which coordinates it refers to. Or - the scientific format NetCDF.
Radars differ greatly in update frequency. There are radars that are updated every 10 minutes, every 15 minutes. The worst thing is that the data from the radar - in contrast to the relatively clean data for the competition - contain artifacts. Radars operate on physical principles, on wave reflection, so that they have blind zones. And when small fragments of the visibility zone are radially closed by buildings, this is still far from the most difficult case.
Some radars are closed for about 50% of the range. There are also artifacts made by people. For example, during the beta testing period, we ran into a person who bought a Wi-Fi point, incorrectly tuned the frequency and channel number on it, and then put it out of the window. As a result, we hung over Ivanovo huge laser sword in the form of a cloud. We saw it on the map and could not do anything with it until we called Frequency Surveillance. Please, if you buy Wi-Fi-points somewhere in China, tune them to Russian frequencies.
In addition to radar data, it is necessary to take a vector field from somewhere else. In principle, it can be taken from just two places: either by analyzing previous radar images and applying, say, optical flow algorithms, or from some other sources. For example, you can use the weather modeling and the result of the work of the same RUF or Meteum. We take the field of winds and use it to transfer the pictures that the radar returns.
Both ways of getting vector fields have disadvantages. Optical flow can not be calculated in places where the cloud does not fly. There is nothing to reflect on the radar beam, and there is no data on air velocity and direction of motion.
Weather modeling may not coincide with reality. Therefore, if we used only the data of the weather models, it could happen that in the historical data of the radar the cloud flies in one direction, and then in the forecast of the winds it turns sharply and flies in the other direction.
The third component of nauchsting is an algorithm for applying a vector field. Here science can pretty much. We took as a basis the thin plate spline transform - the transformation of a picture that represents it in the form of a thin rubber plate and stretches some places. We parametrize this transformation with just a few reference vectors, and restore all other motion vectors inside the image by spline interpolation. This technology is used, for example, in the restoration of motion on the last frame of the video. Known scientific work.
Armed with the knowledge gained, we began to try to build a forecast. The first solution that came to mind was to simply train several neural networks so that the first neural network predicted the situation on the radar in 10 minutes, the second - in 20 minutes, the third - in 30. The requirement was as follows: predict radar data for about two hours forward.
Predictions turned out like this. At about the same time when we trained 12 neural networks, we had the opportunity to visualize the data on the map. Looking at the jumping clouds, the managers said: we will not release it for sure. One of them said: of course, I understand that this maximizes the likelihood of something there, but this cannot be explained to the user - in real life the clouds do not jump like that.
During the next iteration, we decided to count only the vector field and multiply the support vectors by 2 and 3 in order to get the transfer not by 10, but by 20 minutes and 30 minutes, respectively.
At near horizons, the results looked pretty decent, but the farther, the more often artifacts appeared on the edge. It turned out that in the vector field too large vectors break the thin plate spline, and we have the second mirror image of our image. Then the reflections merge. In the near horizons, the artifact was not noticeable, but it manifested itself very strongly on distant ones. A cloud appeared from nowhere.
The third solution was to consistently apply the same thin plate spline transformation to the same picture. On the one hand, it contributed to the accumulation of errors. This was the first really working solution, which we showed in the internal beta test. The neural network received six radar images at the input in the last hour, several convolutions brought them to the tensor of 16 4 x 4 vectors. The spline transform was reconstructed from the vectors and consistently applied to the picture to get each next forecast horizon.
The solution did quite well, but the only question left was: why do we need a neural network? If red convolutions are the only part that we teach, why don't we calculate the vector field on our own, algorithmically? So the fourth solution, which noticeably improved the result, used an explicit minimization of the loss function.
We were looking for a vector field that would equally well approximate the transition by 10 minutes in the last hour. From –60 minutes to –50, then to –40, and so on. We applied this vector field to t0 to get a forecast 10 minutes further.
Algorithmically it is much better to find a vector field using minimization. It works faster, does not require training. The most interesting - it does not require all the data. You can skip some data - and the radars are often delayed. We have long thought what to leave - neural networks or algorithmic calculations of a vector field. But all won the same laser sword in Ivanovo. When it hangs over you like a sword of Damocles and zooms out all the vectors around itself, the clouds can neither cross it nor move in the same area with it. Even some kind of physical movement in the picture does not occur.
Therefore, in the end, we came to the neural network. Now the neural network works and gives predictions, its architecture is shown schematically here. It is composed of about 12 identical blocks. Each block consistently builds a forecast over its horizon, receiving as input a state tensor and the last radar snapshot, the last prediction from the previous horizon.
The state tensor has a rather small dimension, only 32 x 32 by 30 channels, but by convolution to involution we get from it a vector field, support vectors for the transformation of the thin plate spline. And, conversely, by convolution to deconvolution, we get the places where precipitation falls. This neural network architecture takes into account that in some places precipitation falls traditionally. For example, a cloud that has flown over a city is more likely to spill than over a forest, because there is a different atmosphere over the city, a microclimate. There, for example, is simply warmer.
From horizon to horizon, from block to block, we transfer the state in question, and in the process we change it a little by means of the residual network. Residual is when we ourselves change the tensor quite a bit, adding measurements to it. The trained part is the delta of the trained part, the change of the tensor.
We take the memorized state, with the help of deconvolution we make of it some kind of precipitation map, we add them to the clouds and move them. This is the current network architecture. It works, predicts, and the results are pretty good - you can see them on the site .
But they are pretty good in terms of data science, ROC AUC, and F1-metrics, and the business is not interested in abstract figures and curves that we draw. Business is interested in the accuracy of these predictions, the accuracy of the text that the rain will end in 10 minutes and 20 seconds. We are now faced with another task. Now the neural network is learning with some kind of loss function. It maximizes the probability of correct classification using binary entropy. But in fact, it is necessary to improve other business metrics - not the correct classification, but the correct determination of the start and end time of precipitation. Studies on how to get loss functions for training neural networks from business metrics are very important and interesting. We continue to develop in the right direction.
In addition to business requirements, we still have quite a few plans for the development of the current solution. For example, at the moment we only use pictures, but we have a huge amount of information. The most interesting is the radial speed. Radar on the Doppler effect determines not only the presence of particles in the air, but also their speed. The length of the reflected wave, he understands the speed with which to move, to or from the radar. The results can also be used to predict a vector field. But unfortunately, we only have radial speed and only in places where there are really some particles, precipitation.
You can mix vector fields from weather modeling. There is wind, and you can add something else - for example, temperature.
We have a relief, height, land use, the type of underlying surface. In cities, precipitation behave differently than over the huge Baltic Sea. They fly over him and fall already in St. Petersburg.
An even bigger task that we are currently solving is the transfer of forecasts between radars. Now the neural network is building a forecast for only one zone, around one radar. A cloud that approaches the radar visibility boundary will never spill over to the next radar, because the neighboring radar will not know that there was a cloud somewhere. There is no such information in the input data, and the indicated question remains open.
It's all. I told about all the differences and similarities between the solutions of the competitions on Kaggle and the tasks of the business. Our current architecture is a convolutional neural network. It predicts not only movement, but also precipitation. Thank.
Source: https://habr.com/ru/post/328158/
All Articles