Learn and love Xdebug
Already 15 years have passed since the first release of Xdebug. A great reason to re-introduce this system to the world and explain how and why it does what it does.

Xdebug is an extension for PHP (must be compiled and installed during the PHP installation process) which presents the following debugging functionality to the developer:
Xdebug comes with detailed installation instructions that take into account almost all possible uses, although if you want to experiment with the functionality presented below, we recommend using Homestead Improved since Xdebug is installed and activated by default.
Modern IDEs provide extensive code search capabilities, so the usefulness of link formatting functionality seems dubious. There are all kinds of logging systems capable of handling errors and exceptions. Also, tracing and profiling functions are perfectly implemented in Blackfire. In spite of all this, formatting links to files is only one of the functions of Xdebug, and using Blackfire is associated with its own difficulties - installing an extension, setting hotkeys, and paying for saving trace history. And the use of loggers requires care, as adding them to the application at a later stage is not an easy task.
But the use of Xdebug is not limited to this. It is still needed for proper unit testing (testing frameworks are dependent on its code coverage reports), it is far from easy to debug through remote breakpoints by other means, and this tool is so old and stable that it has been polished to near ideal.
')
Of course, there is no need to use Xdebug if your current toolkit can provide everything that it provides, or if you do not need its capabilities, but I have not had a single project that could be completed as effectively without using it.
It is assumed that at this stage you already have an environment with Xdebug running. If not, try using Homestead Improved .
Let's create a new project consisting of a single index.php file and display the nonexistent $ foo variable:
Here is what we get:
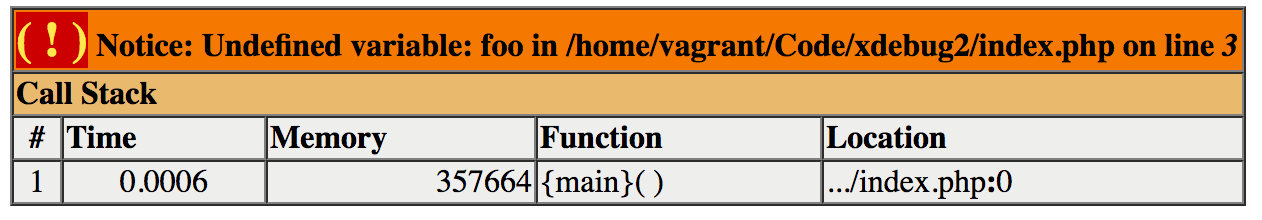
Blocks of notifications like this are so commonplace nowadays that most people do not even understand that they are already styled with Xdebug. To prove it, let's see how this message looked without Xdebug. To disable Xdebug, edit the /etc/php/7.1/fpm/conf.d/20-xdebug.ini file in Homestead Improved , and comment out the first line:
Then you need to restart PHP-FRM:
Note: if you are using a development environment with a different version of PHP, your Xdebug settings file will most likely be in a different place. Check the system documentation to find it or ask a question in the comments.

Looks pretty meager, right? The entire call stack disappeared from the output. Of course, for now this information is not very useful, since we work with only one line in a single file, but later we will use it quite often.
Now re-activate Xdebug, uncommenting the line in the previously edited file, and continue. Do not forget to restart PHP!
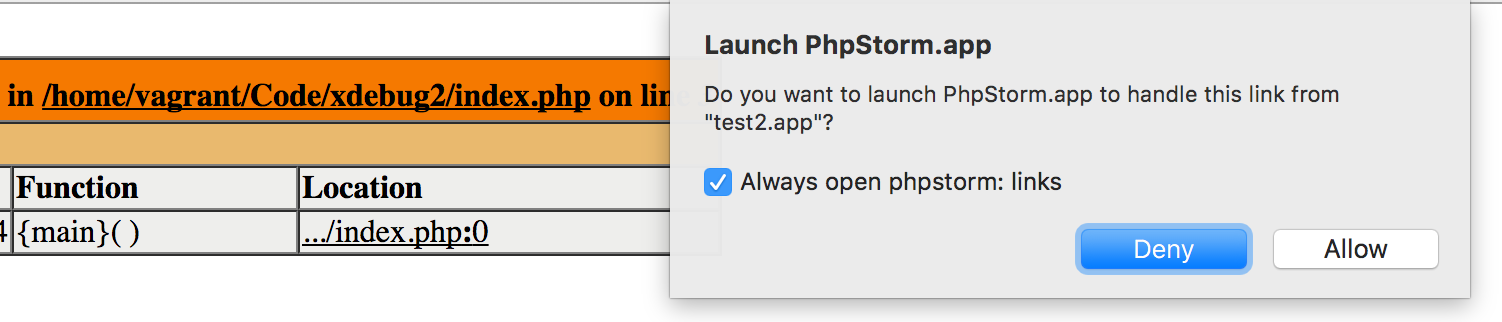
If you have a favorite IDE (I have, for example, PhpStorm), the ability to go to the files in it with a simple click in the stack trace would definitely be useful and would significantly increase the debugging speed. I will demonstrate how to implement this feature for PhpStorm.
Let's open the 20-xdebug.ini file again and add the following to it:
Note that not all browsers will work. For example, Opera will have problems with the phpstorm: // link and it will happily fall, while Firefox and Chrome handle such links perfectly.
If we now update our PHP error page, we’ll get the IDE opening links immediately at the exact location of the error:
The setup for working with other IDEs and editors is exactly the same.
Why stop at this? Many people today use virtual machines for development, allowing them to be sure that no part of the PHP runtime will affect the main machine while keeping everything fast and smooth. How does Xdebug behave in such cases? In addition, is it possible, in principle, to debug with break-points when you go through your code and check each line separately?
Fortunately, Xdebug perfectly supports the use of break points when remotely connecting. We have covered this process above, and you can find a fully illustrated setup guide in this article .
In the end, let's look at one of the frequently ignored functions: the profiler. To do this, we need some large application, for example Laravel:
Again, we need to make changes to the 20-xdebug.ini file, adding the following:
Note that we do not use xdebug.profiler_enable = 1, because we don’t want it to remain on all the time. Instead, we use the trigger parameter in the “XDEBUG_PROFILE” request for selective activation. We also output the cache profile to the main shared folder of our virtual machine, getting the opportunity to work with it in the host operating system.
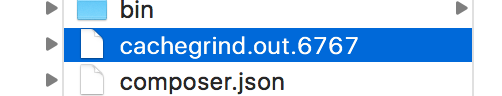
After restarting PHP, we can verify this by running homestead.app/?XDEBUG_PROFILE (replace homestead.app with the name of the virtual host you chose or the virtual machine IP address). Of course, the file is where it was expected:
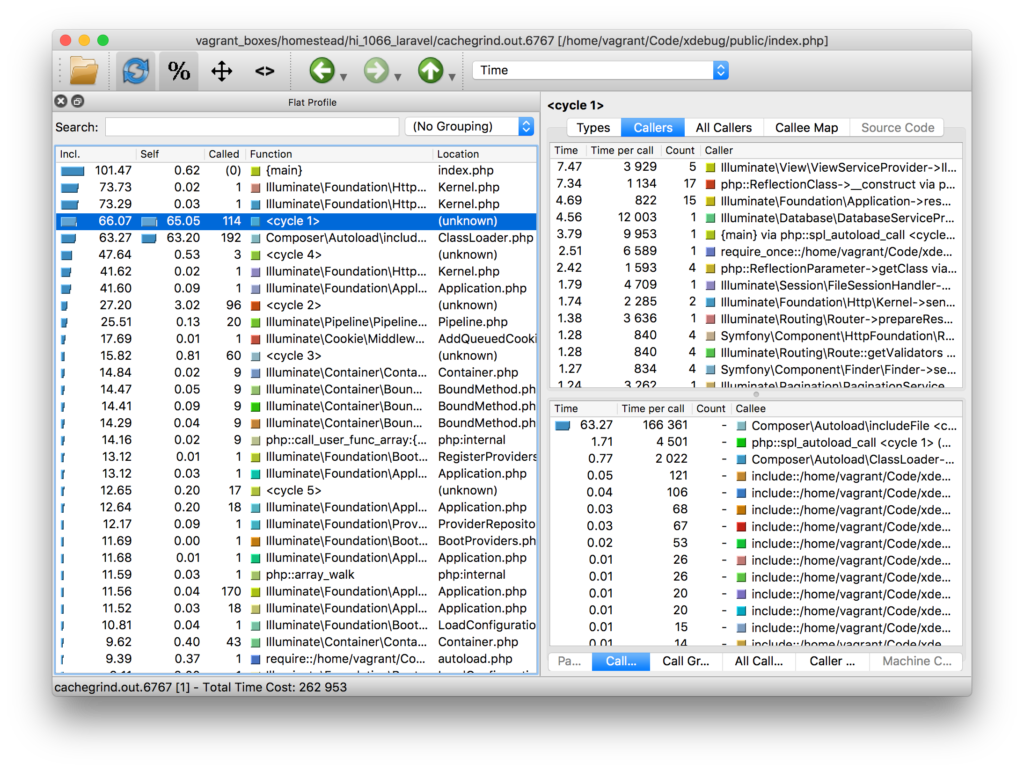
Each operating system has its own cache inspector, for OS X, for example, you can use qcachegring, which is easily installed via Homebrew. After installation…
... and opening the file, we see a convenient flow split:
Profiler provides detailed access to many data and the ability to thoroughly study the behavior of your code, as well as in Blackfire. However, with local profiler output, it is much easier to automate continuous monitoring of performance and complexity of execution.
By default, Laravel has its own error reports and rendering settings. An error, like the one that we called earlier with an undefined variable, in Laravel will look like this:
Although the symfony error screen (which Laravel uses in this case) can work just as well with the Xdebug transitions (try it! You can click on these files and their lines!), I really miss the memory information output (Xdebug by default displays a report on memory usage at each time point in the trace). Let's go back to the Xdebug screen in design mode to track this parameter.
As you can see, we updated our default routing so that first it activates the error display (the screen we saw earlier does not show an error as soon as it appears, but saves it to the stack of exceptions that was later extracted and visualized), then we return the error handler to its default value overriding the Laravel value.
After the update, of course, our old screen is back - just take a look at this stack trace and memory consumption sheet.
I advise you to continue to explore further on your own - review the documentation, play around with the settings, find out how much you can learn about your applications.
Xdebug is a valuable tool in the collection of any developer. This powerful extension fully corresponds to its name, making the language with which we work daily, more detailed, friendly and less mysterious when errors occur.
Over the 15 years of its existence, Xdebug has set high standards for debugging tools. I would like to thank Derik for developing and supporting all this time, and I’ll be happy if you decide to write one or two guides about in-depth use, pitfalls, or hidden combinations of functions that nobody has ever thought about before. Let's help its spread and development in the next 15 years.
Happy Birthday, Xdebug!
Xdebug is an extension for PHP (must be compiled and installed during the PHP installation process) which presents the following debugging functionality to the developer:
- Stack traces - output a detailed path that led the application to the error received, including the parameters passed to the functions, in order to easily track the error
- A more pleasant var_dump output that creates code highlighting and a structured view along with a dump of superglobal variables, by analogy with VarDumper .
- Profiler for searching for bottlenecks of the code with the possibility of visualized presentation of performance graphs by external tools. The result is a graph similar to the graphics from Blackfire .
- Remote debugger that can be used when connecting to Xdebug to run and execute code in the IDE or browser line by line through break points.
- “Code Coverage” which shows how much of the code was executed during the request process. This function is needed mostly for unit tests and getting information about how well your code is covered with tests.
How do i use it?
Xdebug comes with detailed installation instructions that take into account almost all possible uses, although if you want to experiment with the functionality presented below, we recommend using Homestead Improved since Xdebug is installed and activated by default.
Why do I need Xdebug when there is a modern IDE and Blackfire?
Modern IDEs provide extensive code search capabilities, so the usefulness of link formatting functionality seems dubious. There are all kinds of logging systems capable of handling errors and exceptions. Also, tracing and profiling functions are perfectly implemented in Blackfire. In spite of all this, formatting links to files is only one of the functions of Xdebug, and using Blackfire is associated with its own difficulties - installing an extension, setting hotkeys, and paying for saving trace history. And the use of loggers requires care, as adding them to the application at a later stage is not an easy task.
But the use of Xdebug is not limited to this. It is still needed for proper unit testing (testing frameworks are dependent on its code coverage reports), it is far from easy to debug through remote breakpoints by other means, and this tool is so old and stable that it has been polished to near ideal.
')
Of course, there is no need to use Xdebug if your current toolkit can provide everything that it provides, or if you do not need its capabilities, but I have not had a single project that could be completed as effectively without using it.
let's try
It is assumed that at this stage you already have an environment with Xdebug running. If not, try using Homestead Improved .
Let's create a new project consisting of a single index.php file and display the nonexistent $ foo variable:
<?php echo $foo; Here is what we get:
Disable Xdebug
Blocks of notifications like this are so commonplace nowadays that most people do not even understand that they are already styled with Xdebug. To prove it, let's see how this message looked without Xdebug. To disable Xdebug, edit the /etc/php/7.1/fpm/conf.d/20-xdebug.ini file in Homestead Improved , and comment out the first line:
;zend_extension=xdebug.so xdebug.remote_enable = 1 xdebug.remote_connect_back = 1 xdebug.remote_port = 9000 xdebug.max_nesting_level = 512 Then you need to restart PHP-FRM:
sudo service php7.1-fpm restart Note: if you are using a development environment with a different version of PHP, your Xdebug settings file will most likely be in a different place. Check the system documentation to find it or ask a question in the comments.
Looks pretty meager, right? The entire call stack disappeared from the output. Of course, for now this information is not very useful, since we work with only one line in a single file, but later we will use it quite often.
Now re-activate Xdebug, uncommenting the line in the previously edited file, and continue. Do not forget to restart PHP!
File transitions
If you have a favorite IDE (I have, for example, PhpStorm), the ability to go to the files in it with a simple click in the stack trace would definitely be useful and would significantly increase the debugging speed. I will demonstrate how to implement this feature for PhpStorm.
Let's open the 20-xdebug.ini file again and add the following to it:
xdebug.file_link_format = phpstorm://open?%f:%l Note that not all browsers will work. For example, Opera will have problems with the phpstorm: // link and it will happily fall, while Firefox and Chrome handle such links perfectly.
If we now update our PHP error page, we’ll get the IDE opening links immediately at the exact location of the error:
The setup for working with other IDEs and editors is exactly the same.
Xdebug, Vagrant and PhpStorm
Why stop at this? Many people today use virtual machines for development, allowing them to be sure that no part of the PHP runtime will affect the main machine while keeping everything fast and smooth. How does Xdebug behave in such cases? In addition, is it possible, in principle, to debug with break-points when you go through your code and check each line separately?
Fortunately, Xdebug perfectly supports the use of break points when remotely connecting. We have covered this process above, and you can find a fully illustrated setup guide in this article .
Using the profiler.
In the end, let's look at one of the frequently ignored functions: the profiler. To do this, we need some large application, for example Laravel:
composer create-project --prefer-dist laravel/laravel xdebug Again, we need to make changes to the 20-xdebug.ini file, adding the following:
xdebug.profiler_enable_trigger = 1 xdebug.profiler_output_dir = /home/vagrant/Code/ Note that we do not use xdebug.profiler_enable = 1, because we don’t want it to remain on all the time. Instead, we use the trigger parameter in the “XDEBUG_PROFILE” request for selective activation. We also output the cache profile to the main shared folder of our virtual machine, getting the opportunity to work with it in the host operating system.
After restarting PHP, we can verify this by running homestead.app/?XDEBUG_PROFILE (replace homestead.app with the name of the virtual host you chose or the virtual machine IP address). Of course, the file is where it was expected:
Each operating system has its own cache inspector, for OS X, for example, you can use qcachegring, which is easily installed via Homebrew. After installation…
brew install qcachegrind --with-graphviz ... and opening the file, we see a convenient flow split:
Profiler provides detailed access to many data and the ability to thoroughly study the behavior of your code, as well as in Blackfire. However, with local profiler output, it is much easier to automate continuous monitoring of performance and complexity of execution.
Forcing Xdebug to Laravel
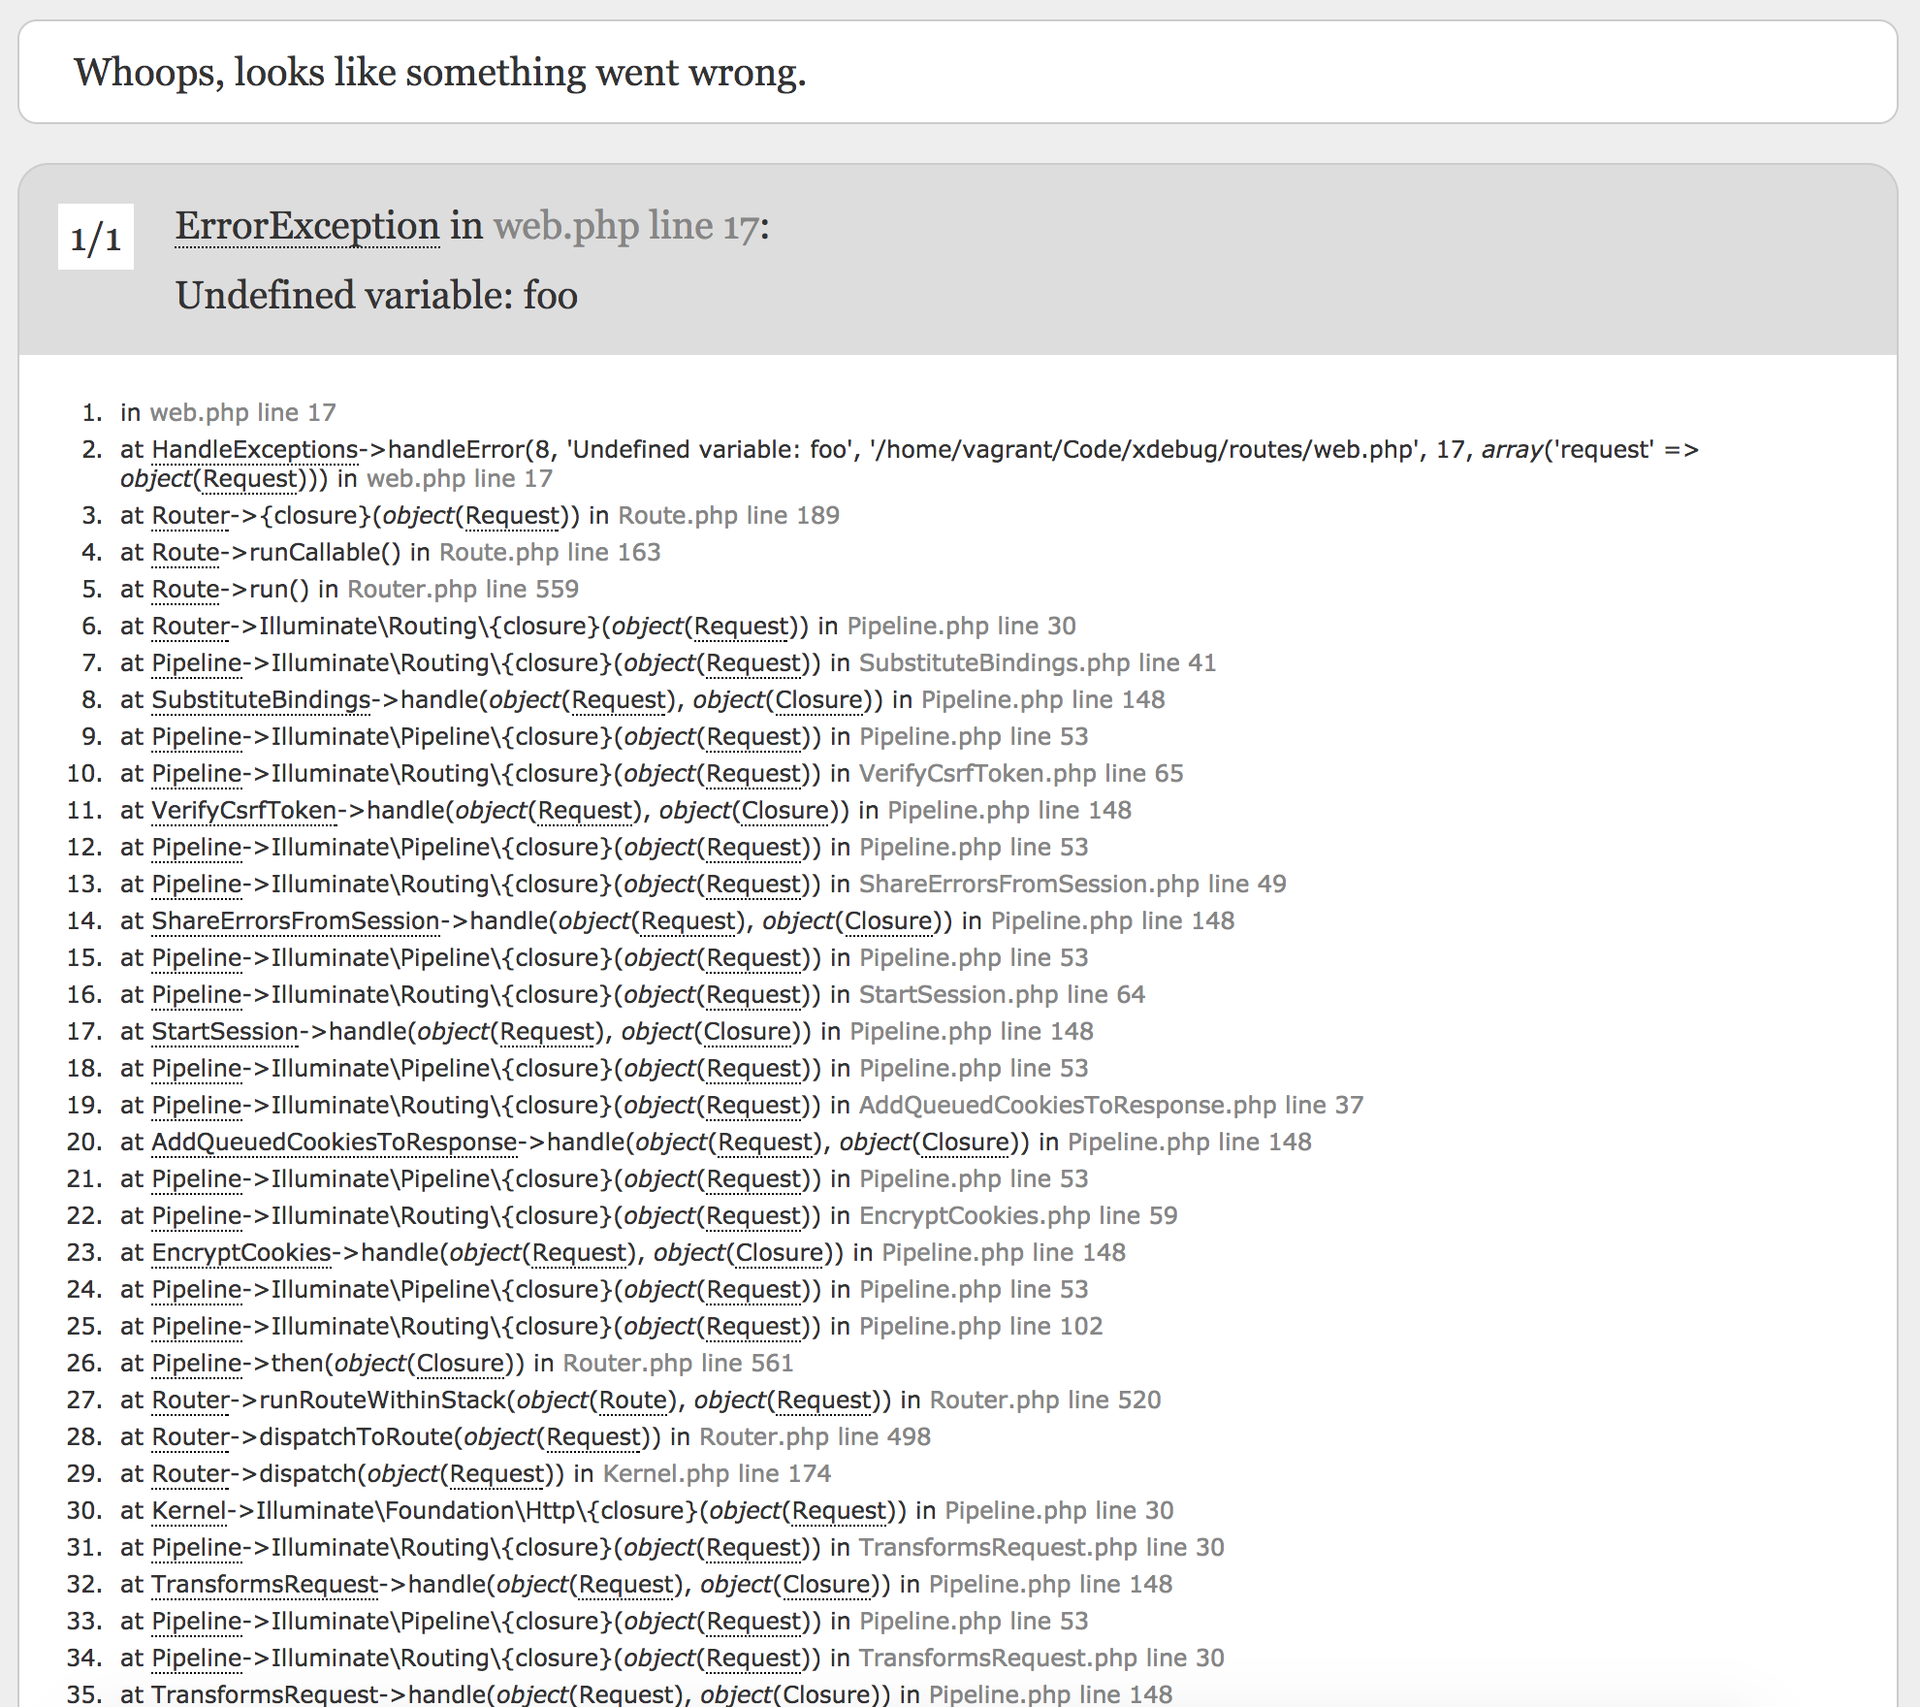
By default, Laravel has its own error reports and rendering settings. An error, like the one that we called earlier with an undefined variable, in Laravel will look like this:
<?php use Illuminate\Http\Request; Route::get('/', function(Request $request){ echo $foo; return view('welcome'); }); Although the symfony error screen (which Laravel uses in this case) can work just as well with the Xdebug transitions (try it! You can click on these files and their lines!), I really miss the memory information output (Xdebug by default displays a report on memory usage at each time point in the trace). Let's go back to the Xdebug screen in design mode to track this parameter.
<?php use Illuminate\Http\Request; Route::get('/', function(Request $request){ ini_set('display_errors', 1); restore_error_handler(); echo $foo; return view('welcome'); }); As you can see, we updated our default routing so that first it activates the error display (the screen we saw earlier does not show an error as soon as it appears, but saves it to the stack of exceptions that was later extracted and visualized), then we return the error handler to its default value overriding the Laravel value.
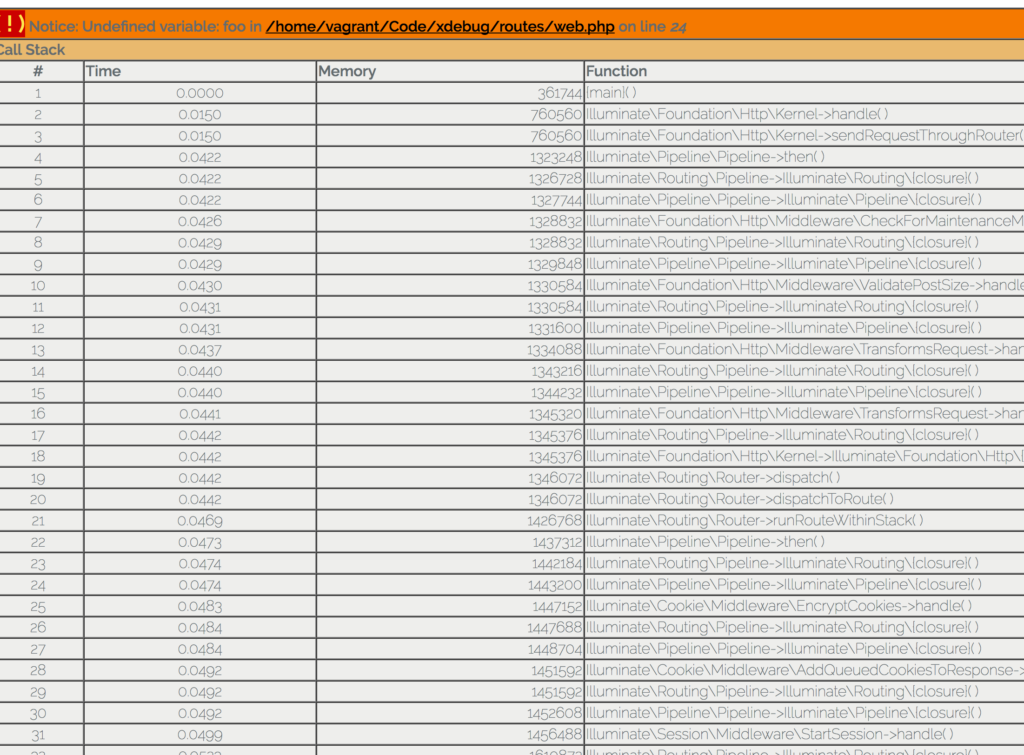
After the update, of course, our old screen is back - just take a look at this stack trace and memory consumption sheet.
I advise you to continue to explore further on your own - review the documentation, play around with the settings, find out how much you can learn about your applications.
Conclusion
Xdebug is a valuable tool in the collection of any developer. This powerful extension fully corresponds to its name, making the language with which we work daily, more detailed, friendly and less mysterious when errors occur.
Over the 15 years of its existence, Xdebug has set high standards for debugging tools. I would like to thank Derik for developing and supporting all this time, and I’ll be happy if you decide to write one or two guides about in-depth use, pitfalls, or hidden combinations of functions that nobody has ever thought about before. Let's help its spread and development in the next 15 years.
Happy Birthday, Xdebug!
Source: https://habr.com/ru/post/328094/
All Articles