Splunk Machine Learning Toolkit Overview
In addition to the fact that Splunk can collect logs from almost any source and build analytical reports, dashboards, alerts based on the built-in SPL search query language, which we wrote about in previous articles, Splunk still has a very large base of free add-ons and applications.
Today we look at one of the most popular, from the point of view of users, applications - Splunk Machine Learning Toolkit.
I’ll say right away that Splunk Machine Learning Toolkit is narrowly specialized in tasks and data types specific to Splunk. It only supports unsupervised learning algorithms, and has a very specific application.
')
Since Splunk is primarily focused on machine data, the cases implemented in the Machine Learning Toolkit are aimed at this specificity. Next, we consider in detail each case, but first briefly about the installation.
Where to get?
The application itself is free to download on Splunkbase , but since all the Machine Learning algorithms are based on Python, before installing you will need to install Python for Scientific Computing Add-on, it’s also free and installs easily and quickly. All instructions here .
Application possibilities
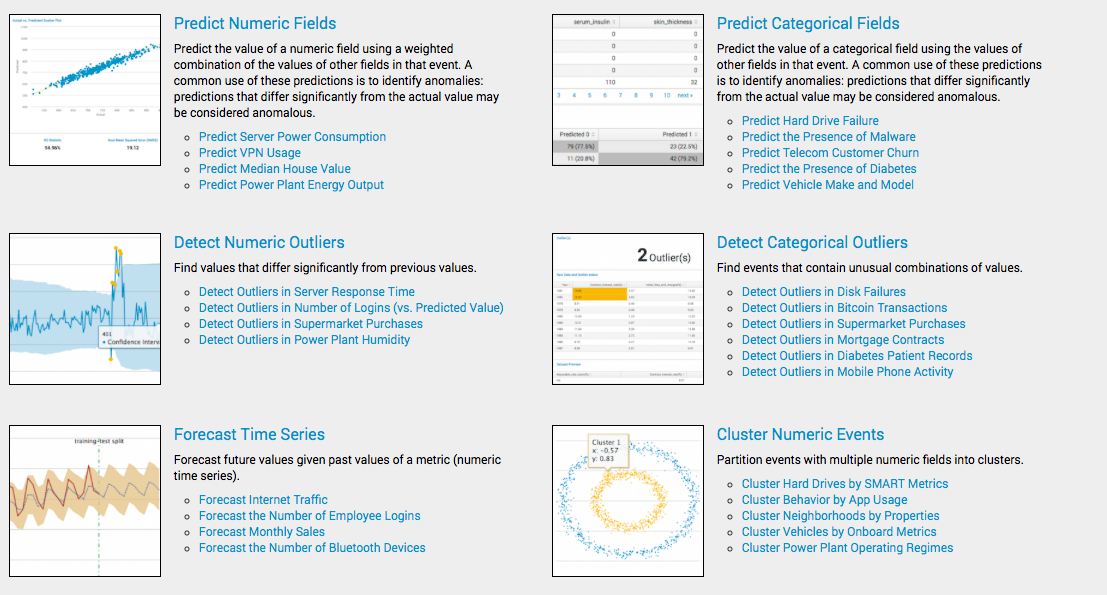
Splunk in this application implemented 6 cases of applying Machine Learning features with basic statistical algorithms:
1. Predict Numeric Fields
This module makes a prediction of the values of numeric fields, based on a combination of the values of other fields in this event.
Example:
We have data on the number of users using various information systems (CRM, CloudDrive, WebMail, Remote Access and others) within the company for each day.
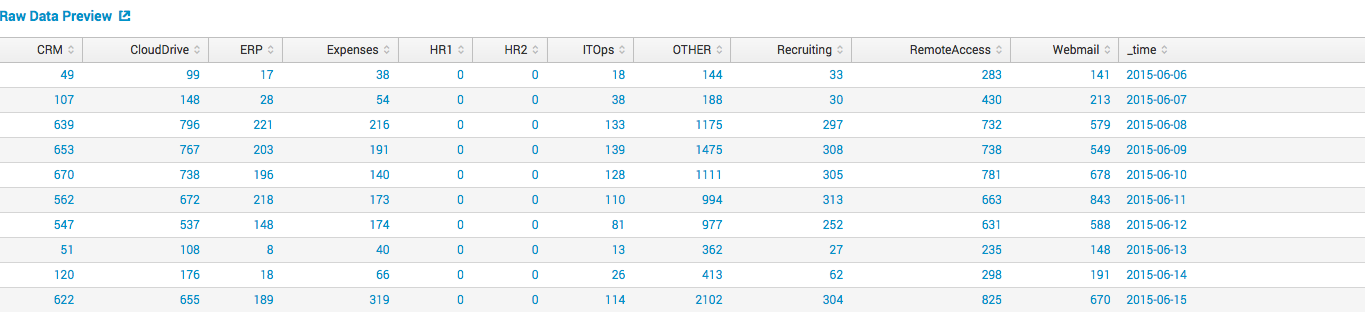
Splunk can easily collect all this data and organize it into a tablet like in the picture. We want to predict the number of VPN users based on data from other fields (CRM, CloudDrive, HR1, WebMail), for this we can build a model based on linear regression.
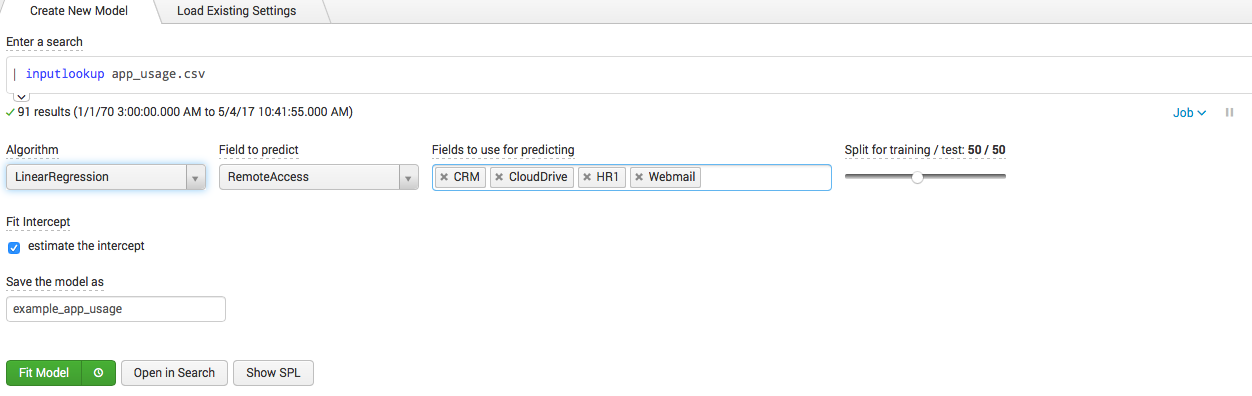
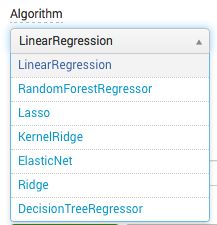
It is clear that we can change the dependent fields, and the algorithm itself. There are several other popular algorithms for linline regression.
Then press the fit model and get all the calculations, and as a table format,
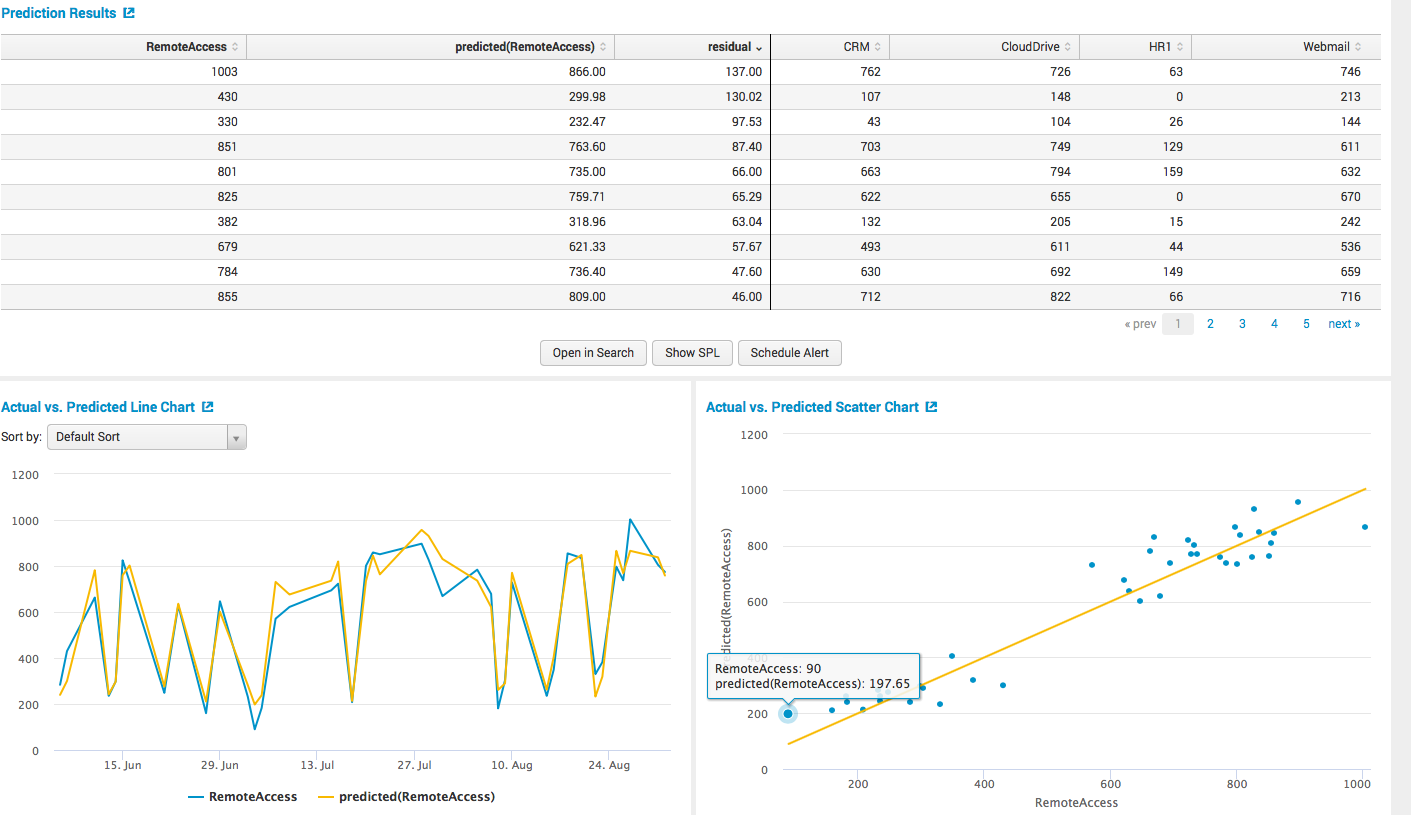
and graphically.
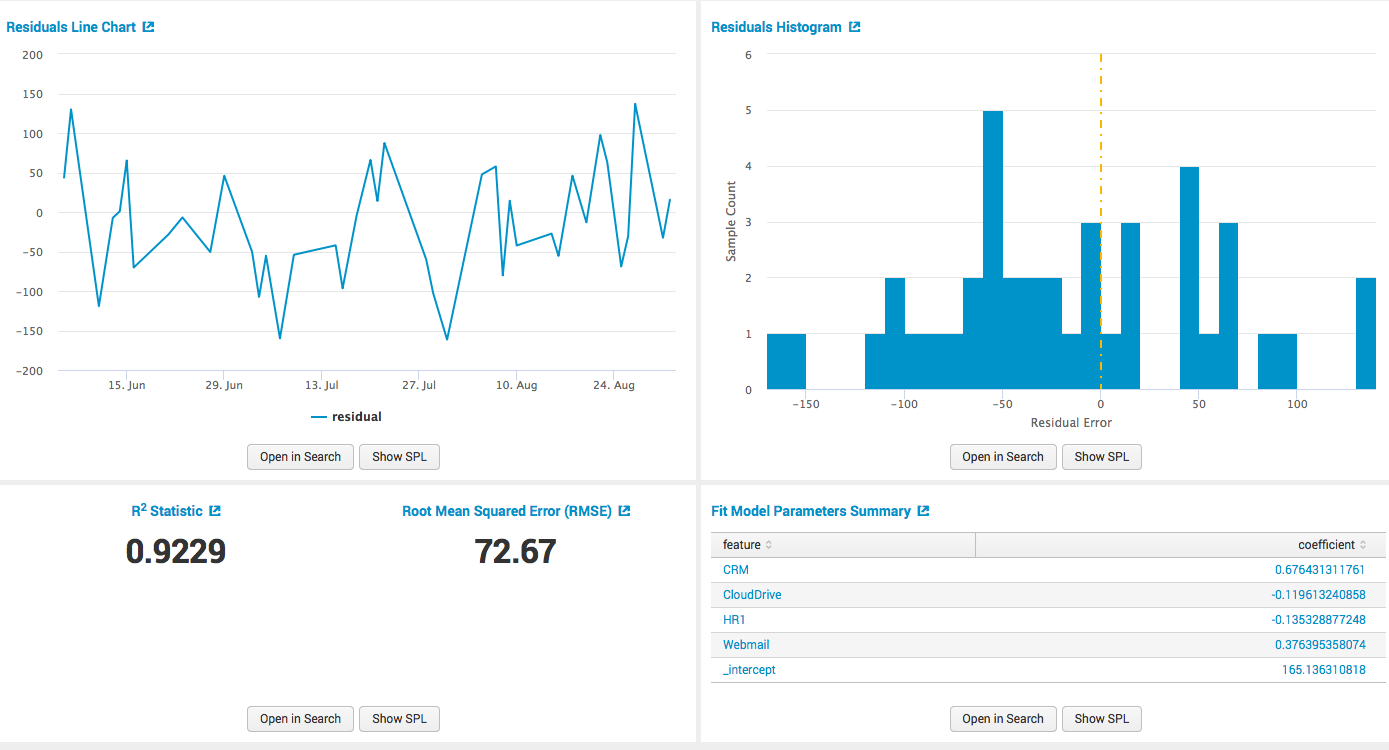
Further, when we have built a model, we can apply its results in other queries, make dashbodras, build alerts on them and so on.
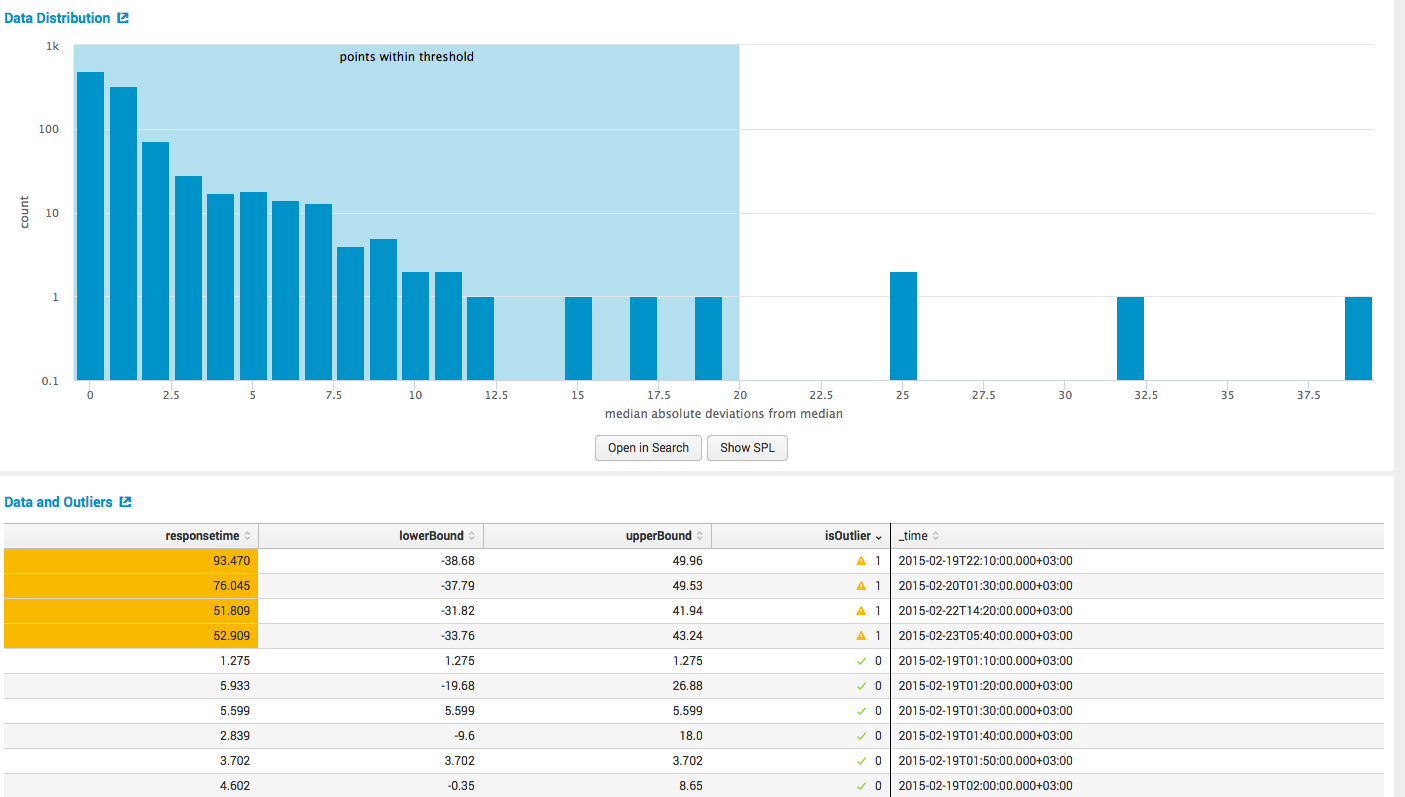
2. Detect Numeric Outliers
This module detects anomalous values based on previous data for this field.
Example:
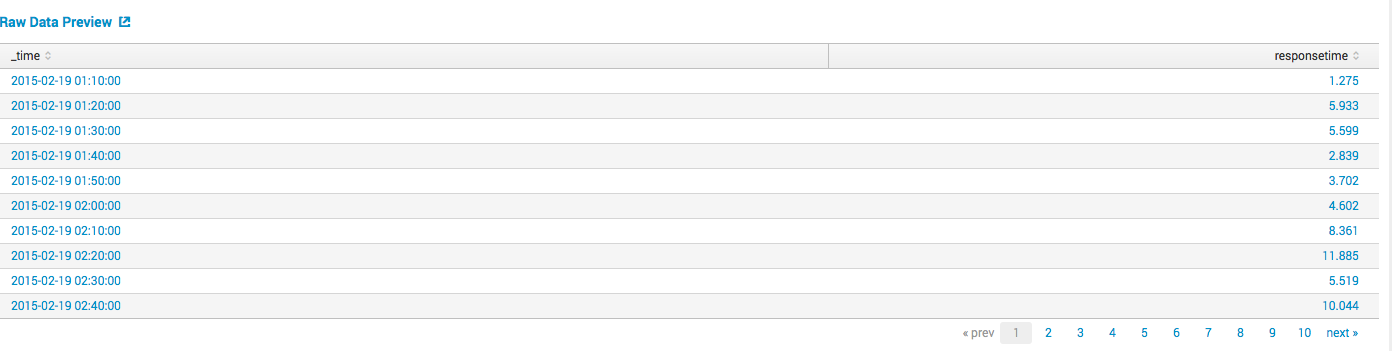
We have data on the maximum server response time to customer requests for every 10 minutes, which Splunk easily collects from the server or servers and presents it as a label:
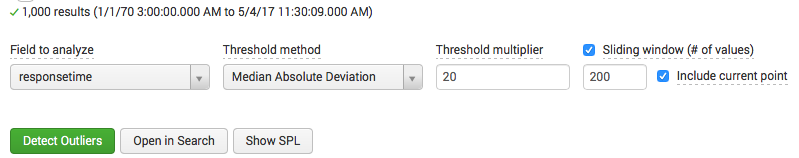
We want to find anomalies, that is, events when the response time was very long, well, or very fast, based on historical data. Splunk offers three measures of variation for identifying anomalies (SD - Standard Deviation, IQR - Interquartile Range, mad- Median Absolute Deviation). We construct a model based on the standard deviation:
Then we get the results:
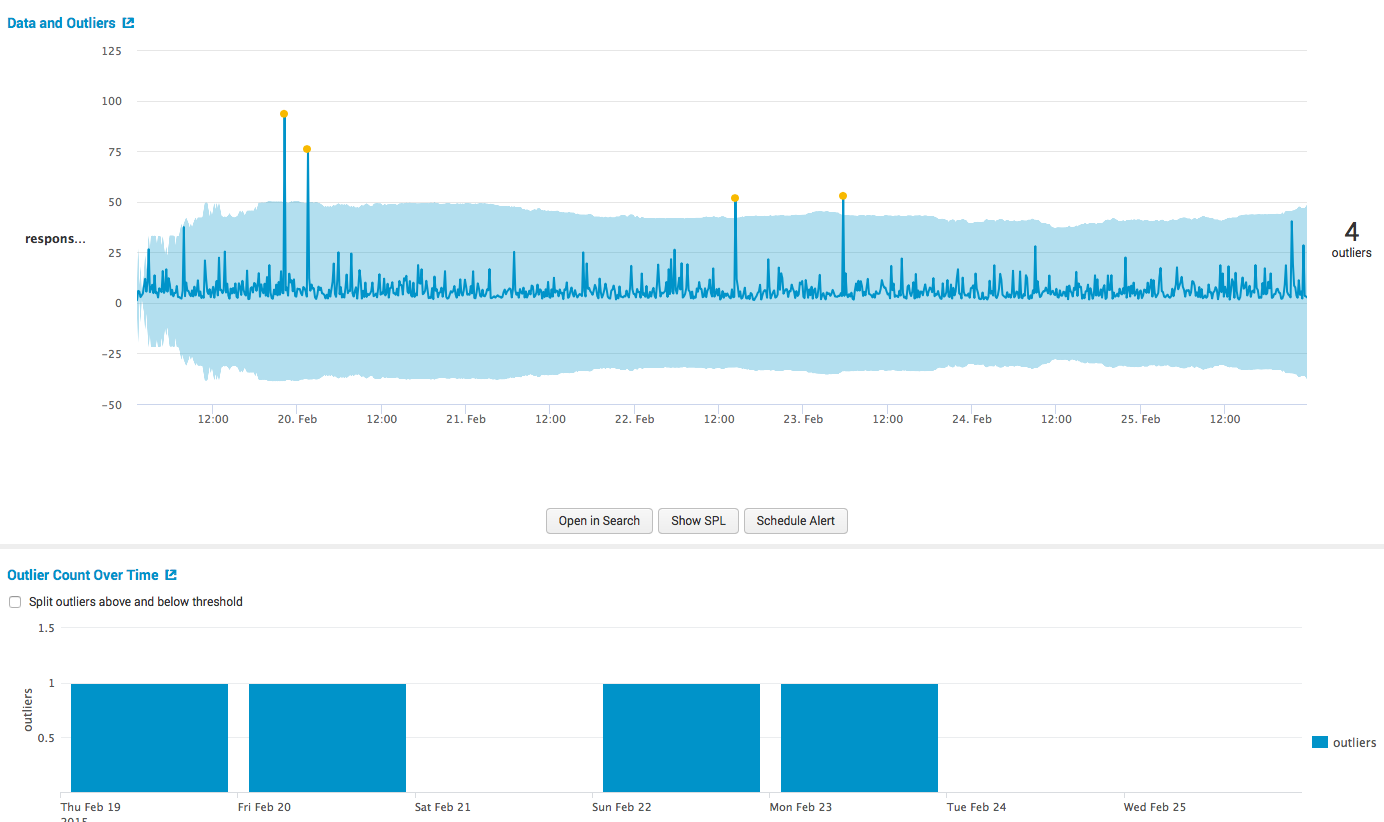
and the main calculations, both in tabular and in graphical form.
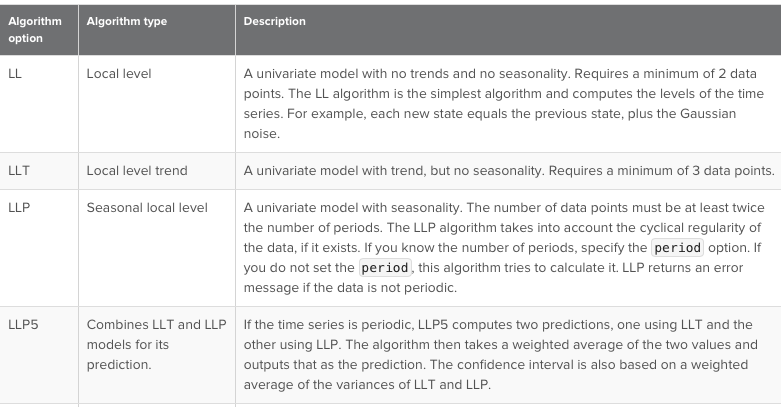
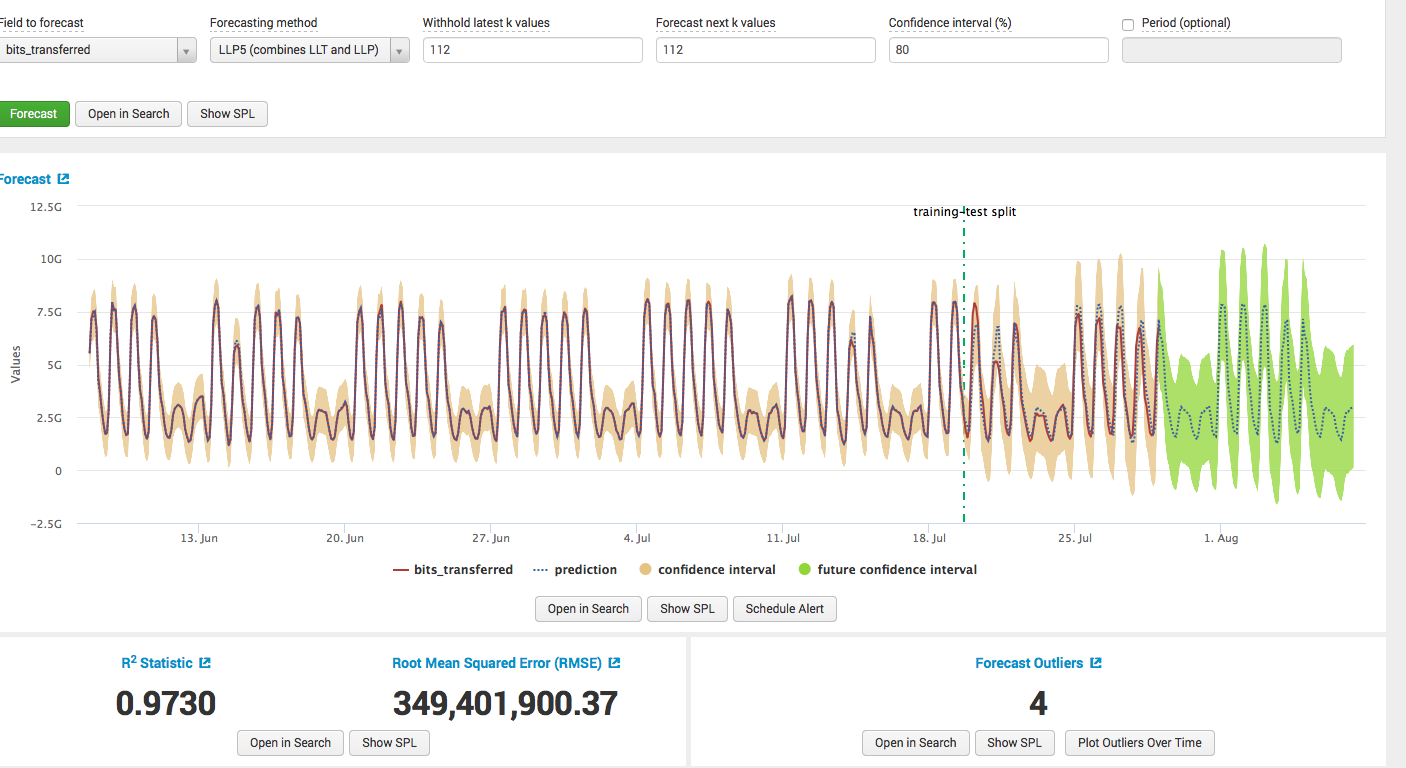
3. Forecast Time Series
This module is designed to predict time series, that is, based on past data, predict future ones.
The main algorithms are as follows:
Example:
We have data on the amount of traffic sent by the user, or the server or gateway, in fact, it does not matter where.
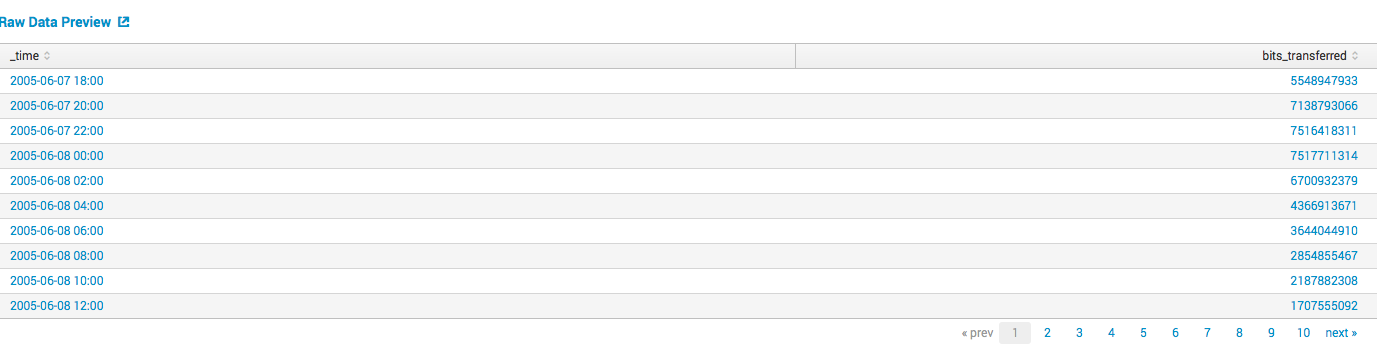
We want to predict the amount of traffic in the future.
We build a model: we choose an algorithm, we select a training sample, we choose the number of values for the forecast, and we obtain results with calculations about the quality of the model.
4. Predict Categorical Fields
This module is designed to predict categorical, that is, qualitative variable based on other fields in this event.
The main algorithms are as follows (description here ):
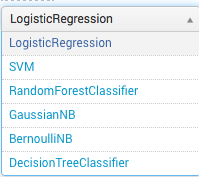
Example:
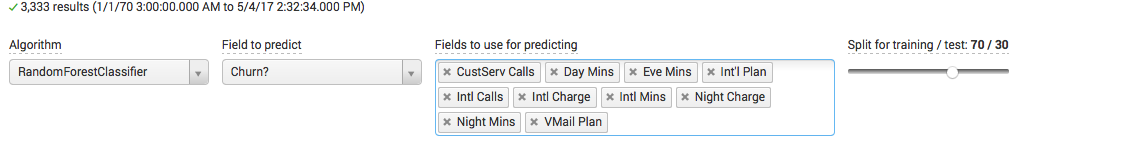
There is data from the telecom operator with customer information (the number of internal and external calls, cost, night calls, availability of special tariffs, etc.). The main thing in this data is the Churn field ? which shows the client has left or left. That is what we want to predict, based on the above fields.

We build the model: we choose the algorithm, we select the dependent variables, the size of the training sample and other possible parameters depending on the algorithm:
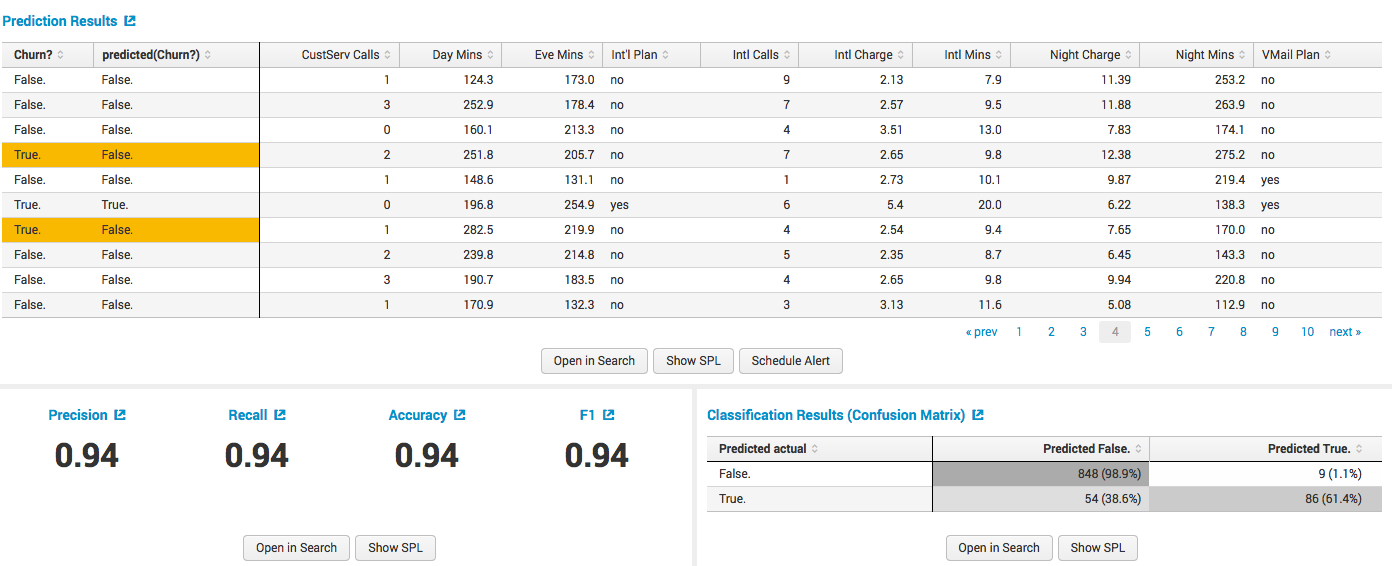
We obtain the results of training with data on the quality of the model:
5. Detect Categorical Outliers
The module is designed to search for anomalies based on the analysis of field values in the event, the algorithm for determining anomalies here .
Example:
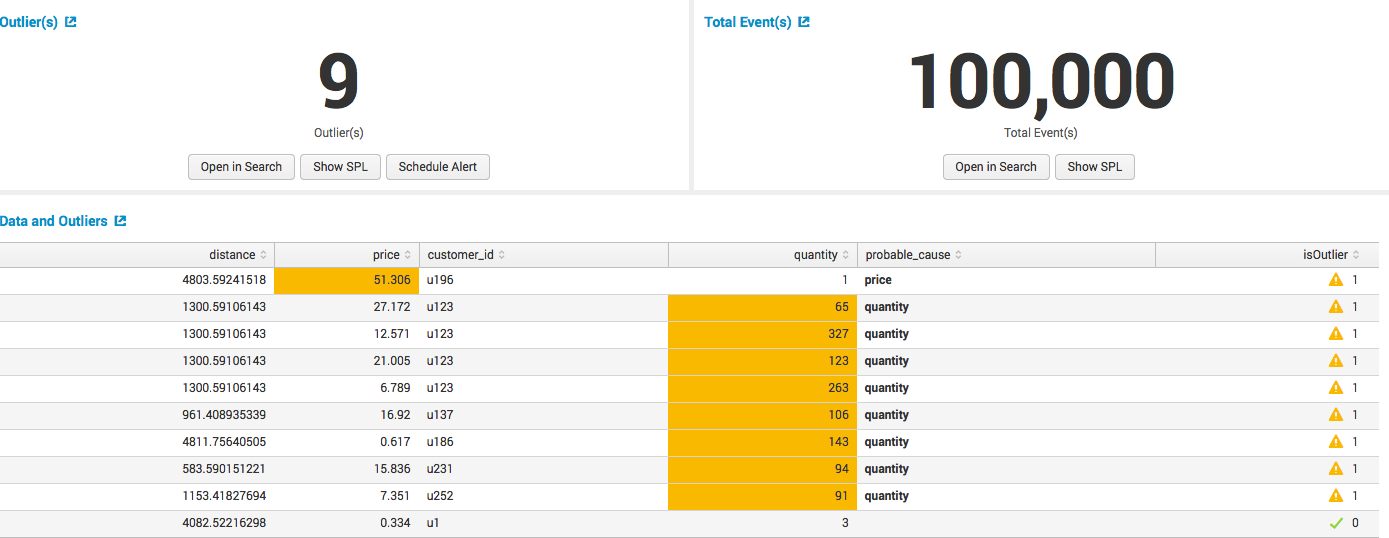
We have data with information about purchases in the supermarket and we want to find anomalous transactions.
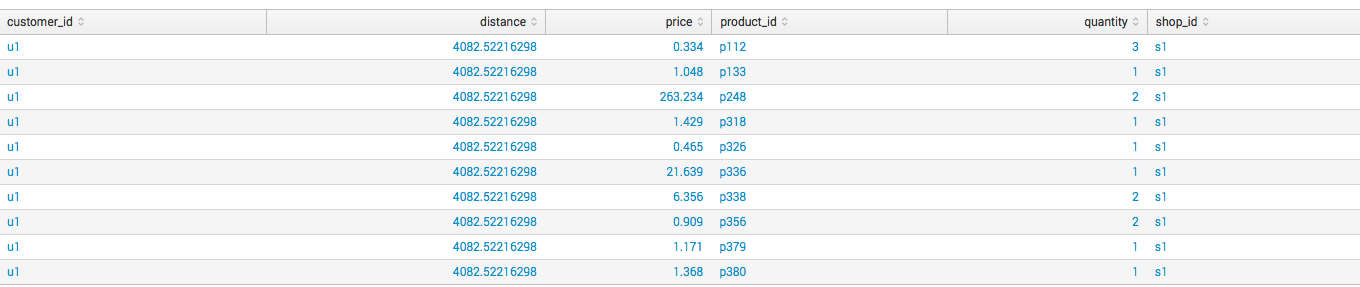
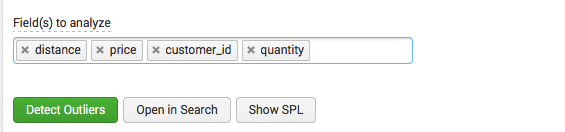
Select the fields by which we want to determine the anomalies:
We get the result with the anomalies found:
6. Cluster Numeric Events
The module allows clustering of events. Probably the weakest module, in terms of popularity of use.
Example:
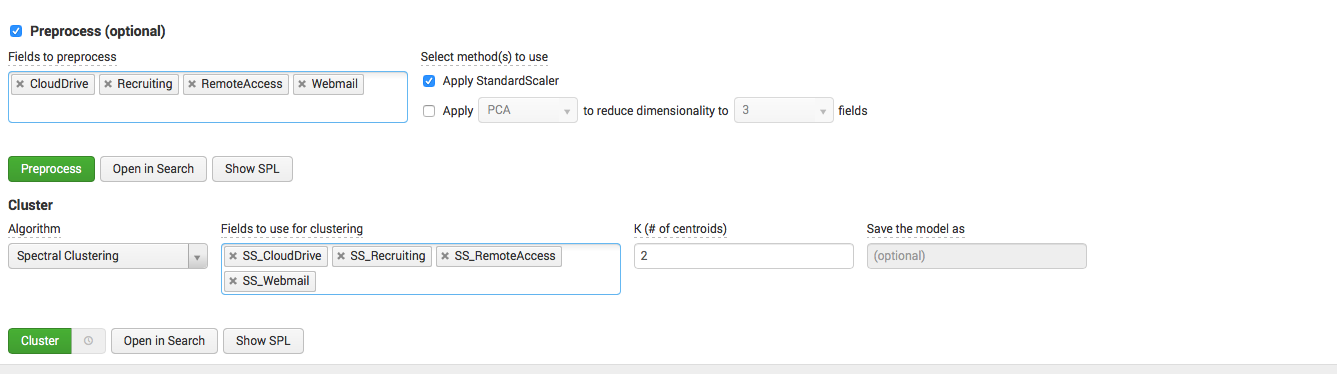
We have data from Example 1 on the number of users using different information systems. We want to define to cluster them.
Model: select fields for clustering, normalize them, choose an algorithm and dependent fields, and also indicate the number of clusters.
Look what happened:
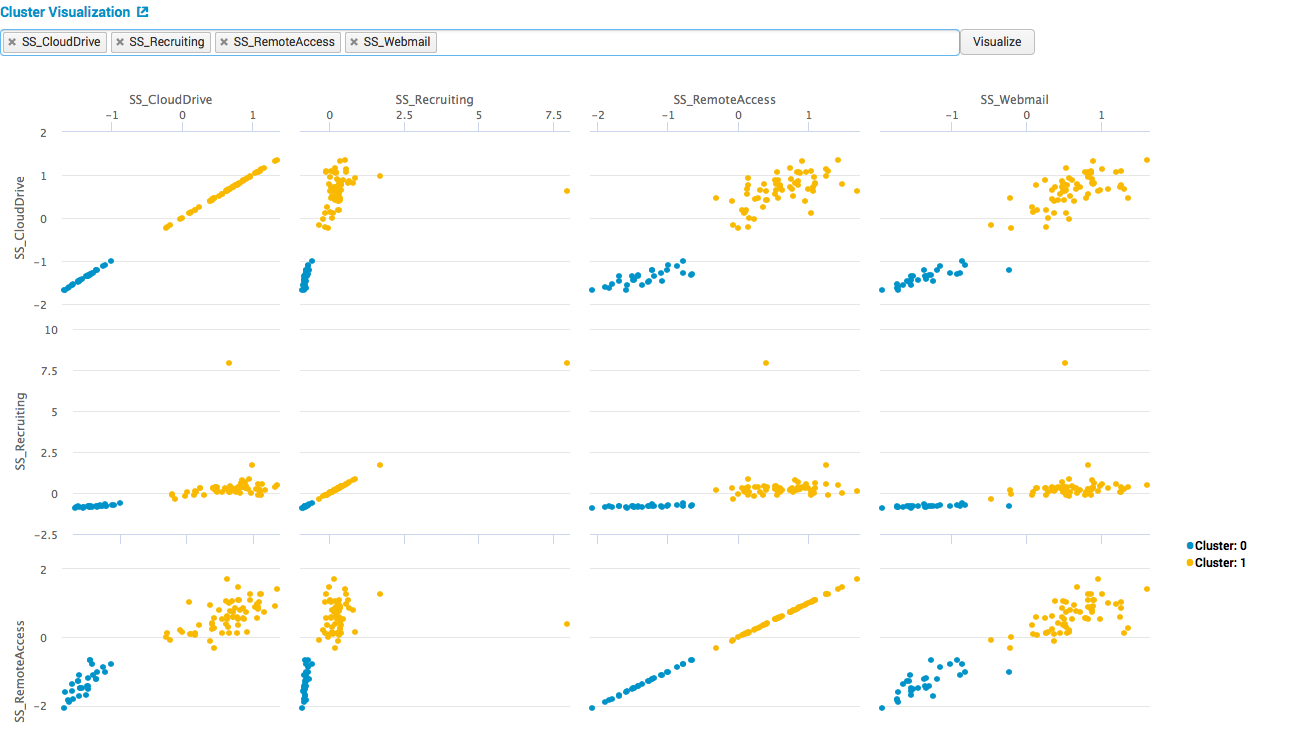
In the pictures we see 2 clear clusters, then if we are engaged in the interpretation of the results, it can be understood that the first cluster is everyday life, and there are many users in the selected systems, the second is days off, and few users.
The weakness of this module also lies in the fact that there are no metrics of model building quality in it.
Results
- Splunk is very good in that it creates all of these tags that we get at the entrance to each model from a huge number of logs from various systems, which is actually not very simple (he collects them, and stores, and preprocesses)
- If you need a quick statistical analysis, that is, the basic operations of Machine Learning - no need to go anywhere
- This is not the end result, then there may be a separate workflow, alert for example, or care in dashboards
- Splunk has an open API and if you do not have enough algorithms, you can load them from open Python libraries, information on how to do it here.
- Splunk can also give results outside, for example on the same API.
Source: https://habr.com/ru/post/327943/
All Articles