The recipe for the perfect Habropost

In our opinion, the creation of an “ideal post” is not only the process of choosing a topic and writing a text. A considerable share of success lies in the design and the circumstances in which the article was published. The length of the title, the amount of text to Kata and attractive picture - all of these factors have their own weight. Would you like to get 30% more views by simply changing the design of the post and the time of placement?
We at Cloud4Y would love to. Therefore, we conducted an in-depth analysis of publications on Habrahabr over the past six months and today we want to share new useful findings.
')
How are publications distributed by the number of views on Habrahabr?
Normal distribution is most often regarded as a suitable model for describing a process that is subject to a large number of independent random causes. In this case, the distribution density of a random variable has a symmetric, bell-shaped form. However, in some cases, observations show that a random variable has a markedly skewed distribution, for example, in the case of the distribution of publications by the number of views, since their number cannot be negative. We concluded that a lognormal distribution is most appropriate for describing the distribution of posts on Habré.
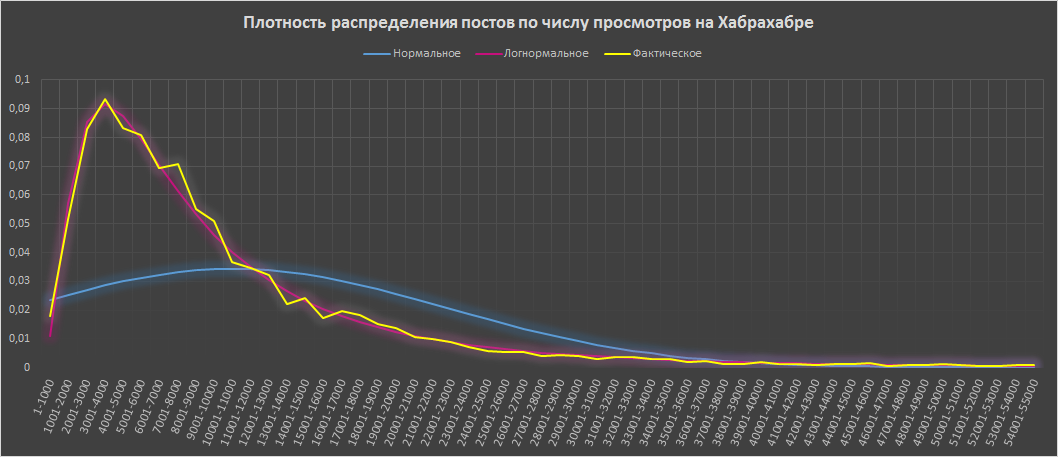
What is the difference in the processes leading to normal or lognormal distributions? As we said earlier, both distributions occur when the described object is affected by many random and independent factors. If the effects of each of the factors are added up, there is an additive nature of their interaction, then there is a normal distribution.
If the effects of each of the factors do not add up, but multiply, there is a multiplicative nature of the interaction, which often corresponds to a Lognormal distribution. The factors are also independent as in the case of a normal distribution, but the effect of their influence accumulates in the object depending on their previous number.
Consider the process of typing views from the publication. Understanding the process will allow you to build an adequate statistical model. The popularity of the post is made up of many factors, which we will discuss later. The published article falls into the “ALL CONTRACT” section. From the time of publication, the post has a day to advance to the first positions in the “BEST - For the day” section, a week to type views in the “BEST - For the week” section, and so on.
However, in these, as well as in any other section “BEST”, articles are sorted in descending order of rating. You can vote for articles only in the first 72 hours from the moment of publication. Therefore, the most important indicator affecting the position of the article in the TOPs will be known after only three days and will not change. As a result of this sorting, a multiplicative interaction is obtained, with each subsequent voice affecting the publication in proportion to its current state. One vote will lead to different consequences (views) in the case of the very first vote or additional to the already existing rating. If it were not for the cumulative effect of the already typed rating and the number of views, the articles would be distributed normally. In our case, a more adequate model is the model of multiplicative interaction and the lognormal distribution. It takes into account not only the random effects of factors, but also the accumulated state of the post.

Knowing the distribution model, we can give in the analysis not only the mean values, but also the limits of the confidence interval, with an emphasis on the variability of the indicators. This allows the reader not to focus only on the average and also consider the probabilistic nature of obtaining various indicators of the popularity of posts.
Factor # 0 - header length
A short and enticing title is one of the main reasons why the user will start reading the article announcement.
Perhaps there is only a second to get additional credit for the attention of the user who runs through the headlines of articles. A short title fits into this standard.
Perhaps the reader will have too few 15 characters of the “perfect” short title and he will start reading the announcement. And here the user enticed by an interesting text before kata has already opened the full text of the article.
One way or another, with an increase in the length of the title, the average number of article views falls.

Factor # 1 - the length of the text to kata and the presence of pictures
No need to explain that the announcements of articles on Habré are in the general list. Users separate the text of the announcement from the main body of the article using a tag
<cut /> We calculated the length of the text to kata in 6500 posts. They divided the publications into groups according to the number of characters of the text and the presence of a picture, or a video from YouTube to kat. Here is what happened:

It turned out that, other things being equal, without inserting a picture or video before the kata, about 17.5% of views are lost. This indicator falls with increasing length of the text of the announcement. The most popular are articles with text lengths from 1350 to 1500 to kata. Too short text before kata, especially without the insertion of a picture or video, reduces the popularity of the article, due to the invisibility to readers who scroll through the publications.
At the end of the graph of the average number of views of articles without a picture to kata and a text length of more than 1500 characters, we see a decrease in the popularity of such articles. Apparently, the reason for this is that the user manages to evaluate the article and in some cases decide not to continue reading.
It is also worth noting that all articles with lists up to kata (ul tag) were deleted from the sample. If there are lists in the announcement, the length of the kata must be calculated by the number of lines, and not by the number of characters.
Factor # 2 - the length of the text publication
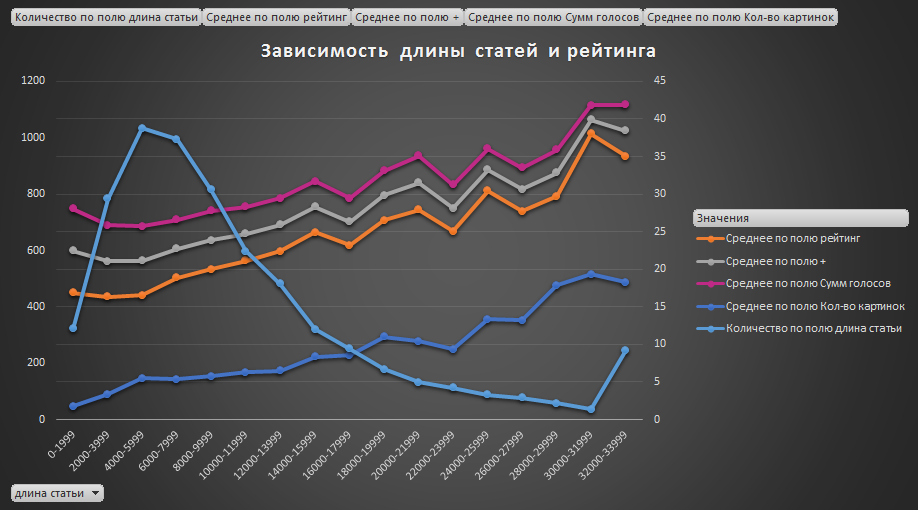
The greatest rating is collected by long articles.
The graph shows how the average rating of articles creeps up, moving along the growing length scale of the text of the publication. For analysis, we collected the text of articles in Excel cells, as a result of which we had a limitation of 32767 characters for the article. The average number of characters in articles on Habré is 10,500, and more than 32767 characters are only 232 out of 6525 (3.6%). By lowering the rating at the end of the chart, we can only assume that the maximum rating is gained from articles from 30k to 32k characters.
Does the frequency of the appearance of pictures in the text influence its popularity?
No, we did not find such a relationship. We divided publications into groups according to the number of characters. In each of these groups, we looked at the average number of views for publications with different numbers of characters per image. There is no obvious downward trend when the frequency of images in the text decreases. Perhaps the results should be recalculated to identify the dependence of the popularity of the article on the frequency of occurrences in the text of the code inserts.
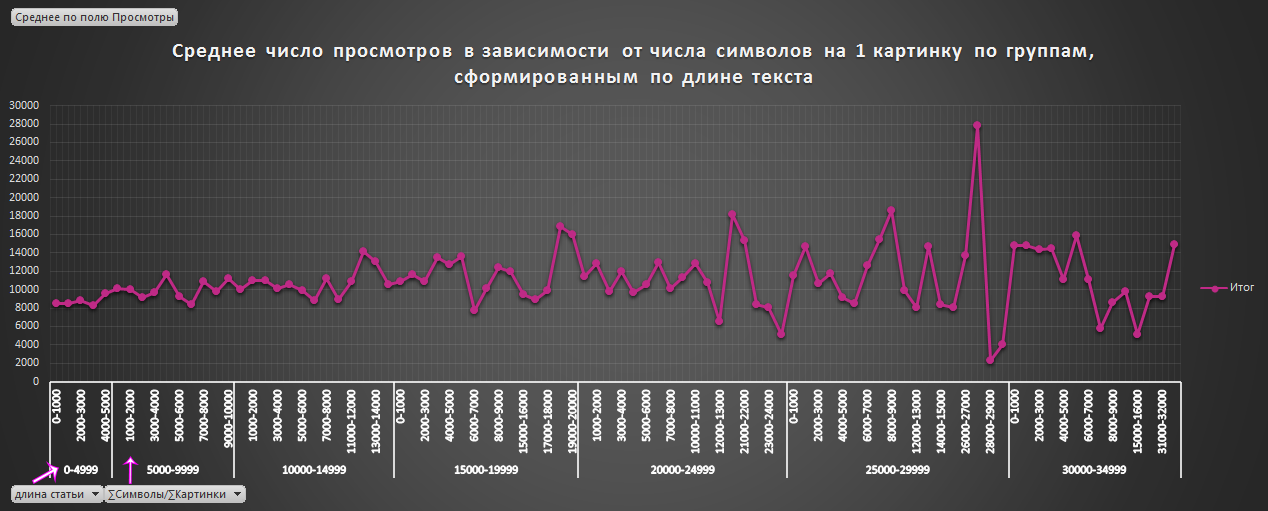
The frequency of pictures in the text does not determine the popularity of the article.
Factor # 3 - Competition
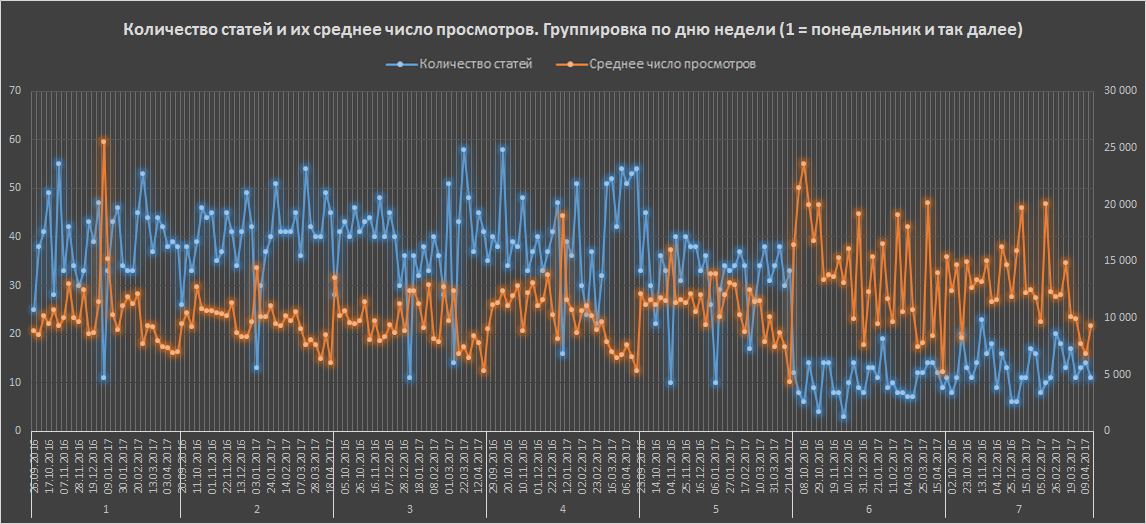
In our previous article “Analysis of publications on Habrahabr over the past six months. Statistics, useful finds and ratings " we found that the highest average number of views gaining posts published on Saturday and Sunday. The reason for this is that these days the least number of articles published for the whole week. The result of relatively low competition is that each article gains more views.
53.9% of posts for the analyzed period are written in personal blogs, 46.1% are posted on companies' blogs. Most companies make their publications on weekdays. The reader’s choice on weekdays is more and each article has less attention.
The recipe for "perfect" publication =
- Short title from 11 to 15 characters
- Announcement to kata length from 1350 to 1500 characters
- Picture to Kata
- The text of the article from 30k to 32k characters
- Publication on the night from Friday to Saturday
All these recommendations will help your article to become more popular compared to the same article, but published at a different time and otherwise designed.
Ultimately, any article will have 72 hours, during which a vote will take place, which will determine the future of your post. When preparing a “prescription” post, some circumstances will be to your advantage, and not against you. Habrahabr enables users to determine the fate of each publication. Therefore, interesting articles have gained and will gain the most views.
PS
Ask questions in the comments, if possible we will try to calculate and publish statistics you are interested in on this topic. The link in our vk group, you can download the Excel file c data on publications that we have collected for this analysis.
Source: https://habr.com/ru/post/327931/
All Articles