How we optimized Twitter Lite
Twitter Lite and high-performance progressive web applications on React
A look at how ordinary and unusual performance bottlenecks were removed when creating one of the world's largest progressive web applications (PWA) on React.js - Twitter Lite
Creating a fast web application requires many measurement cycles where time is spent. You need to understand why this happens and apply potential fixes. Unfortunately, there is no one simple solution. Performance is an endless game where we look for and measure areas for improvement. Twitter Lite has made a lot of small improvements in different areas: from the initial loading time to rendering the components React (and preventing re-rendering), loading images and much more. Most of the changes are small, but they add up, and in the end we got one of the largest and fastest progressive web applications .
Before reading
If you have just started measuring and working on improving the performance of your web application, then I highly recommend learning how to read flame-graphics if you don’t know it yet.
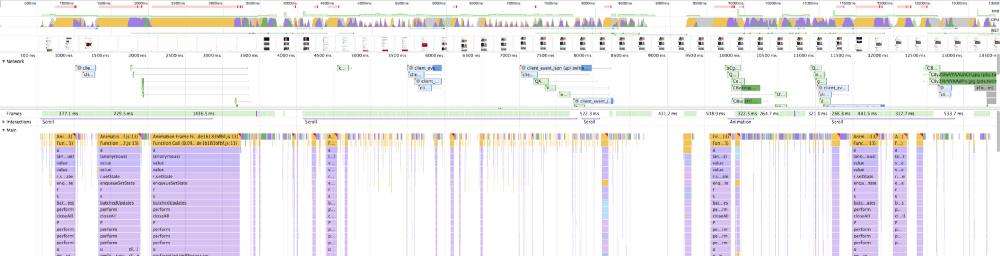
Each section provides examples of screenshots with a record of the timelines from the Chrome Developer Tools. To make the examples clearer, I single out on each pair of screenshots what is bad (above) and what is good (below).
')
Special note about the timelines and flame-graphs. Since we focus on a very large range of mobile devices, we usually record them in an artificial environment: 5 times slower CPU and 3G connection. This is not only more realistic, but the problems are much clearer. The distortion can be aggravated if we use the profile component React v15.4.0 . Real timeline performance on the desktop will be much higher than in our illustrations.
Browser Optimization
Separate code based on routes
Webpack is powerful, but difficult to learn. For a while, we had problems with the CommonsChunkPlugin and how it worked with some of our circular code dependencies. Because of this, we ended up with only three JavaScript resource files with a total size of more than 1 MB (420 KB of gzip in transit).
Downloading one or even several very large JavaScript files needed for work is a huge bottleneck for mobile users, which does not allow you to quickly see and start interacting with the site. With the size of scripts, not only the time of their transmission over the network increases, but also the time of parsing in the browser.
After long disputes, we were finally able to split the CommonsChunk into separate pieces based on the routes (example below). This day came when code analysis fell into our mailboxes:
const plugins = [ // extract vendor and webpack's module manifest new webpack.optimize.CommonsChunkPlugin({ names: [ 'vendor', 'manifest' ], minChunks: Infinity }), // extract common modules from all the chunks (requires no 'name' property) new webpack.optimize.CommonsChunkPlugin({ async: true, children: true, minChunks: 4 }) ]; Use granular code separation based on routes. Faster initial and HomeTimeline rendering is achieved at the cost of increasing the overall size of the application, which is divided into more than 40 pieces and is amortized throughout the session. - Nicholas Gallagher
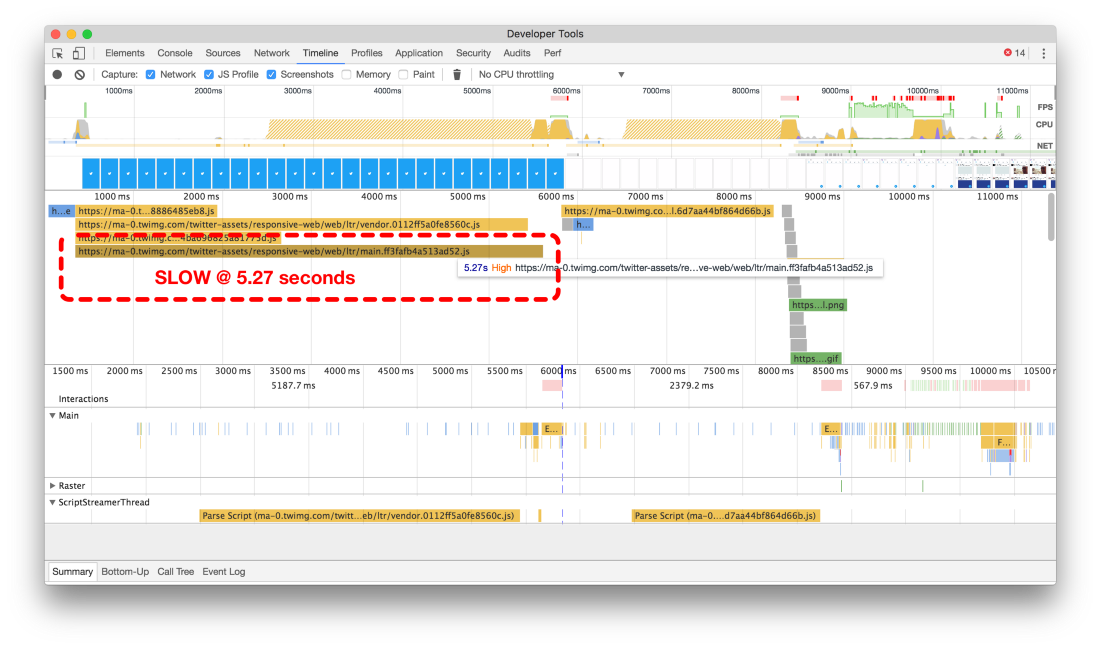
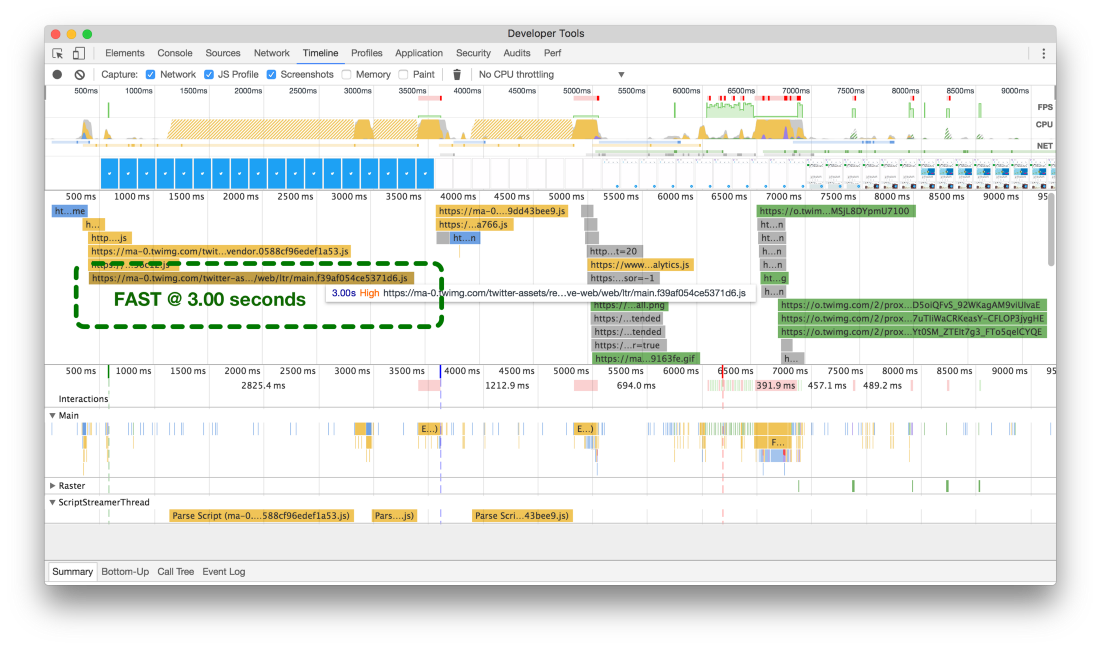
Timelines before (above) and after (below) code separation
Our initial configuration required more than 5 seconds to load the main package, and after splitting into pieces based on routes, the download time barely reaches 3 seconds (in the 3G network simulation).
We made this change at the very beginning of our performance optimization work, but a single change immediately led to a dramatic improvement in the results of the Google Lighthouse web application audit tool:
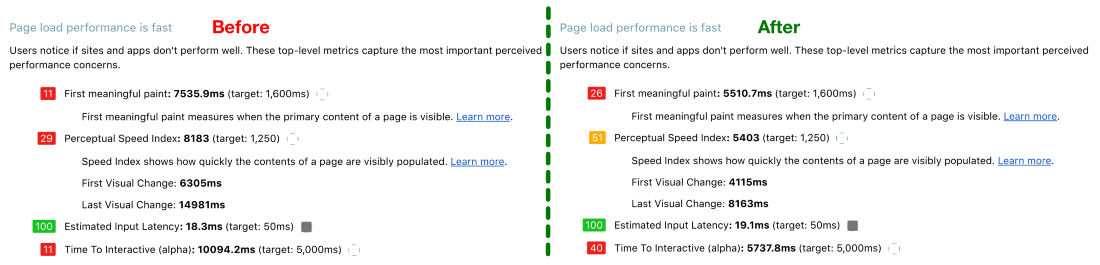
Test results in the Lighthouse site before (left) and after (right) optimization
Avoid functions that create freezes.
For many iterations of the endless scroll timelines, we used different methods to calculate the scroll position and direction — this is needed to decide whether to request an API to load and display additional tweets. Until recently, we used the react-waypoint , which is fine with us. However, it is simply not fast enough to achieve maximum performance of one of the main components.
Waypoints calculate many different indicators for height, width, and position of elements to determine the current scroll position, how far you are from each edge, and in which direction you scroll. All this information is useful, but it is calculated on each scrolling event and therefore costly: these calculations cause slowdowns (jank) - and a lot.
But first you need to understand what the development tools mean when they inform us about slowdowns.
Most modern devices update the screen 60 times per second. If there is an animation or transition effect or the user scrolls the page, then the browser needs to adjust to the refresh rate and output one new picture, or frame, to each of these screen updates.
Each of these frames has a budget of just over 16 ms (1 second / 60 = 16.66 ms). However, in reality, the browser needs to perform auxiliary tasks, so all your work must be within 10 ms. If you do not fit into the budget, the frame rate is reduced, and the content moves in jerks on the screen. This is often referred to as jank, and it adversely affects the user experience. - Paul Lewis in Rendering Performance
Over time, we developed a new component for endless scrolling called VirtualScroller . With this new component, we knew exactly which fragment of the tweet tape was rendered in the timeline at each moment in time, so the need to make resource-intensive visual position calculations disappeared.
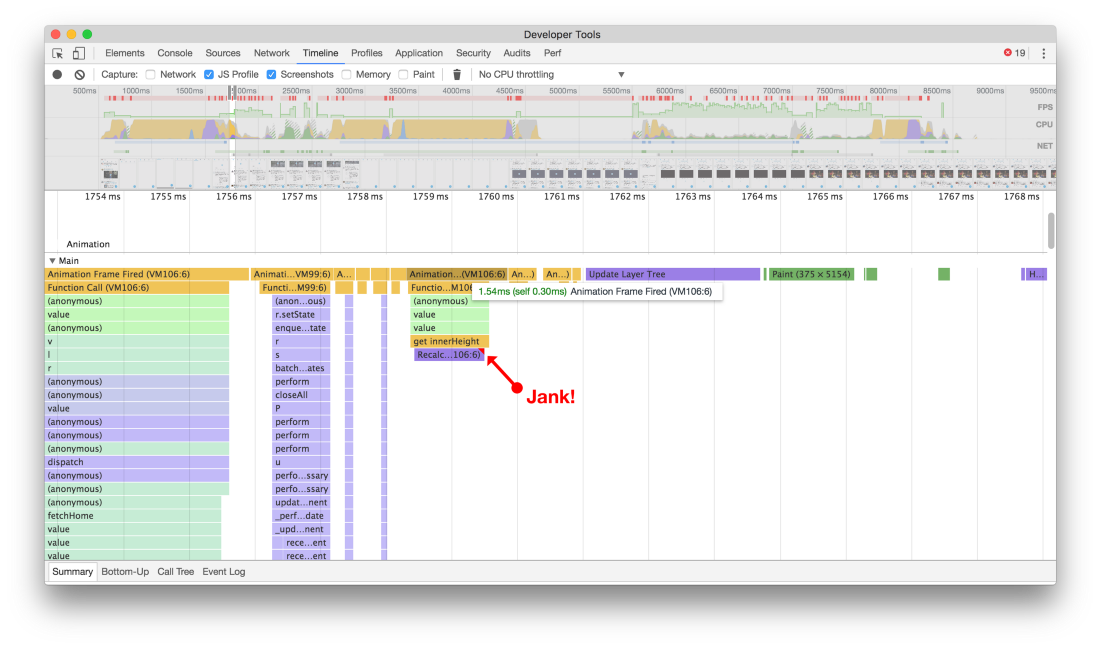
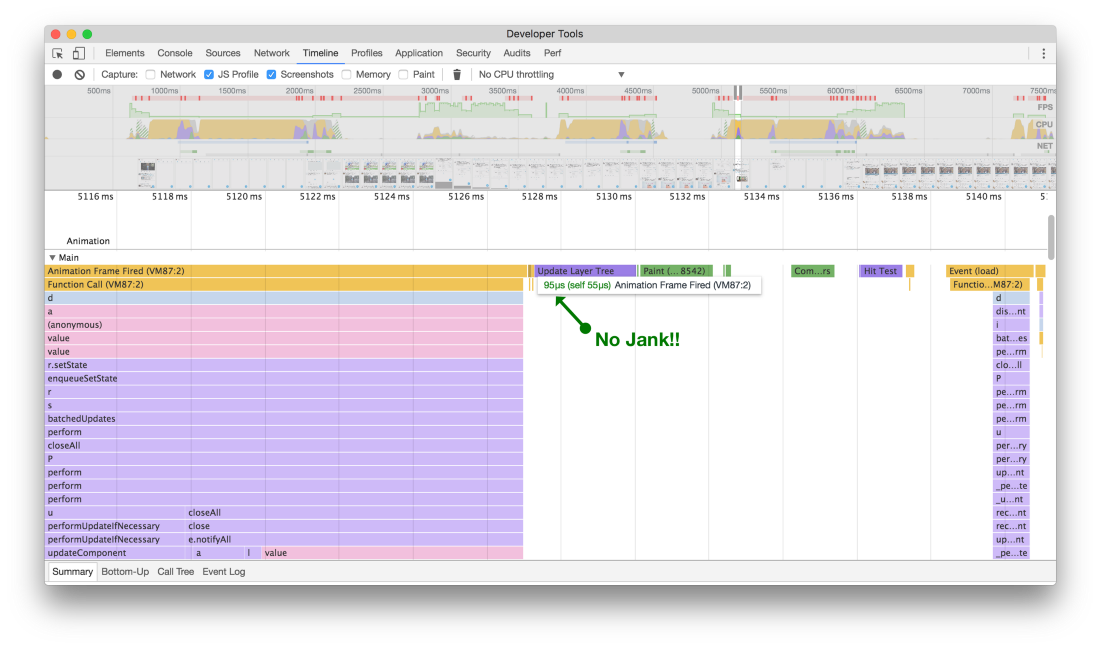
This may not seem very significant, but earlier during scrolling (from the top) there were slowdowns during rendering, because the height of various elements was calculated. Now (from below) there are no content shakes or pauses when scrolling at high speed
After refusing calls, which caused additional slowdowns, now scrolling the tape of tweets looks and feels smooth and seamless, which gives a richer, almost native impression of the application. Although there is always room for optimization, this change has become a noticeable improvement in smoothly scrolling through the tapes. A good reminder that every little thing matters when it comes to performance.
Use smaller pictures
We started optimizing traffic for Twitter Lite by working together with several groups on new smaller pictures that are downloaded from our CDNs . It turned out that with the reduction of images, the application performs only minimal rendering, which is absolutely necessary (both in size and quality), and we not only reduced the traffic, but also increased the browser performance, especially while scrolling the tweets ribbon with a large number of images .
To determine what effect small pictures have on performance, you can look at the Raster timeline in Chrome Developer Tools. Before optimizing the size of images, decoding a single image took 300 ms or more, as shown in the top of the two timelines below. This is the length of time between when the image is downloaded and when it appears on the page.
If you aspire to the standard 60 frames per second while scrolling the page, then you need to squeeze as much processing as possible into 16.667 ms (1 frame). It turns out that rendering one image takes 18 frames, which is too much. As for the tape, the following should be noted: as you can see, the Main timeline is almost completely blocked from continuing to work until the decoding of the image is complete (as shown by the white spaces). This means that we have a bottleneck of performance here!
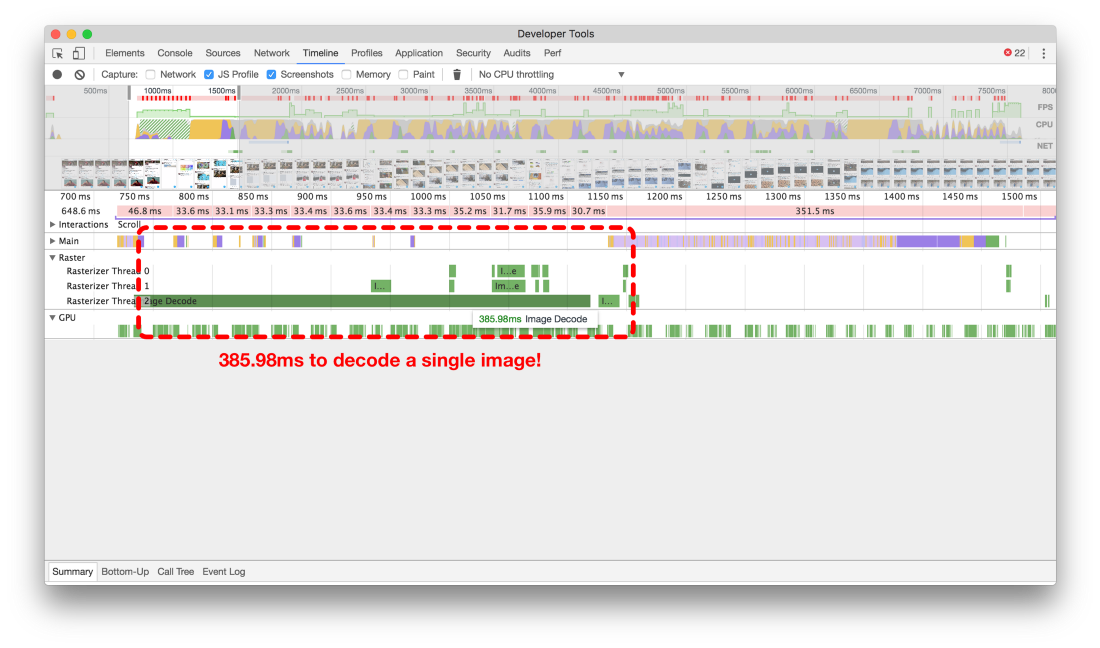
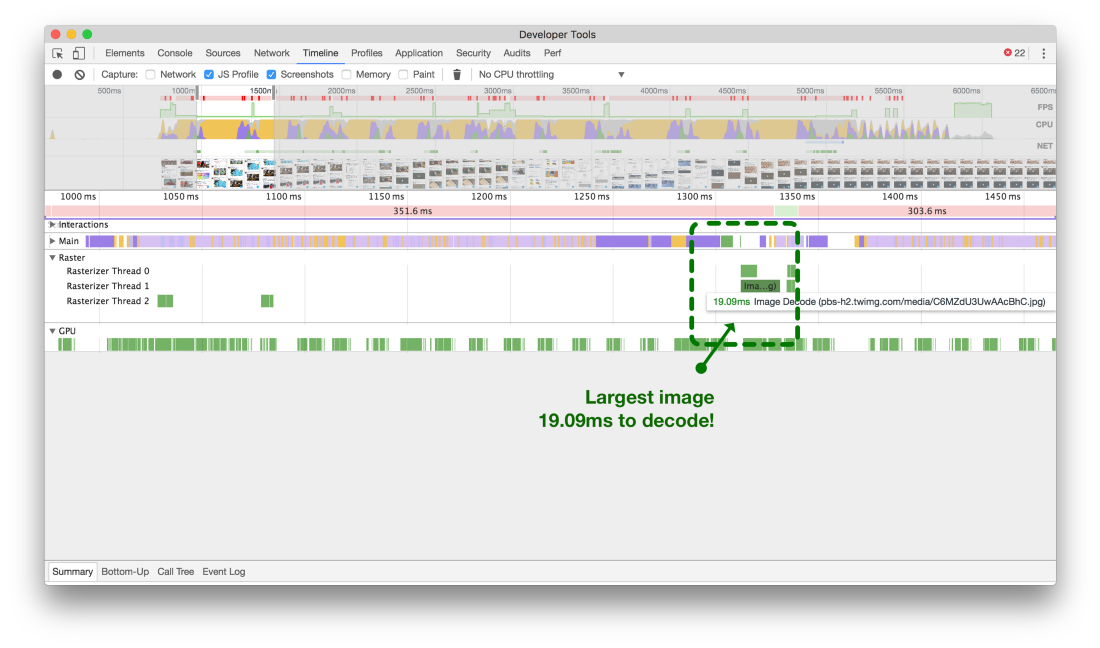
Large images (above) can block the main stream for 18 frames. Small images (bottom) take only 1 frame
Now that we have reduced the size of the images, decoding the largest images requires only a little more than one frame.
React optimization
Use the method shouldComponentUpdate
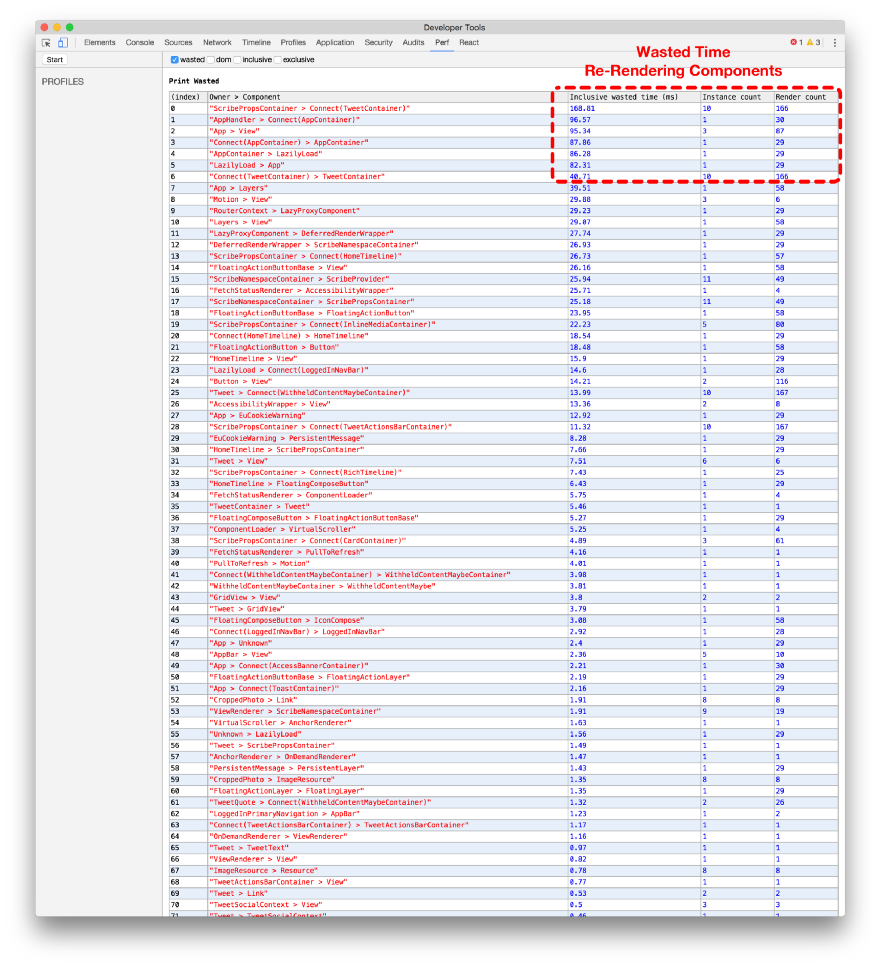
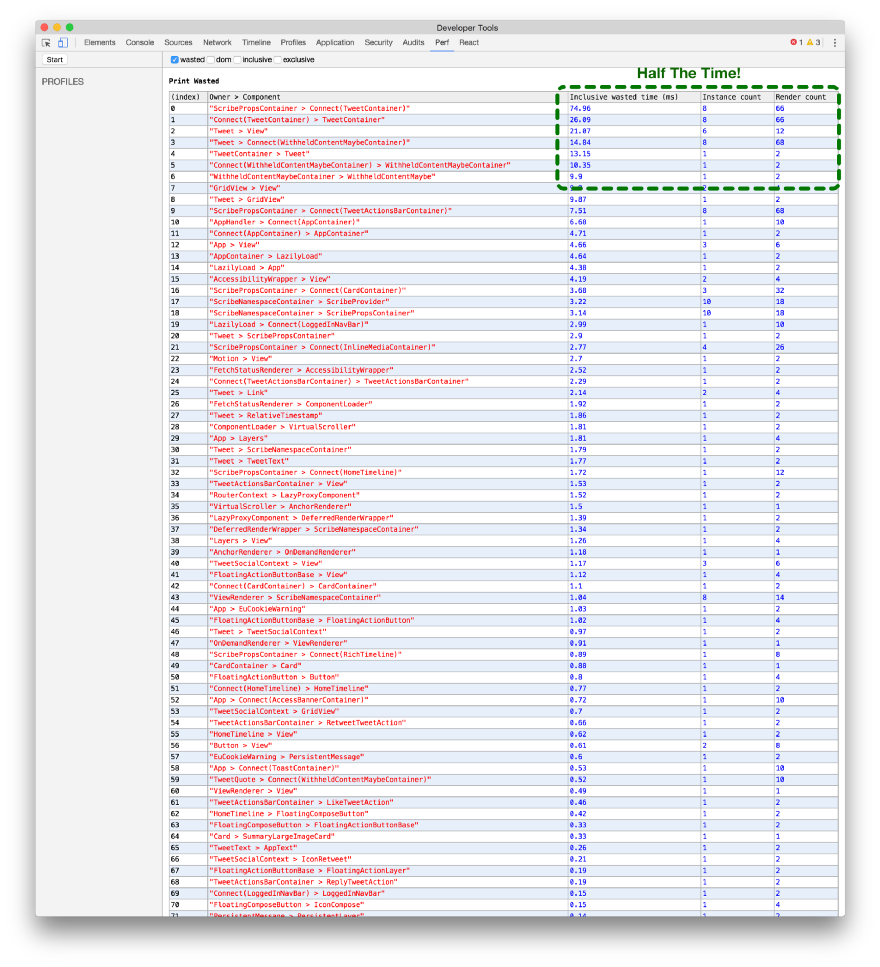
A popular tip for optimizing application performance with React is to use the shouldComponentUpdate method . We tried to do it where possible, and sometimes corrected serious mistakes.

If you like the first tweet, then he and all the discussions below were re-rendered!
An example of a component that is always updated. If you click on the heart icon under tweet to put a like in your feed, then any
Conversation component on the screen will also be rendered again. In the animated example, you can see green rectangles that show where the browser re-fills in color, because we forced the entire Conversation component to re-update from the bottom of the tweet.Below are the two flame graphics of this action. Without
shouldComponentUpdate (above) the entire tree is updated and re-drawn just to change the color of the heart somewhere on the screen. After adding shouldComponentUpdate (below), we prevented the whole tree from being updated and saved a whole 0.1 seconds of unnecessary data processing.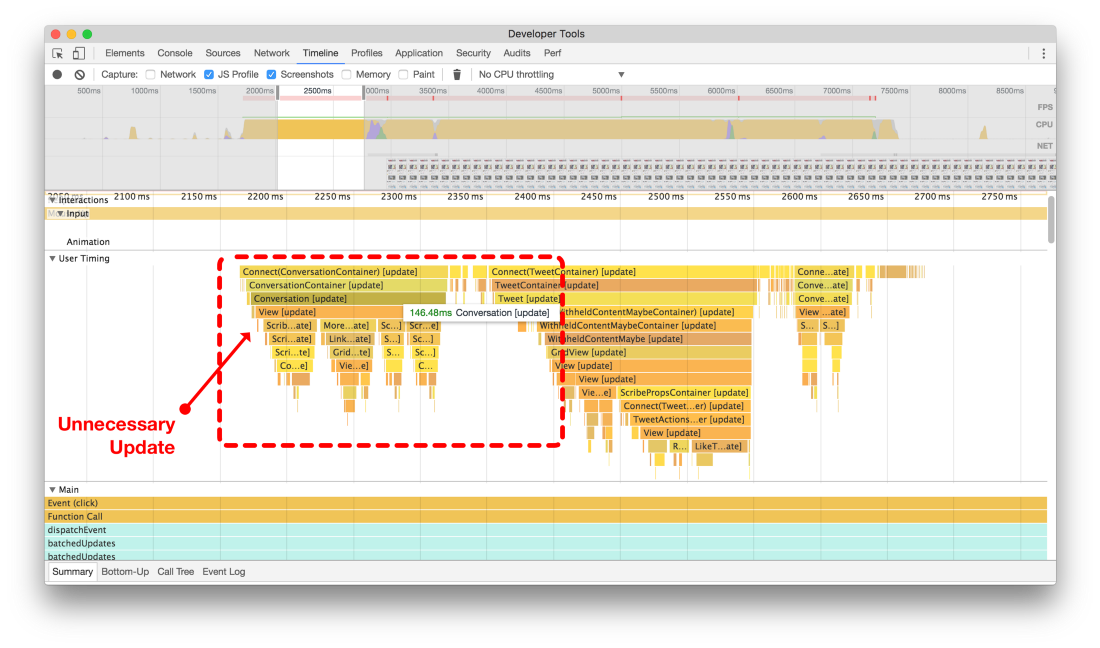
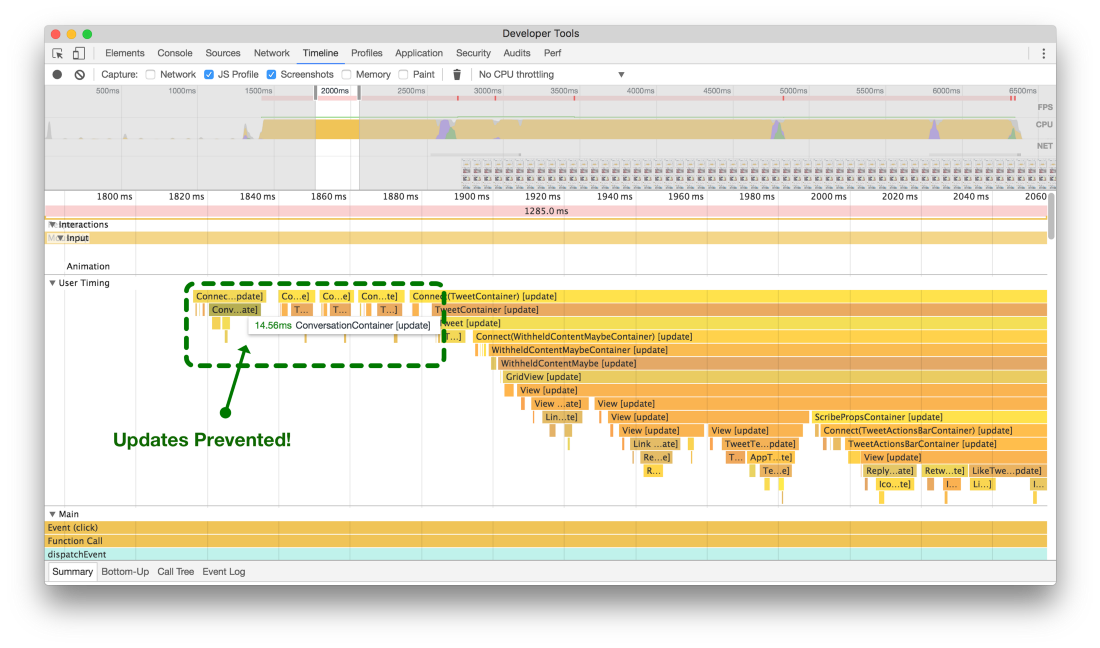
Previously (at the top) when putting a message to an outside tweet, the entire discussion was updated and redrawn. After adding the logic of shouldComponentUpdate (below), the component and the child processes no longer spend the CPU cycles
Transfer unnecessary work to componentDidMount
This change may seem obvious, but it's easy to forget about such small things when developing a large application like Twitter Lite.
We noticed that in many places of the code, resource-intensive computations are performed for the sake of analytics during the execution of the life-cycle method in React, that is, componentWillMount . Each time the components were drawn for a while. 20 ms here, 90 ms there, everything quickly evolved. At first, we tried to record and transmit to the analytics service in the
componentWillMount information which tweets should be rendered, even before the actual rendering begins (the top of two screenshots).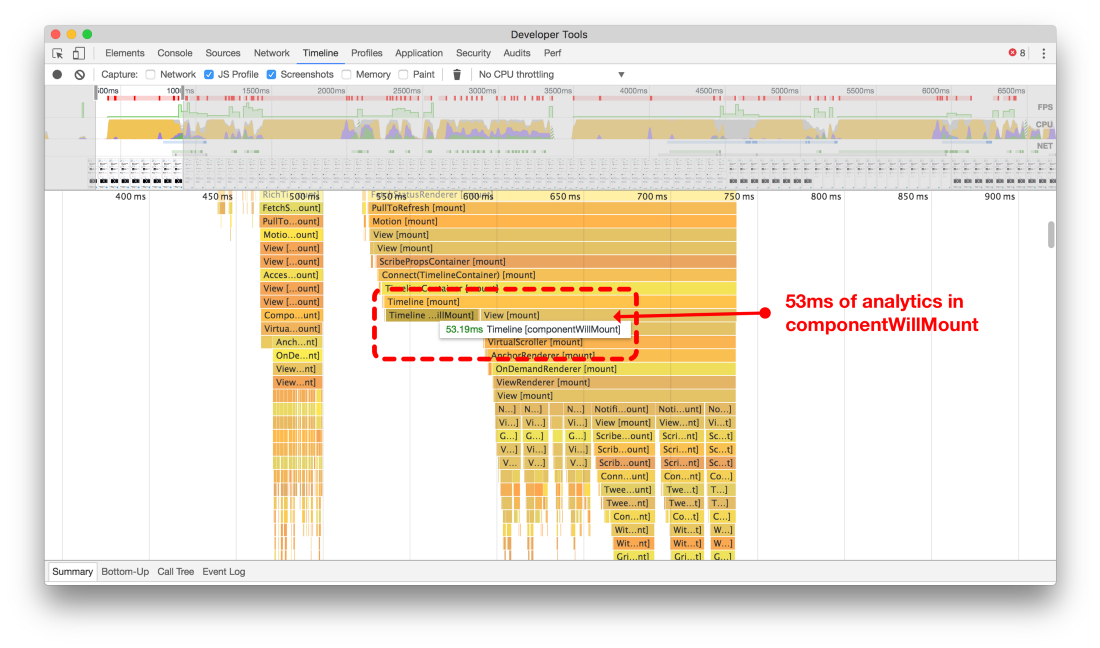
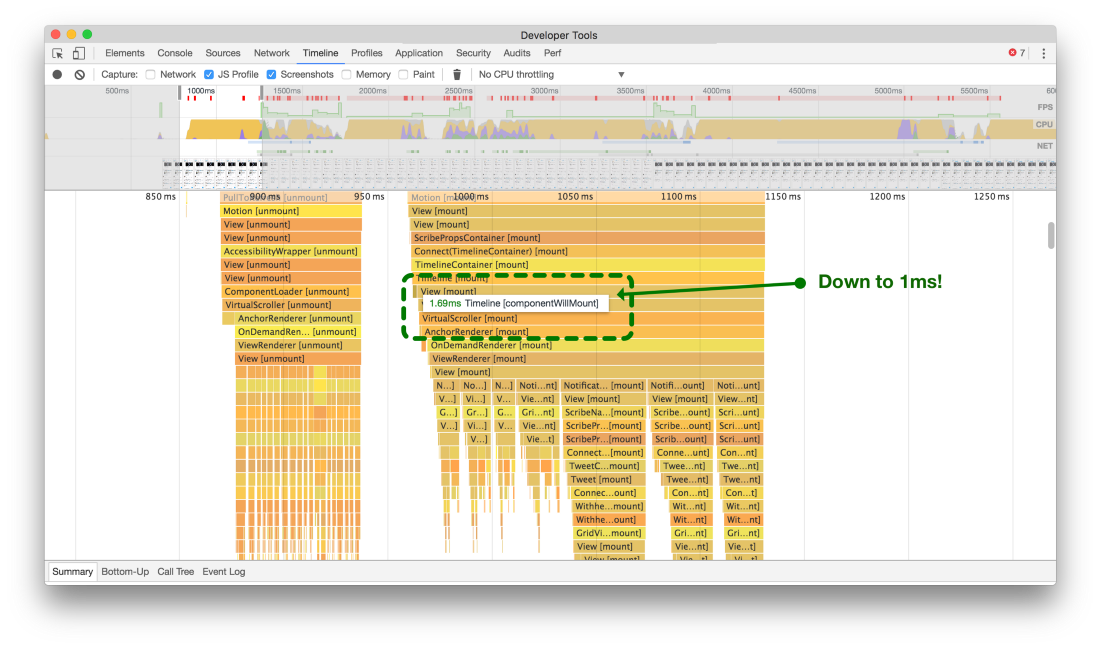
By transferring nonessential parts of the code from `componentWillMount` to` componentDidMount`, we saved a lot of time rendering tweets on the screen.
Transferring these calculations and network calls to the
componentDidMount method of the React component, we unblocked the main thread and reduced the slowdowns while rendering the components (lower timeline).Avoid dangerouslySetInnerHTML
In Twitter Lite, we use SVG icons, as these are the most compact and scalable formats available. Unfortunately, in older versions of React most of the SVG attributes were not supported when creating elements from components. Therefore, when we first started writing the application, we had to use
dangerouslySetInnerHTML to use the SVG icons as components of React.For example, our initial HeartIcon pictogram looked like this:
const HeartIcon = (props) => React.createElement('svg', { ...props, dangerouslySetInnerHTML: { __html: '<g><path d="M38.723 12c-7.187 0-11.16 7.306-11.723 8.131C26.437 19.306 22.504 12 15.277 12 8.791 12 3.533 18.163 3.533 24.647 3.533 39.964 21.891 55.907 27 56c5.109-.093 23.467-16.036 23.467-31.353C50.467 18.163 45.209 12 38.723 12z"></path></g>' }, viewBox: '0 0 54 72' }); The use of
dangerouslySetInnerHTML is discouraged from a security point of view, and it also slows down the mount and render processes.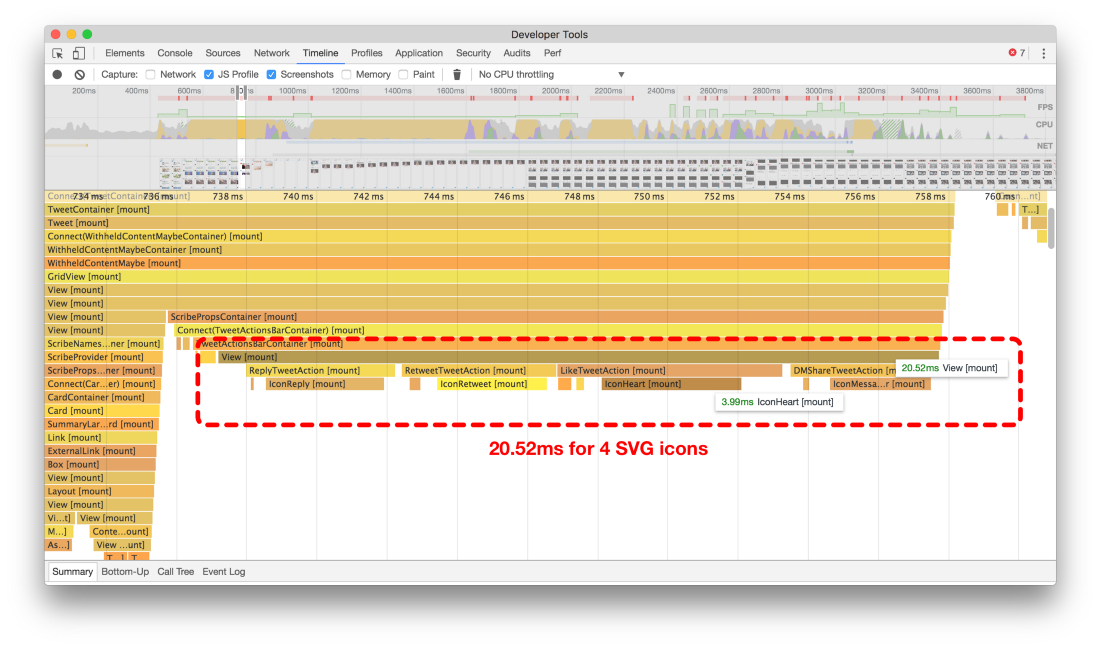
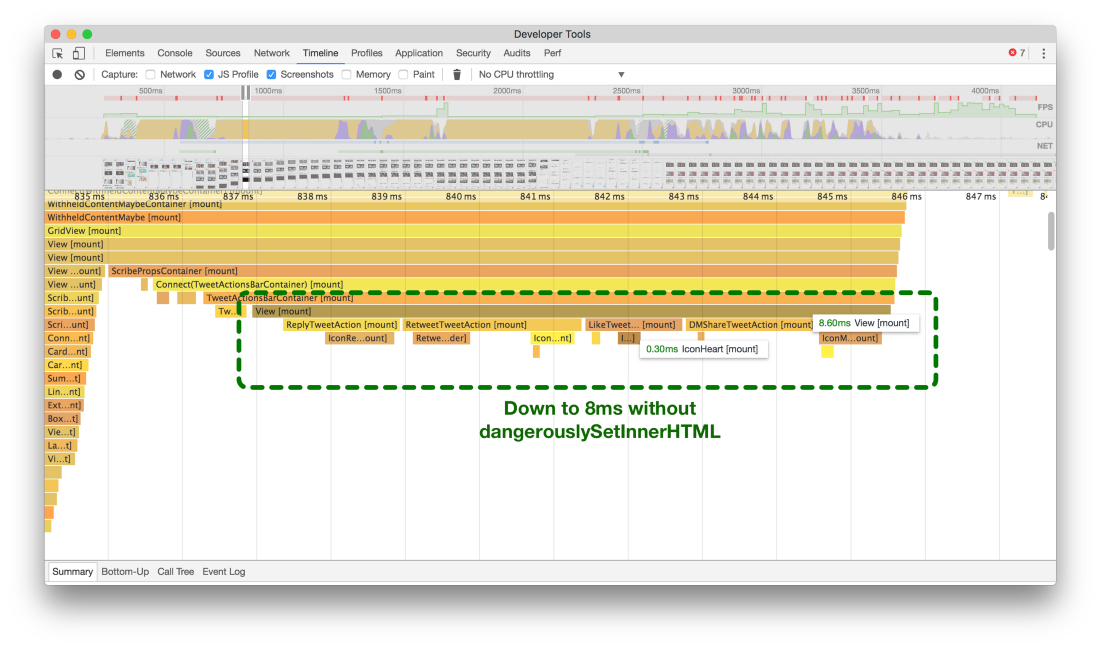
Previously (above) it took about 20 ms to mount four SVG icons, but now (below) it takes about 8 ms
Analysis of the flame graphs shows that in the initial version it took about 20 ms on a slow device to mount four SVG icons at the bottom of each tweet. It seems a little, but such icons are mounted in large numbers while scrolling an endless ribbon of tweets - and we realized that this is a huge loss of time.
When we added support for most of the SVG attributes in React v15, we decided to see what happens if we drop
dangerouslySetInnerHTML . As seen on the second flame-graph (the lower one from the upper pair of graphs), we save an average of 60% every time you need to mount and draw this set of icons!Now our SVG icons are simple, stateless components. They do not use “dangerous” features and are mounted on average 60% faster. They look like this:
const HeartIcon = (props = {}) => ( <svg {...props} viewBox='0 0 ${width} ${height}'> <g><path d='M38.723 12c-7.187 0-11.16 7.306-11.723 8.131C26.437 19.306 22.504 12 15.277 12 8.791 12 3.533 18.163 3.533 24.647 3.533 39.964 21.891 55.907 27 56c5.109-.093 23.467-16.036 23.467-31.353C50.467 18.163 45.209 12 38.723 12z'></path></g> </svg> ); Postpone rendering while mounting and unmounting a large number of components
On slower devices, we noticed that our main navigation panel did not immediately appear in response to a click, which often leads to repeated clicks - the user thinks that the first click did not lock.
Notice the animation below, that the Home icon takes about two seconds to refresh and show that you clicked on it:

Without deferred rendering, the navigation panel does not respond immediately.
No, this is not a GIF animation delay. The update is really so slow. But after all, all the data for the Home screen has already been loaded, so why are they not displayed for such a long time?
It turned out that assembling and unmounting the component trees (like tweeting tapes) in React takes a lot of resources.
We wanted to at least eliminate the impression that the navigation bar does not respond to user pressure. To do this, create a small component of a higher order:
import hoistStatics from 'hoist-non-react-statics'; import React from 'react'; /** * Allows two animation frames to complete to allow other components to update * and re-render before mounting and rendering an expensive `WrappedComponent`. */ export default function deferComponentRender(WrappedComponent) { class DeferredRenderWrapper extends React.Component { constructor(props, context) { super(props, context); this.state = { shouldRender: false }; } componentDidMount() { window.requestAnimationFrame(() => { window.requestAnimationFrame(() => this.setState({ shouldRender: true })); }); } render() { return this.state.shouldRender ? <WrappedComponent {...this.props} /> : null; } } return hoistStatics(DeferredRenderWrapper, WrappedComponent); } Our component HigherOrderComponent, written by Katie SievertAfter applying it to HomeTimeline, the response of the navigation bar became almost instantaneous, which led to an apparent overall acceleration.
const DeferredTimeline = deferComponentRender(HomeTimeline);
render(<DeferredTimeline />);
With deferred rendering, the navigation bar reacts instantly
Redux Optimization
Avoid Staying Too Frequently.
Although it seems to be recommended to use monitored components , but if you control the data entry, you will have to re-render for each keystroke.
On a desktop computer with a 3 GHz processor, this is not noticeable, but small mobile devices with very limited CPU resources will experience a significant delay between clicks, especially when a large number of characters are removed from the field.
To preserve the convenience of composing tweets, as well as leaving the counter for the number of characters, we used a monitored component, and also passed the current value of the input field to our Redux state for each keystroke.
At the top of the pair of screenshots - a typical device for Android 5, where each press leads to a change, which takes approximately 200 ms of extra time. If a person really quickly types the text, we will get a very bad state, when the user complains that the cursor randomly moves around the form, confusing sentences.
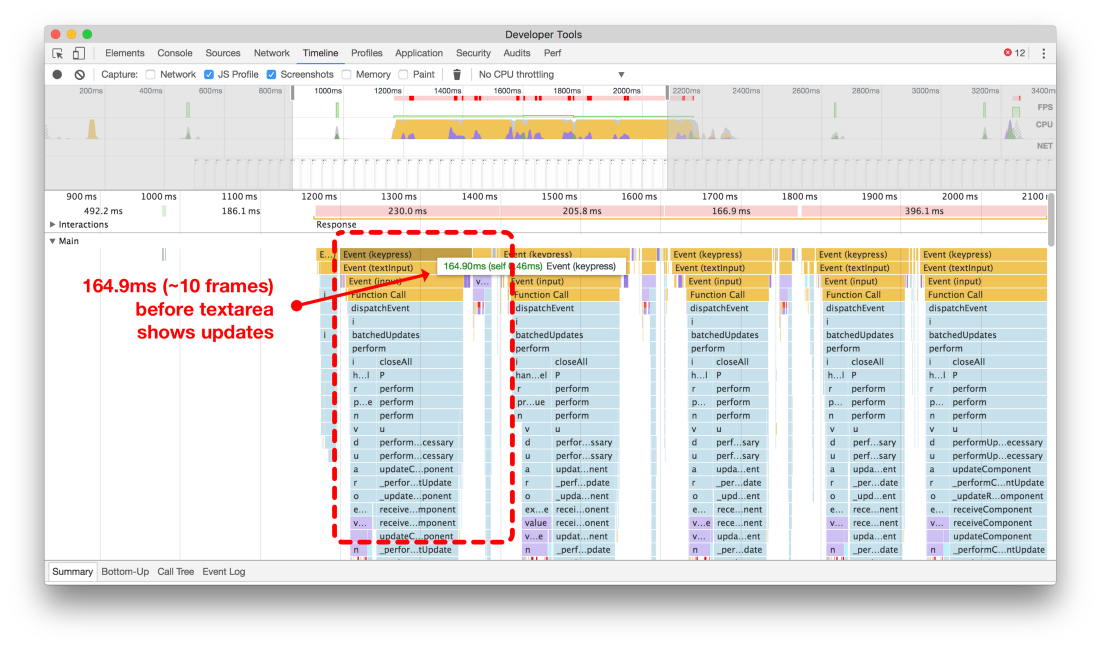
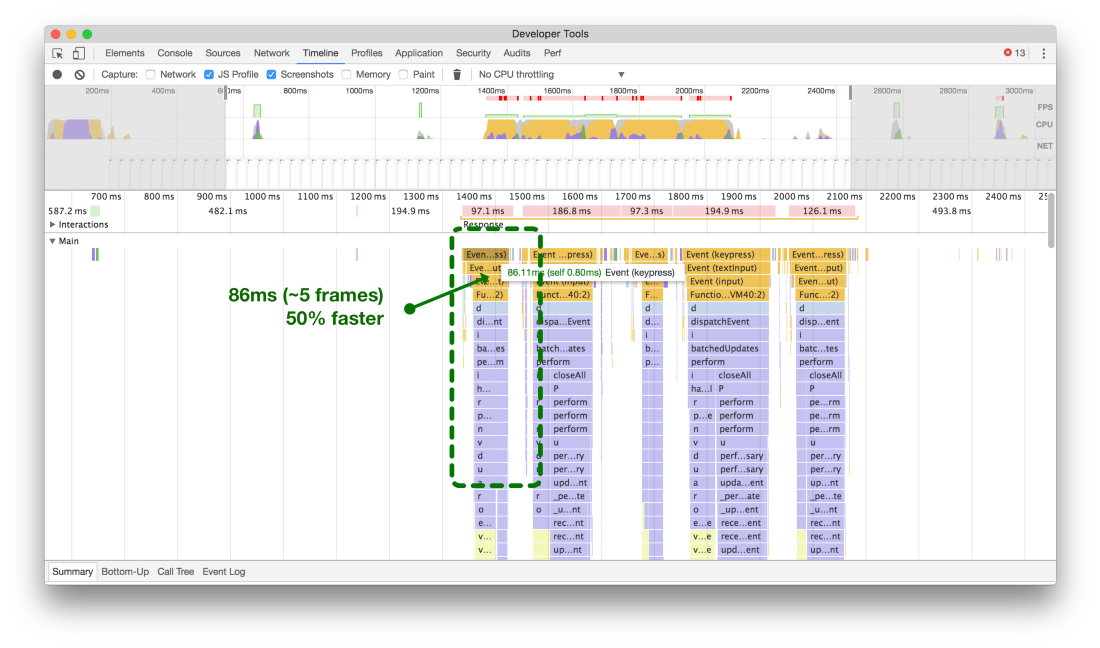
Comparison of the time it takes to update after each key press before the status is sent to Redux and after optimization
We accelerated the execution time by 50% when we banned the state of a draft tweet from updating the main Redux state, and instead saving it locally in the state of the React component.
Group actions into single distribution packages
In Twitter Lite, we use redux and react-redux to assign components to state data changes. We optimized our data on different areas of large storage using Normalizr and combineReducers . This all worked fine, preventing data duplication and keeping the storage size small. However, each time we received new data, we had to send numerous actions to add them to the appropriate repositories.
Considering the react-redux mechanism of operation, this meant that every action after sending resulted in a re-computation of changes and a possible re-rendering of related components (called containers).
Although we use specially developed middleware, there are other middleware available for batch work. Use the appropriate or write your own module.
The best way to demonstrate the benefits of batch processing is to use the Chrome React Perf Extension . After preloading, we perform proactive caching and calculate unread private messages in the background. At this time we add many different objects (conversations, users, message recordings, etc.). Without batch processing (the top of a couple of screenshots), each component is rendered twice as often (about 16 times) than with batch processing (about 8 times).
Comparison of the work of the React Perf extension for Chrome without batch processing in Redux (above) and with packages (below)
Service workers
Although service workers are not yet available in all browsers, they are an invaluable part of Twitter Lite. If possible, we use them for push notifications, pre-caching of resources, and more. Unfortunately, for a fairly new technology, there are many issues with performance.
Resource Pre-Caching
Like most products, Twitter Lite is far from perfect. We are still actively developing it, adding features, fixing bugs, making it faster. This means that you often need to post new versions of our JavaScript resources.
There may be an unpleasant situation if the user opens the application - and he needs to re-download a bunch of script files in order to just watch one tweet.
In browsers with support for service workers, we have a useful opportunity to automatically update, download and cache any modified files in the background. This happens by itself, before the application opens.
What does this mean for the user? Almost instant subsequent download of the program, even if we rolled out a new version!

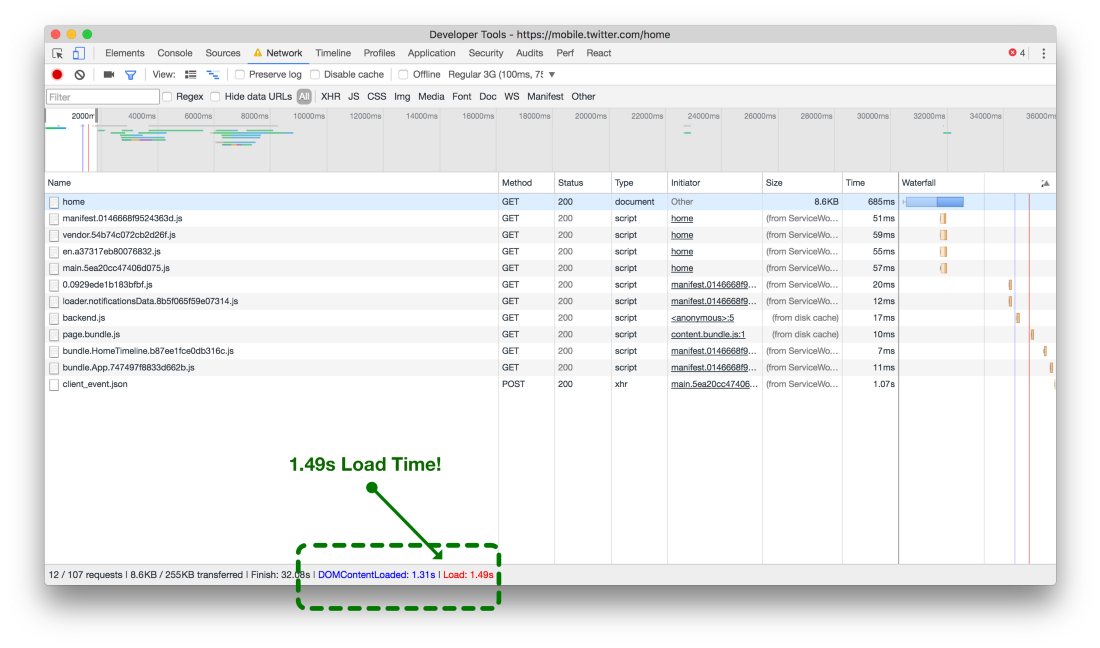
Download time of network resources without service workers (above) and with service workers (below)
In the illustration above without service workers, each resource for the current viewing window should be downloaded from the network when the application opens. On a good 3G network it takes about 6 seconds. But if the resources are pre-cached by service workers (bottom screenshot), then on the same 3G connection the same page finishes downloading in 1.5 seconds. Acceleration by 75%!
Delay registration service worker
In many applications it is safer to register a service worker immediately when the page loads:
<script>
window.navigator.serviceWorker.register('/sw.js');
</script>
Although we are trying to send the browser as much data as possible to render the finished page, this is not always possible on Twitter Lite. It happens that we have sent insufficient data or this page does not support the preliminary reception of data from the server. Because of these and various other limitations, we have to make some API requests immediately after the page is initially loaded.
This is usually not a problem. But if the browser has not yet installed the current version of our service worker, then you need to inform it about the need for installation - and this leads to about 50 requests with preliminary caching of various JS, CSS, and image resources.
When we used a simple approach with the immediate registration of our service worker, we observed a network jams in the browser, reaching the maximum limit on the number of allowed parallel requests (the top of a couple of screenshots).
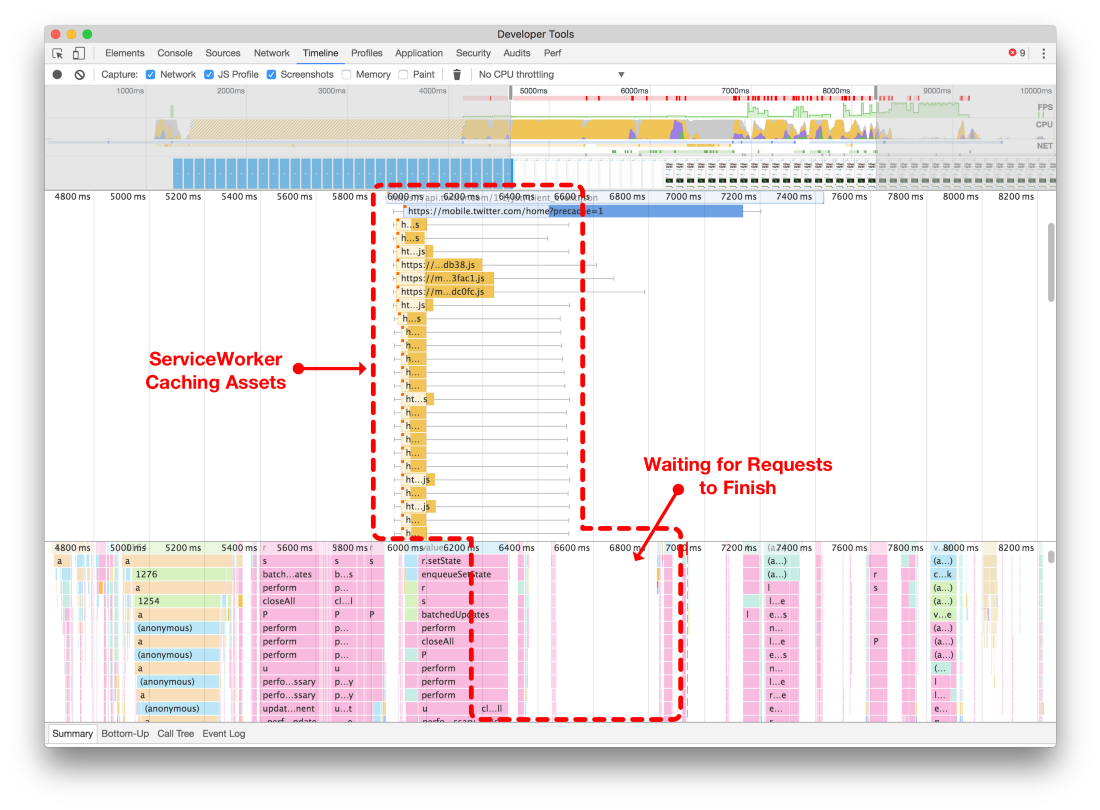
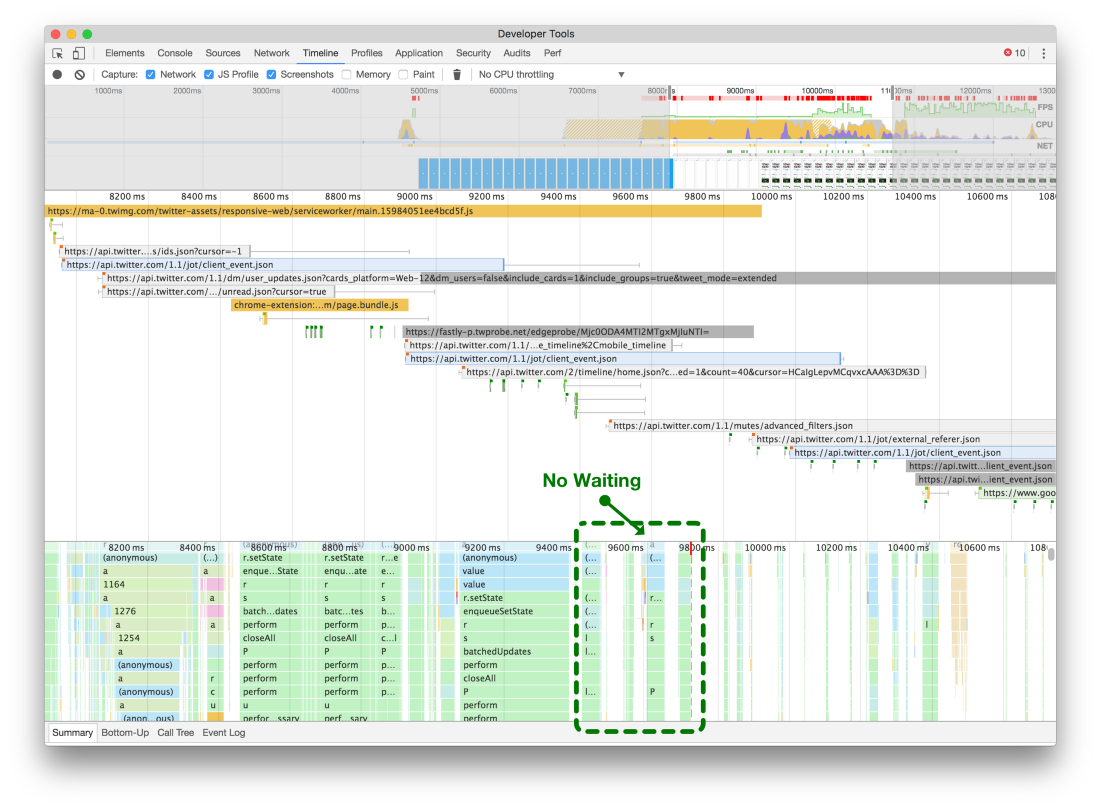
Please note that with the immediate registration of the service worker, he can block all other network requests (above). If you postpone it (below), the page can load and make the necessary network requests without being blocked because of the limit on the number of simultaneous connections in the browser
We delayed the registration of the service worker until the end of the execution of additional API requests, loading CSS resources and images. This allowed us to finish the page rendering and reduce the response time, as shown in the screenshot below.
In general, only a few of the many improvements that we have made in Twitter Lite over time are listed here . Certainly, there will be other improvements, and we hope that we will continue to talk about the problems found and how to solve them. For real-time information and new insights about React and PWA, follow me and the development team on Twitter.
Source: https://habr.com/ru/post/327494/
All Articles