Sports data analysis, or how to become a data science specialist
My name is Peter Romov, I am a data scientist at Yandex Data Factory. In this post I will offer a relatively simple and reliable way to start a data analyst career.
Many of you probably know or at least heard about Kaggle . For those who have not heard: Kaggle is the platform on which companies hold contests to create predictive models. Its popularity is so great that experts often understand the contests themselves as “Cags”. The winner of each competition is determined automatically by the metric that the organizer has appointed. Among others, Kaggle at various times tried Facebook, Microsoft and the current site owner , Google. Yandex also noted several times. As a rule, the Kaggle community is given to solve problems that are quite close to real: this, on the one hand, makes the competition interesting, and on the other, it promotes the company as an employer with solid tasks. However, if you are told that the company-organizer of the competition involved in its service the algorithm of one of the winners - do not believe it. Usually, solutions from the top are too complex and insufficiently productive, while chasing, in thousandths, the values of the metrics are not so necessary in practice. Therefore, the organizers are more interested in the approaches and the ideological part of the algorithms.
')
Kaggle is not the only platform for data analysis competitions. There are others: DrivenData , DataScience.net , CodaLab . In addition, competitions are held in the framework of scientific conferences related to machine learning: SIGKDD, RecSys, CIKM.
For a successful solution, it is necessary, on the one hand, to study the theory, and on the other hand, to start practicing the use of various approaches and models. In other words, participation in “logs” is quite capable of making you data analytics. The question is - how to learn to participate in them?
Three years ago, several ShAD students began to gather and solve various interesting tasks, including those taken from Kaggle. For example, among these guys was the current winner of the second place and the recent leader of the Kaggle rating, Stanislav Semyonov. Over time, the meetings received the name of machine-training sessions. They gained popularity, the participants began to regularly take prizes and tell each other about their decisions, share experiences.
To understand exactly what we do in training, I will give a few examples. In each example, first there is a video with a story, and then a text based on the video.
Link to MachineLearning.ru.
Last year, Avito held a series of contests. Including - a car brand recognition contest, the winner of which, Yevgeny Nizhibitsky, told about his decision at the training.
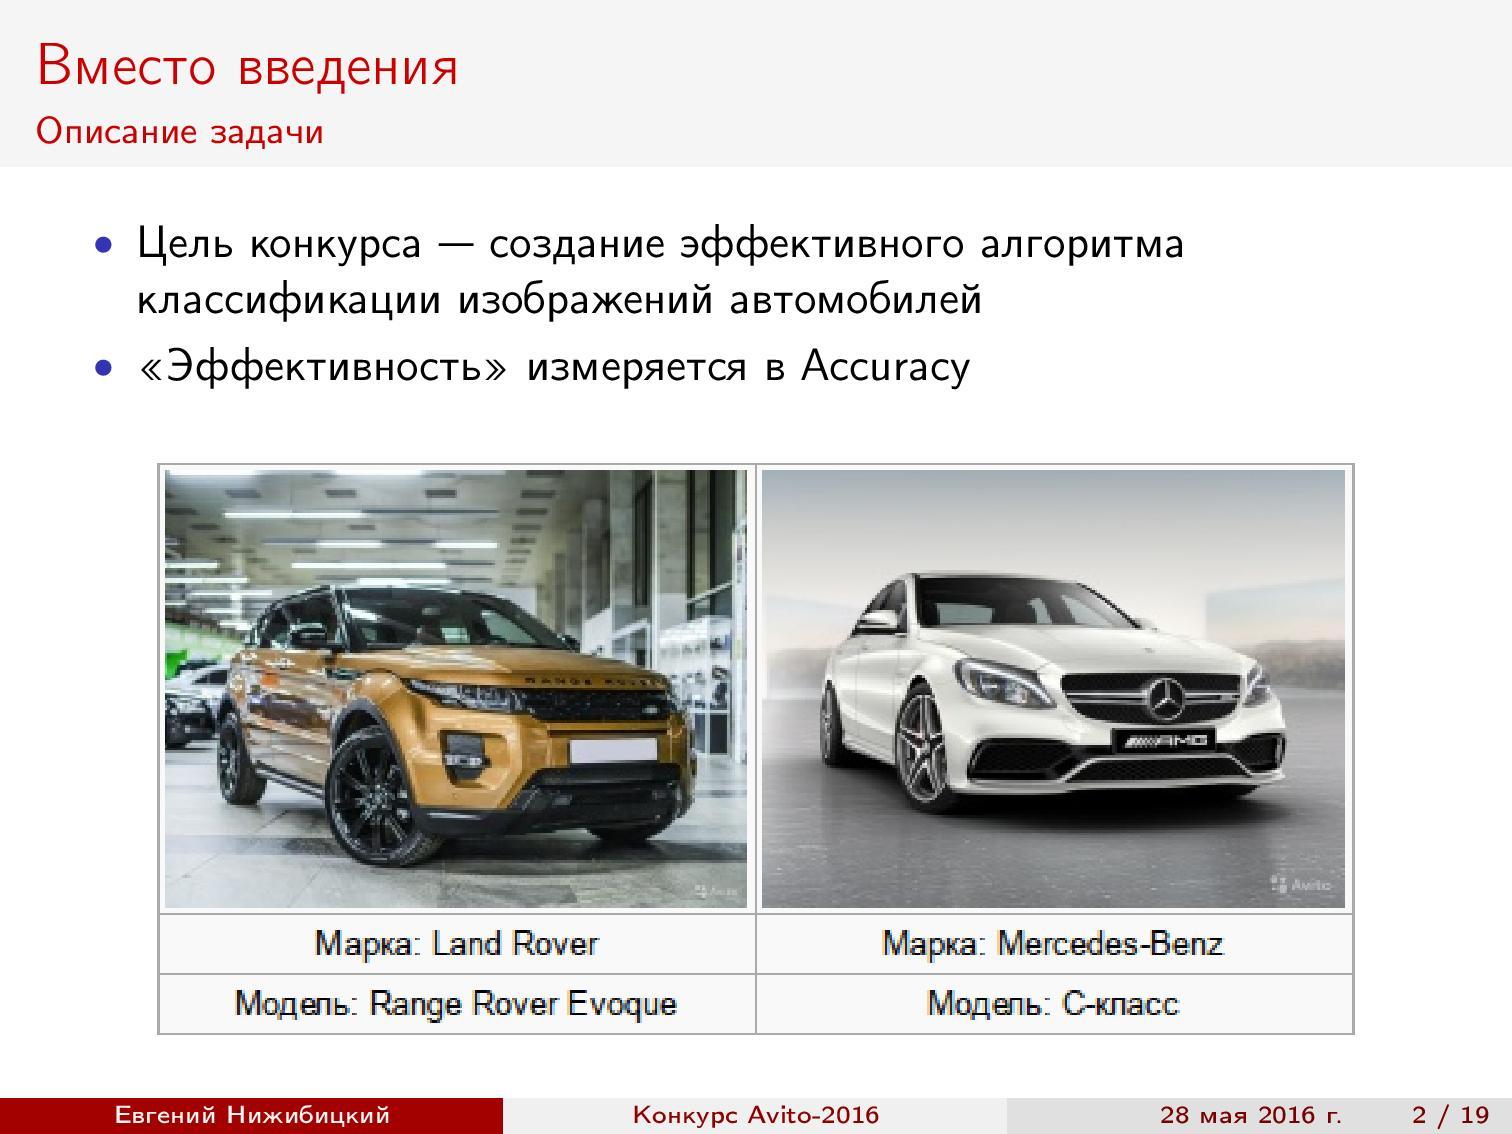
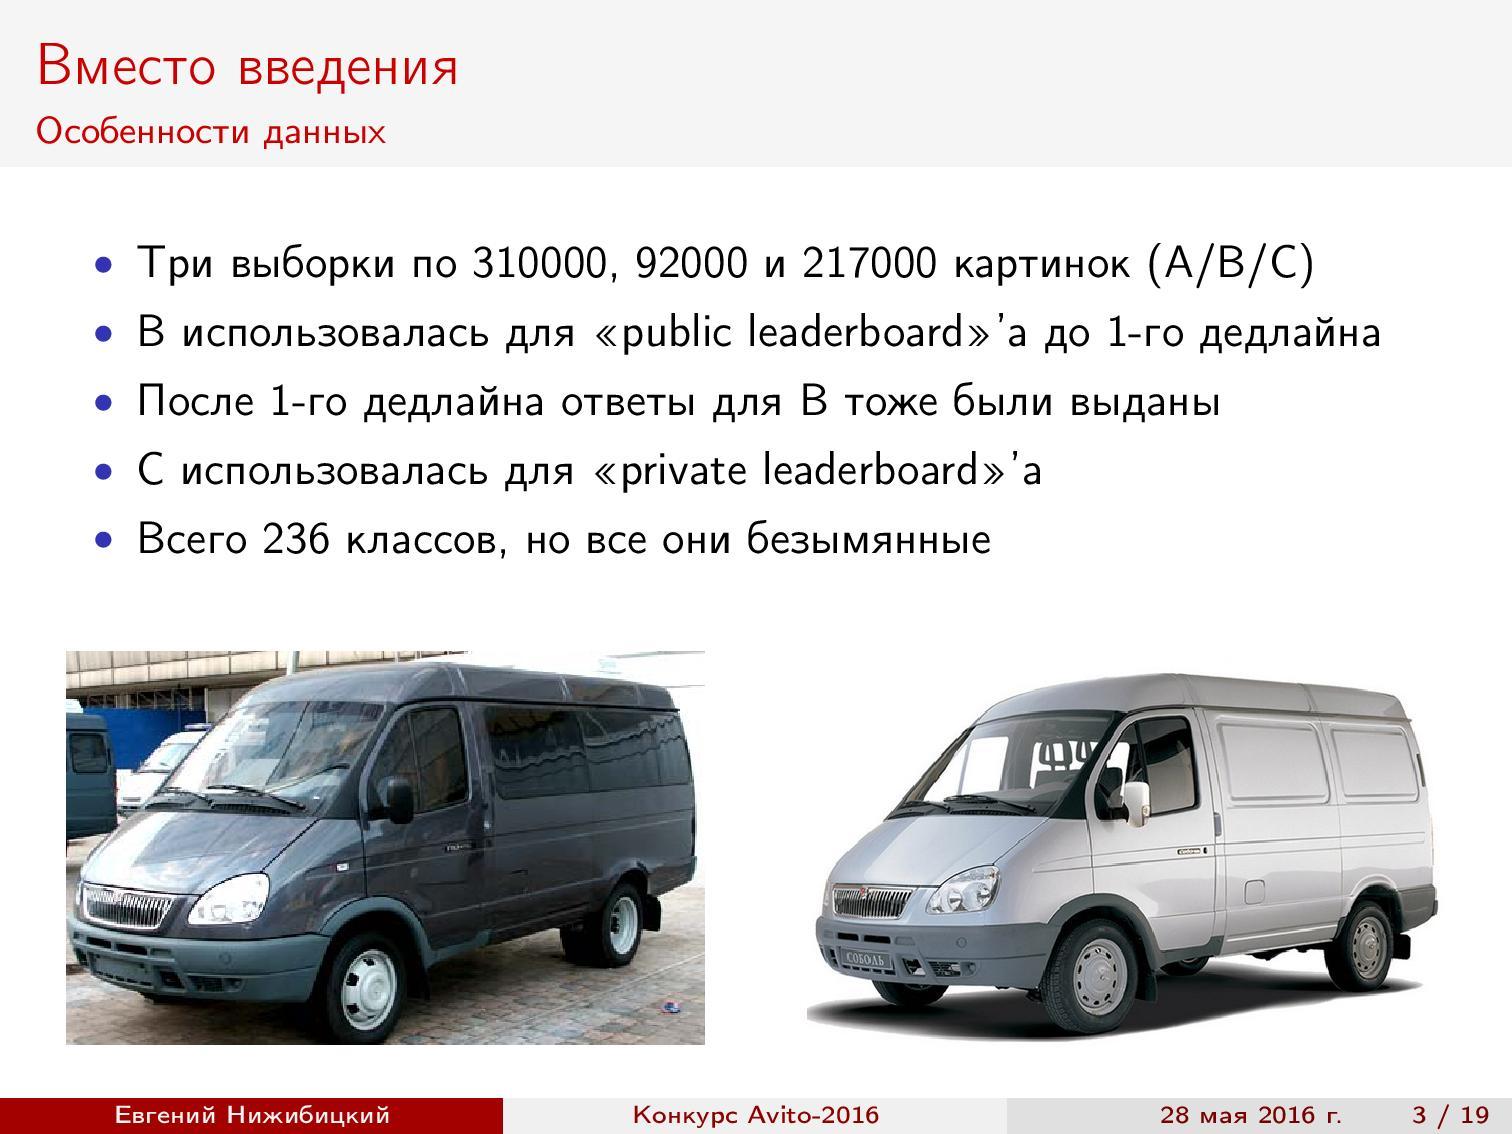
Task setting . It is necessary to determine the make and model of the car images. The metric was the accuracy of predictions, that is, the proportion of correct answers. The sample consisted of three parts: the first part was available for training initially, the second was given later, and the third was required to show the final predictions.
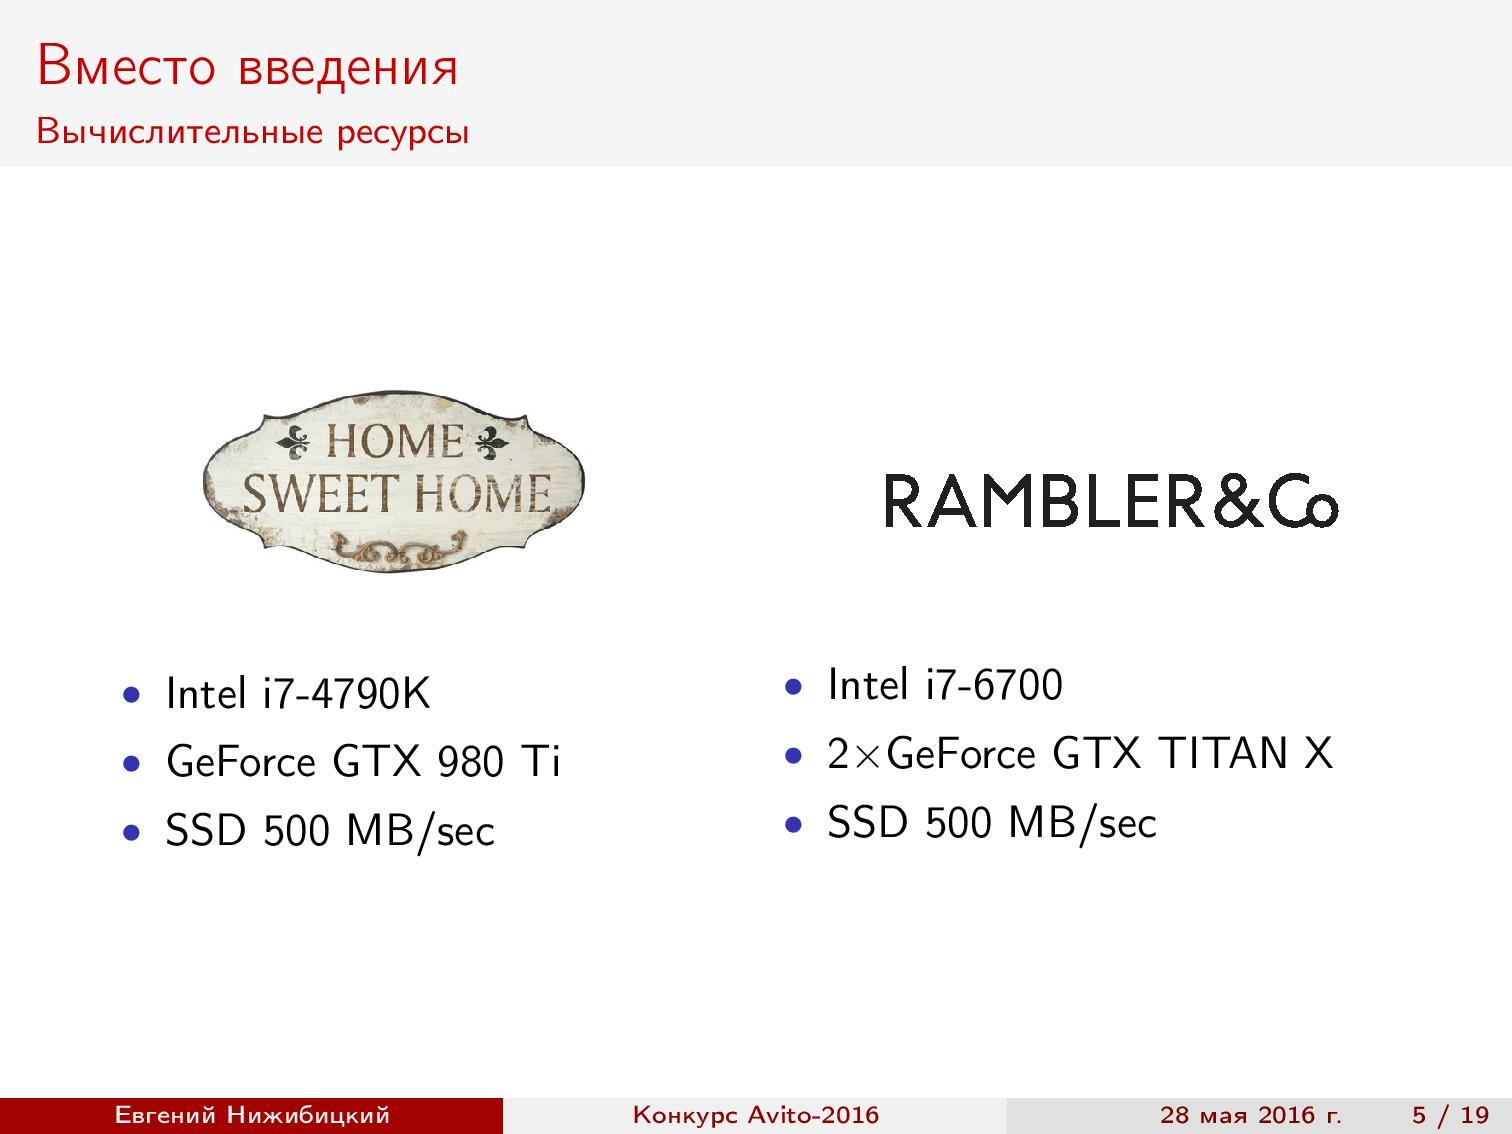
Computational resources . I used my home computer, which had been heating my room all this time, and the servers provided at work.
Review of models . Since our task is to recognize, the first thing I want is to take advantage of the progress in the quality of image classification on the well-known ImageNet . As is known, modern architectures make it possible to achieve even higher quality than that of humans. Therefore, I began with a review of recent articles and collected a summary table of architectures, implementations and qualities based on ImageNet.
Note that the best quality is achieved on the Inception and ResNet architectures .
Fine-tuning networks . Teaching a deep neural network from scratch is quite a time-consuming exercise, and, moreover, is not always effective in terms of results. Therefore, the advanced training of networks is often used: the network already trained on ImageNet is taken, the last layer is replaced with a layer with the required number of classes, and then the network is set up with a low learning rate, but with data from the competition. This scheme allows you to train the network faster and with higher quality.
The first approach to additional training GoogLeNet showed approximately 92% accuracy during validation.
Crop prediction . Using the neural network to predict on a test sample, you can improve the quality. To do this, cut out fragments of a suitable size in different places of the original image, and then average the results. Crop 1x10 means that the center of the image is taken, four corners, and then everything is the same, but reflected horizontally. As you can see, the quality increases, but the prediction time increases.
Validation of results . After the issuance of the second part of the sample, I divided the sample into several parts. All further results are shown on this partition.

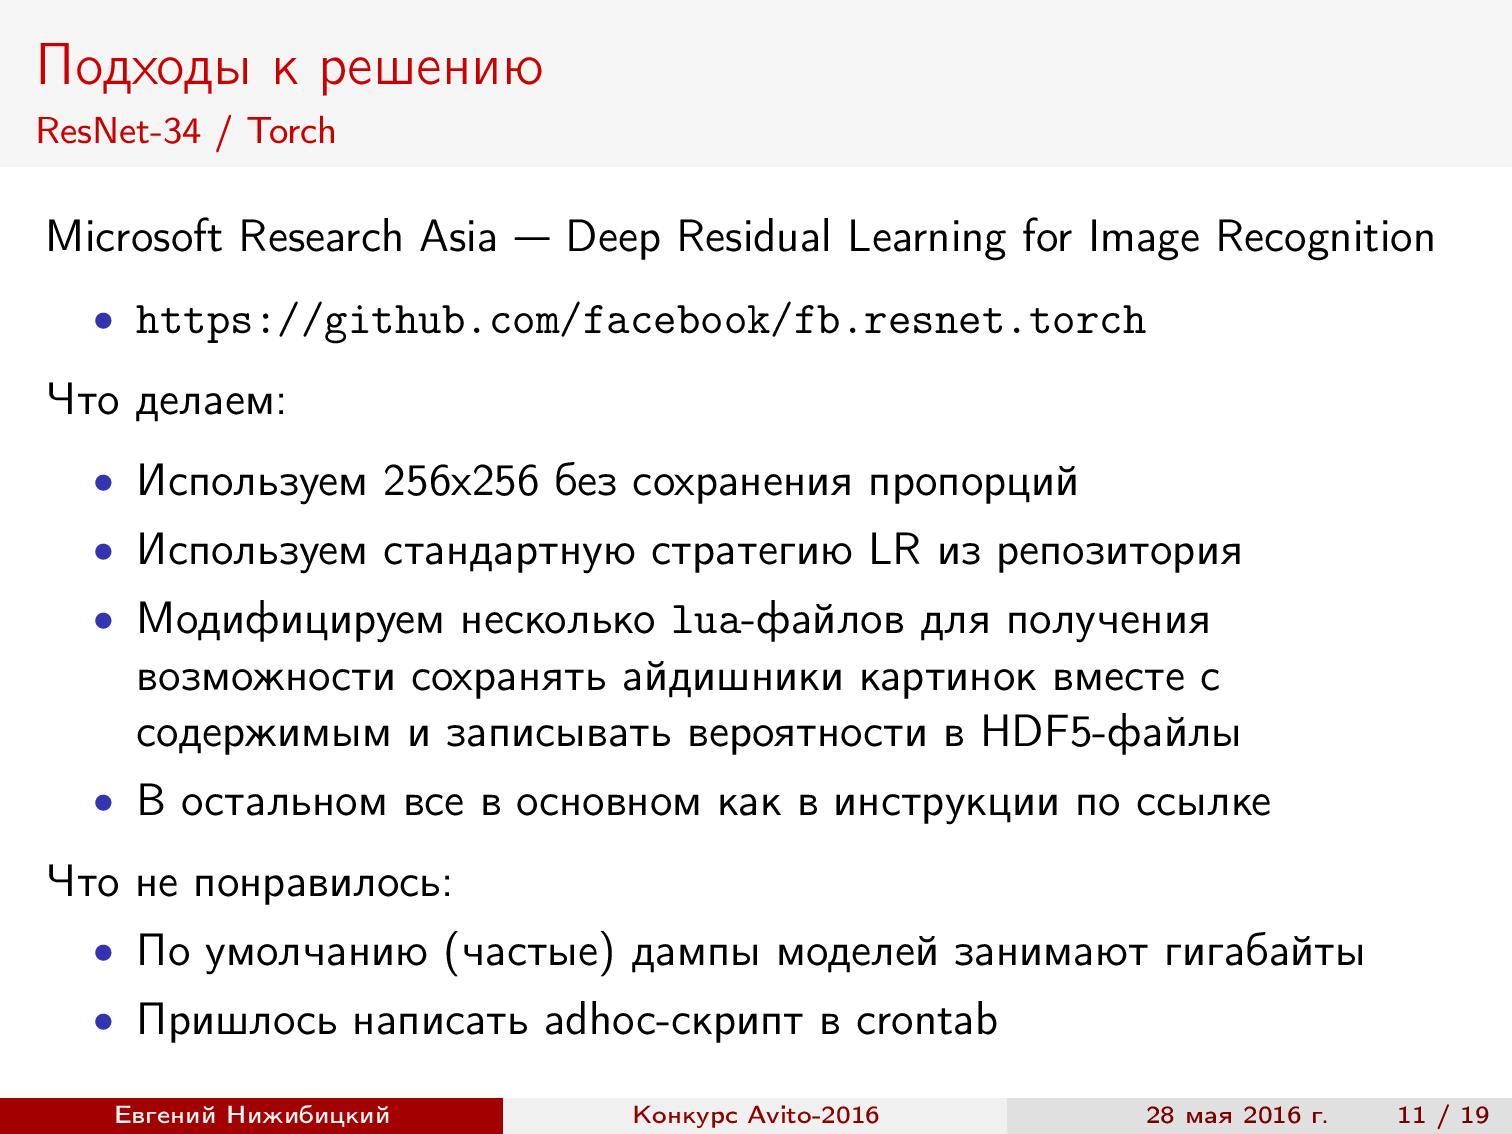
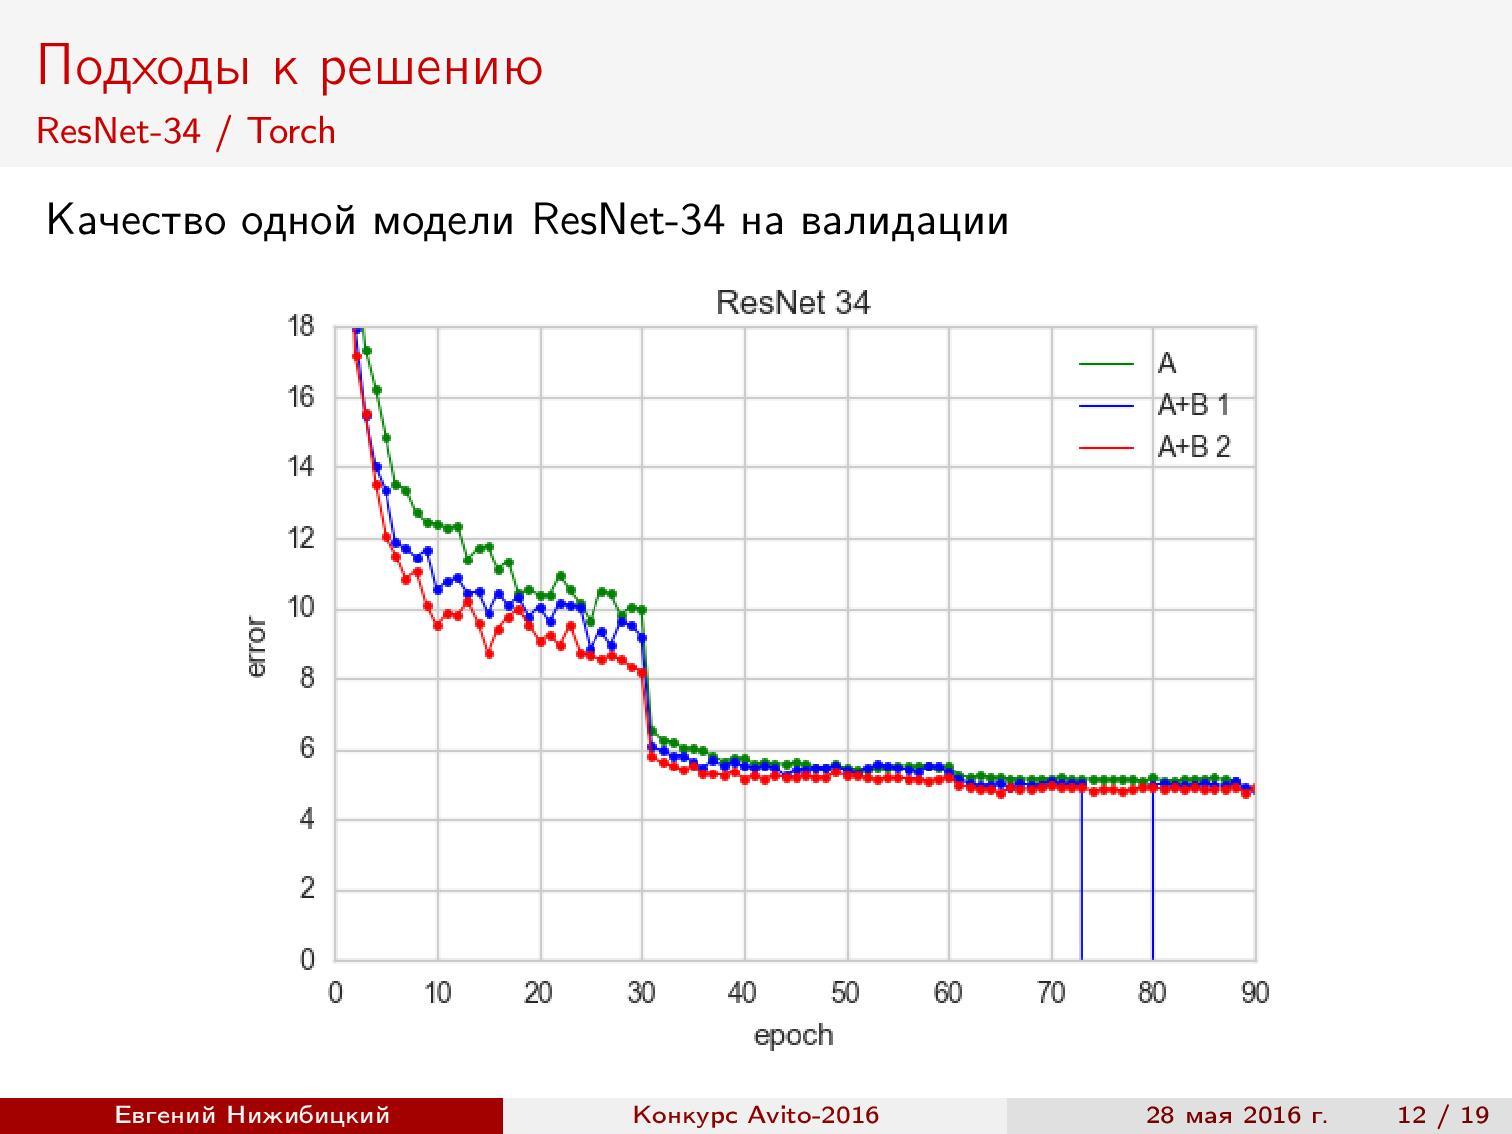
ResNet-34 Torch . You can use the ready-made repository of the authors of the architecture, but to get the predictions on the test in the right format, you need to fix some scripts. In addition, you need to solve the problems of large memory consumption dumps. Accuracy during validation is about 95%.
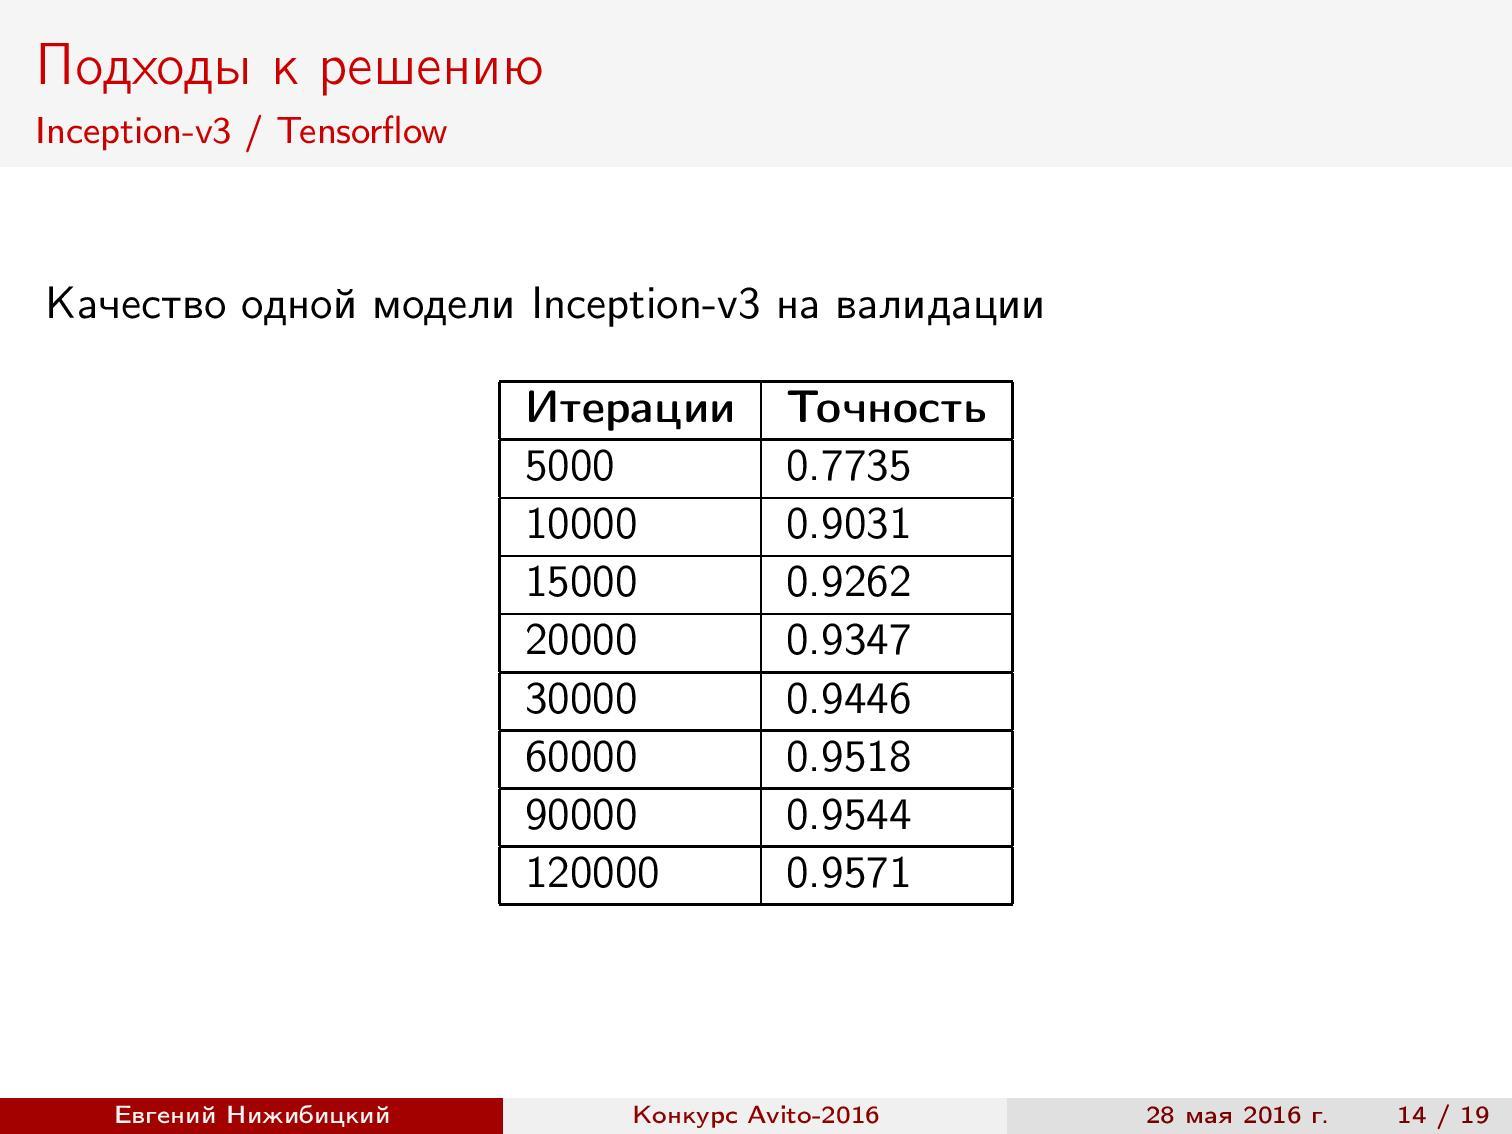
Inception-v3 TensorFlow . Here, the finished implementation was also used, but the pre-processing of images was changed, and the cropping of images during the generation of the batch was also limited. The result is almost 96% accuracy.

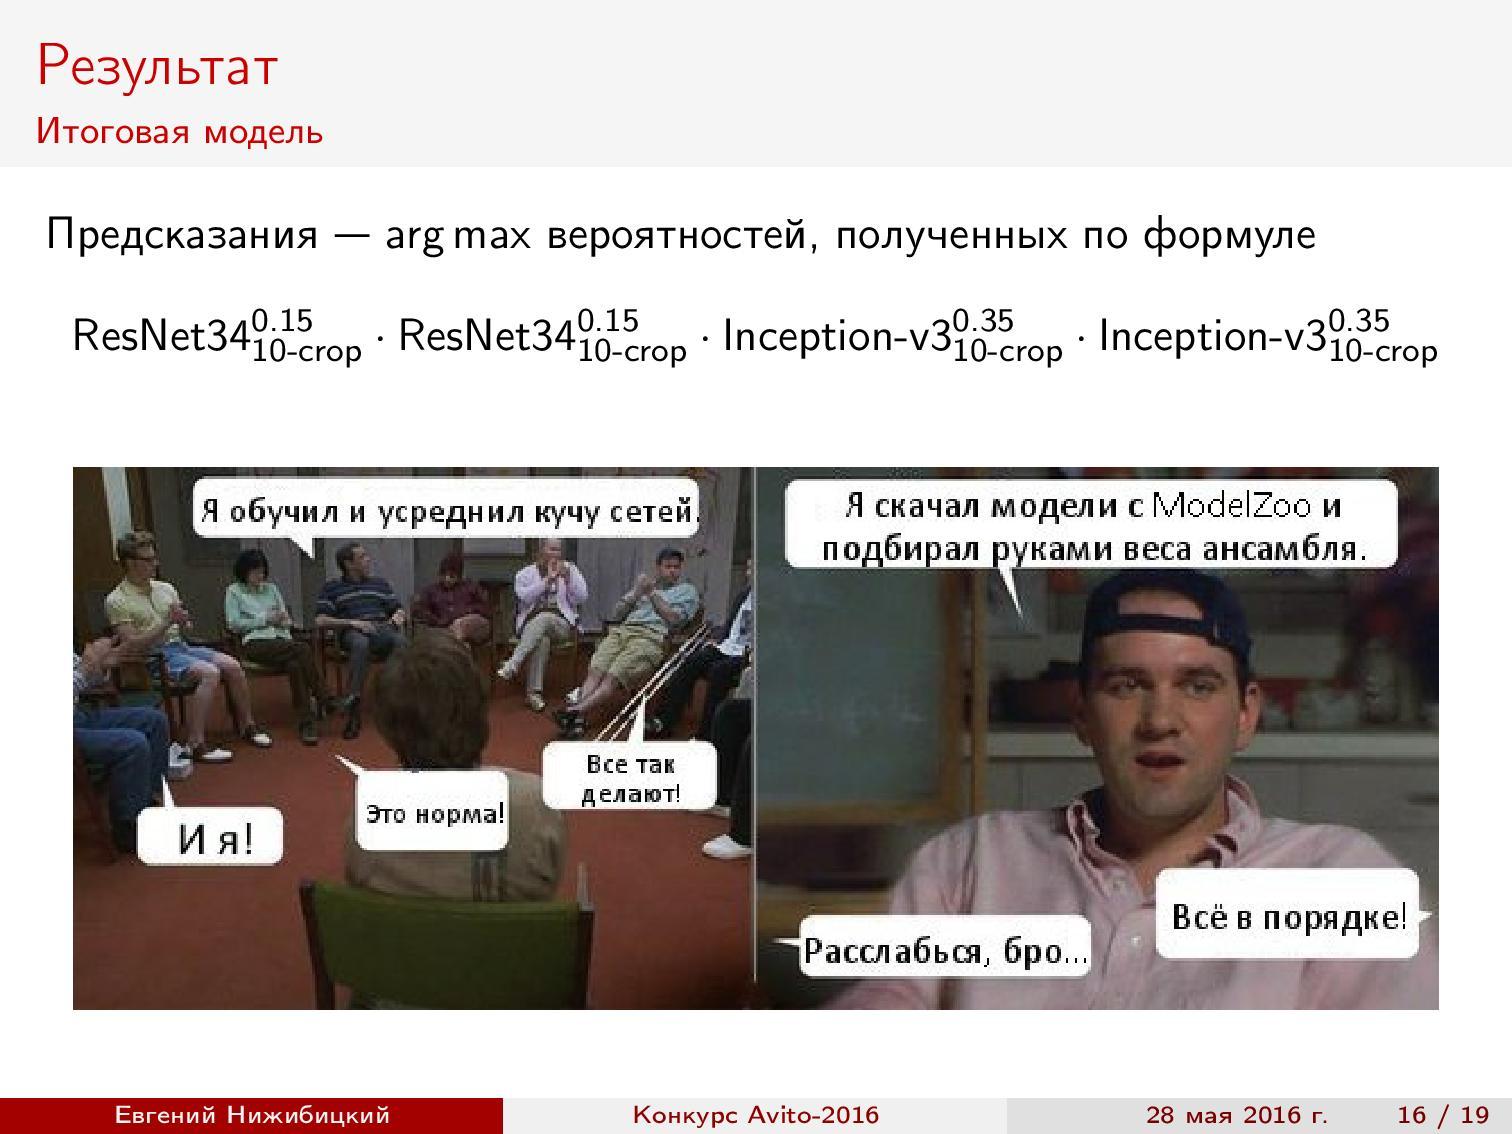
Ensemble of models . The result was two ResNet models and two Inception-v3 models. What quality during validation can be obtained by mixing models? The class probabilities were averaged using the geometric mean. Weights (in this case, degrees) were selected on a delayed sample.

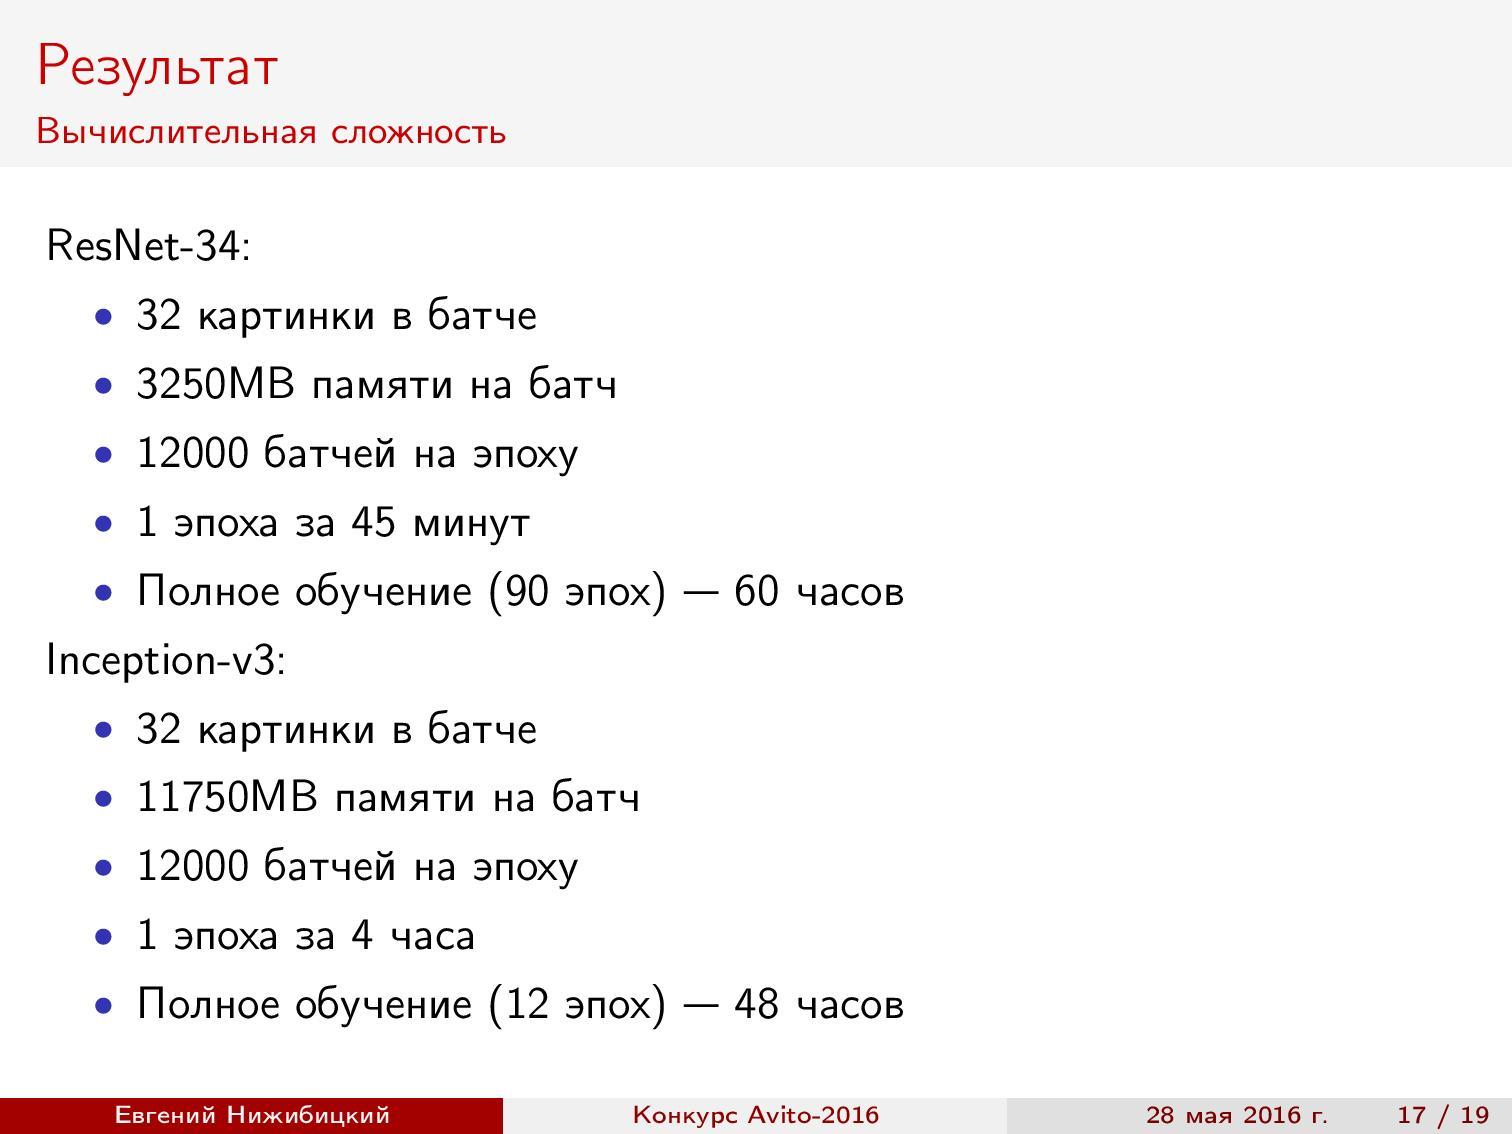
The results . ResNet training on the GTX 980 took 60 hours, and Inception-v3 on the TitanX - 48 hours. During the competition, we managed to test new frameworks with new architectures.
Link to Kaggle .
Stanislav Semenov tells how he and other participants of the Kaggle top joined together and won a prize in the competition on the classification of applications from customers of a large bank - BNP Paribas .
Task setting . According to the obfuscated data from insurance claims, it is necessary to predict whether it is possible to confirm the request without additional manual checks. For a bank, this is the process of automating the processing of applications, and for data analysts, it is simply a machine learning task on binary classification. There are about 230 thousand objects and 130 signs. Metric - LogLoss . It is worth noting that the winning team deciphered the data, which helped them win the competition.
Disposal of artificial noise in the signs . The first thing is to look at the data. Several things are immediately apparent. First, all signs take values from 0 to 20. Secondly, if you look at the distribution of any of the signs, you can see the following picture:

Why is that? The fact is that at the stage of anonymization and noise of data, random noise was added to all values, and then scaling was carried out to the interval from 0 to 20. The inverse transformation was carried out in two steps: first, the values were rounded to a certain decimal place, and then a denominator was selected . Was this required if the tree still selects a threshold for splitting? Yes, after the inverse transformation, the differences of variables begin to carry more meaning, and for categorical variables it is possible to carry out one-hot coding.
Removal of linearly dependent features . We also noticed that some signs are the sum of others. It is clear that they are not needed. For their definitions, subsets of features were taken. Regression was built on such subsets to predict some other variable. And if the predicted values were close to true (it is worth considering the artificial noise), then the sign could be removed. But the team did not bother with it and used the already ready set of filtered features. The set was prepared by someone else. One of the features of Kaggle is the availability of a forum and public solutions, through which participants share their findings.
How to understand what to use? There is a small hack. Suppose you know that someone in old competitions used some technique that helped him to take a high place (forums usually write short decisions). If in the current competition this participant is again among the leaders - most likely, the same technique will shoot here.
Coding categorical variables . It was striking that a certain variable V22 has a large number of values, but at the same time, if we take a subsample for a certain value, the number of levels (different values) of other variables decreases markedly. This includes good correlation with the target variable. What can be done? The simplest solution is to build a separate model for each value of V22, but this is the same as splitting all variables in the first split tree.
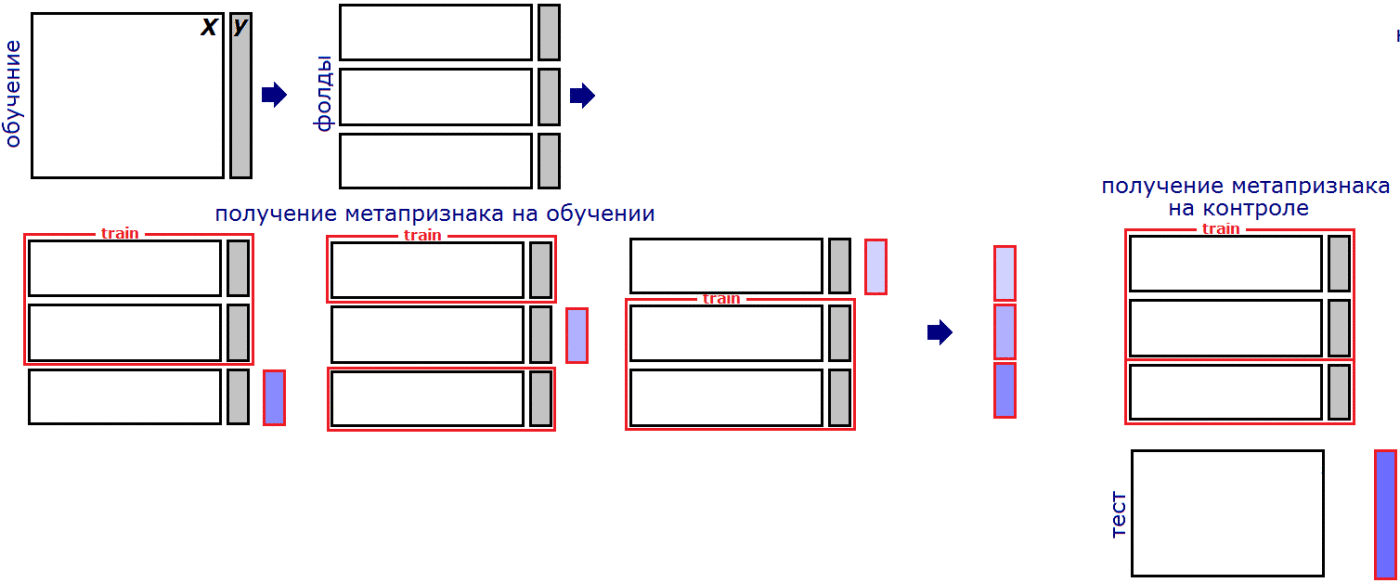
There is another way to use the information obtained - coding the average value of the target variable. In other words, each value of the categorical variable is replaced by the average value of the target for the objects for which the given attribute takes the same value. It is impossible to perform such encoding directly for the entire training set: in the process we implicitly enter information about the target variable into the signs. We are talking about information that almost any model is sure to find.
Therefore, these statistics are considered to fold. Here is an example:
Suppose that the data is divided into three parts. For each fold of the training set, we will consider the new feature for the two other folds, and for the test set - for the entire training set. Then the information about the target variable will not be so clearly included in the sample, and the model will be able to use the knowledge gained.
Will there be problems with anything else? Yes - with rare categories and cross-validation.
Rare categories . Suppose a certain category is encountered only a few times and the corresponding objects belong to class 0. Then the mean value of the target variable will also be zero. However, on a test sample, a completely different situation may arise. The solution is a smoothed average (or smoothed likelihood), which is calculated by the following formula:

Here global mean is the average value of the target variable over the entire sample, nrows is how many times the specific value of the categorical variable is met, alpha is the regularization parameter (for example, 10). Now, if some value is rarely met, the global average will have more weight, and if often enough, the result will be close to the initial average for the category. By the way, this formula allows processing previously unknown values of a categorical variable.
Cross validation . Suppose we calculated all smoothed means for categorical variables for other folds. Can we evaluate the quality of the model by standard cross-validation k-fold? Not. Let's take an example.

For example, we want to evaluate the model on the third fold. We are training the model in the first two folds, but they have a new variable with an average value of the target variable, when calculating which we have already used the third test fold. This does not allow us to correctly evaluate the results, but the problem that has arisen is solved by calculating the statistics on the folds within the folds. Consider again the example:
We still want to evaluate the model on the third fold. We divide the first two folds (the training sample of our assessment) into some other three folds, we calculate the new feature in the already analyzed script, and for the third fold (this is a test sample of our assessment), we count the first two folds together. Then no information from the third fold will be used when training the model and the assessment will be honest. In the competition, which we are discussing, only such cross-validation allowed to correctly assess the quality of the model. Of course, the “external” and “internal” number of folds can be any.
Construction of signs . We used not only the already smoothed mean values of the target variable, but also weights of evidence. This is almost the same, but with a logarithmic transformation. In addition, features of the form of the difference in the number of objects of positive and negative classes in a group without any normalization turned out to be useful. Intuition here is the following: the scale shows the degree of confidence in the class, but what to do with the quantitative traits? After all, if we process them in a similar way, then all values will be “forgotten” by the regularization of the global average. One option is to divide the values into bins, which are then considered as separate categories. Another way is simply to build a certain linear model on one sign with the same target. Total got about two thousand signs of 80 filtered.
Stacking and blending . As in most competitions, an important part of the solution is the stacking of models. In short, the essence of stacking is that we transfer the predictions of one model as a sign to another model. However, it is important once again not to retrain. Let's just look at an example:
Taken from the blog of Alexander Dyakonov
For example, we decided to split our selection into three folds at the stacking stage. Similar to calculating statistics, we must train the model in two folds, and add predicted values for the remaining fold. For a test sample, you can average the predictions of models from each pair of folds. Each stacking level refers to the process of adding a group of new feature-prediction models based on the existing dataset.
On the first level, the team had 200-250 different models, on the second - another 20-30, on the third - a few more. The result is a blending, i.e. a mix of predictions of different models. Various algorithms were used: gradient boosters with different parameters, random forests, neural networks. The main idea is to apply the most diverse models with different parameters, even if they provide not the highest quality.
Teamwork . Usually, participants are combined into teams before the end of the competition, when everyone already has their own groundwork. We teamed up with other "Kaglerami" at the very beginning. Each team member had a folder in the public cloud where datasets and scripts were located. The general procedure of cross-validation was approved in advance so that it could be compared with each other. Roles were distributed as follows: I invented new signs, the second participant built models, the third selected them, and the fourth controlled the entire process.
Where to get power . Testing a large number of hypotheses, building multilevel stacking and learning models can take too much time if you use a laptop. Therefore, many participants use compute servers with a large number of cores and RAM. I usually use AWS servers, and my team members, as it turned out, use cars at work for contests while they are idle.
Communication with the organizing company . After successful performance in the competition, communication with the company takes place in the form of a joint conference call. Participants talk about their decision and answer questions. In BNP, people were not surprised by multilevel stacking, but they were interested, of course, in building signs, working in a team, validating results — anything that might be useful to them in improving their own system.
Whether it is necessary to decipher . The winning team noticed one feature in the data. Some signs have missing values, and some do not. That is, some characteristics are not dependent on specific people. In addition, we got 360 unique values. It is logical to assume that we are talking about some time stamps. It turned out that if we take the difference between two such signs and sort the entire sample by it, then first zeros will go more often, and then ones. The winners took advantage of this.
Our team ranked third. In total, nearly three thousand teams participated.
Link to DataRing .
This is another Avito contest. It took place in several stages, the first of which (as, incidentally, also the third) was won by Arthur Kuzin N01Z3 .
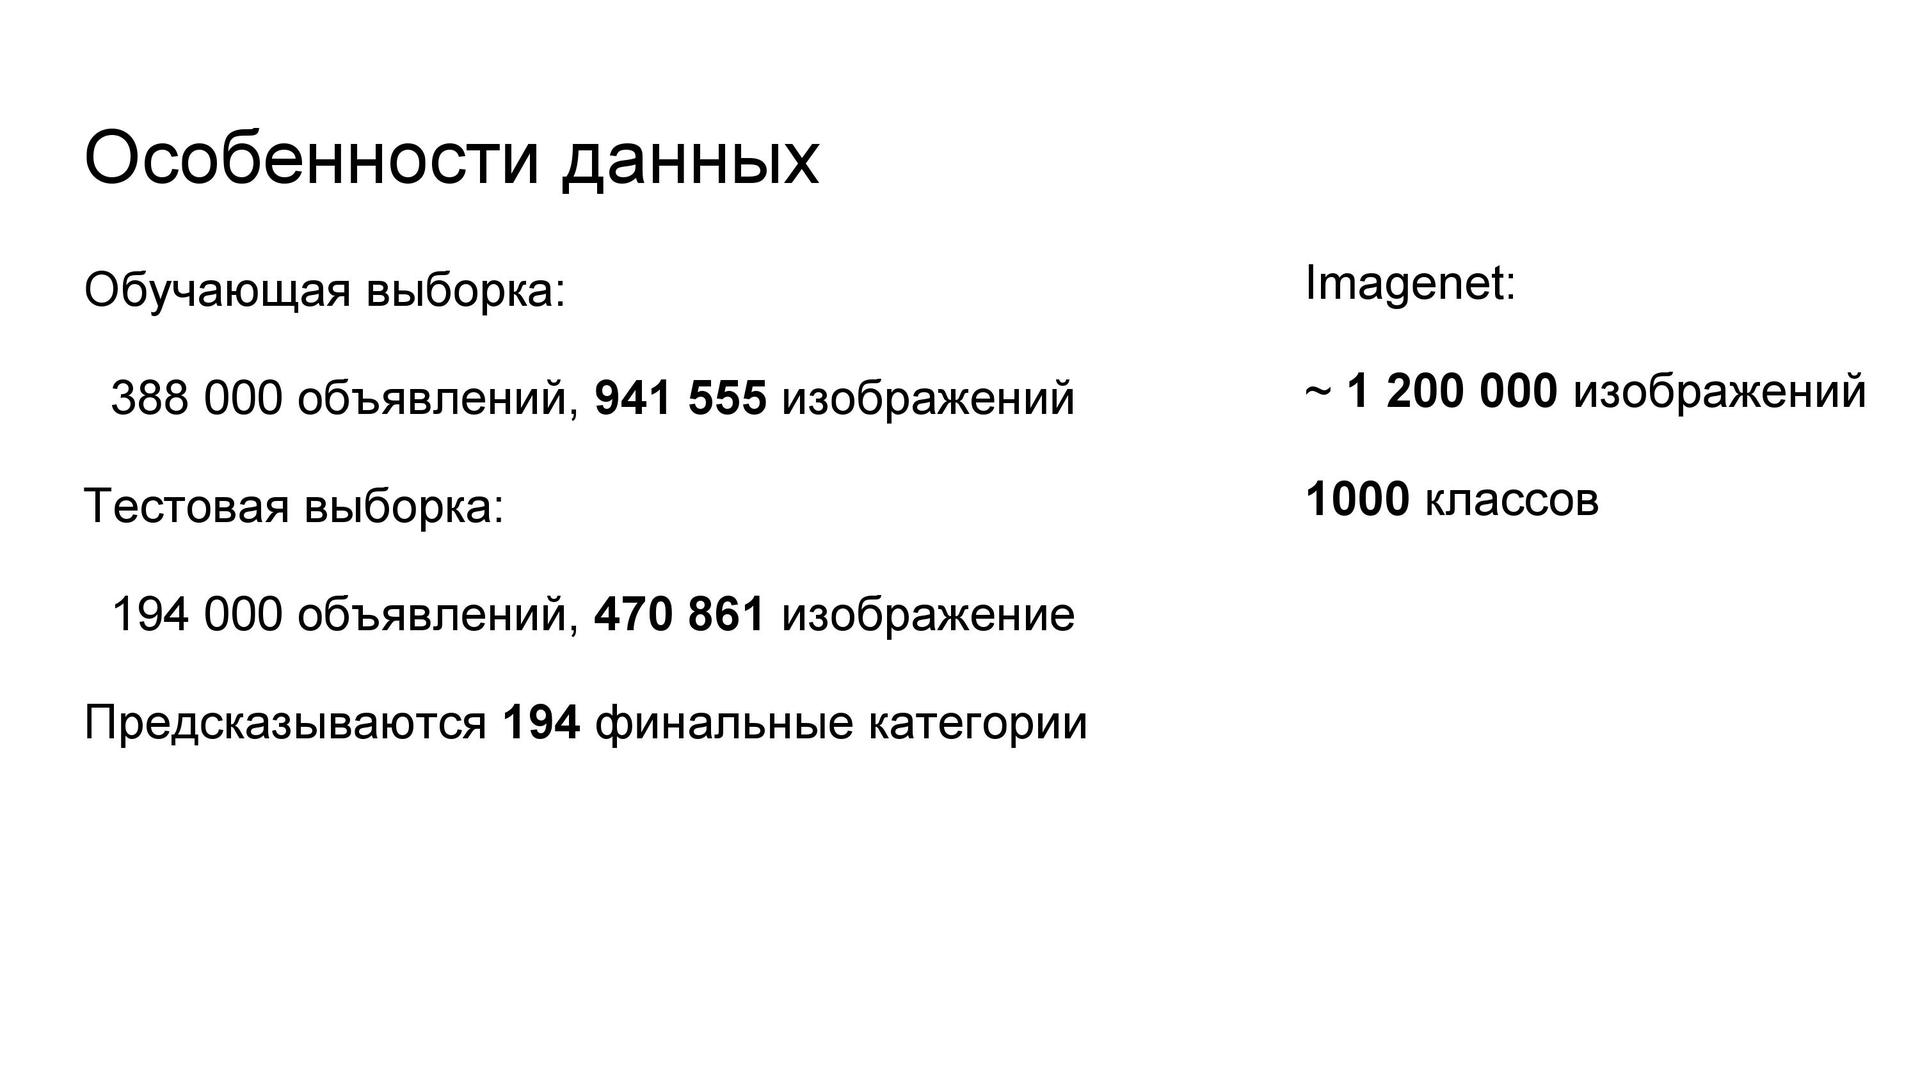
Task setting . According to the photos from the ad, you must define a category. Each ad corresponded from one to five images. The metric took into account the coincidence of categories at different levels of the hierarchy - from general to narrower (the latter level contains 194 categories). In total, the training sample had almost a million images, which is close to the size of ImageNet.
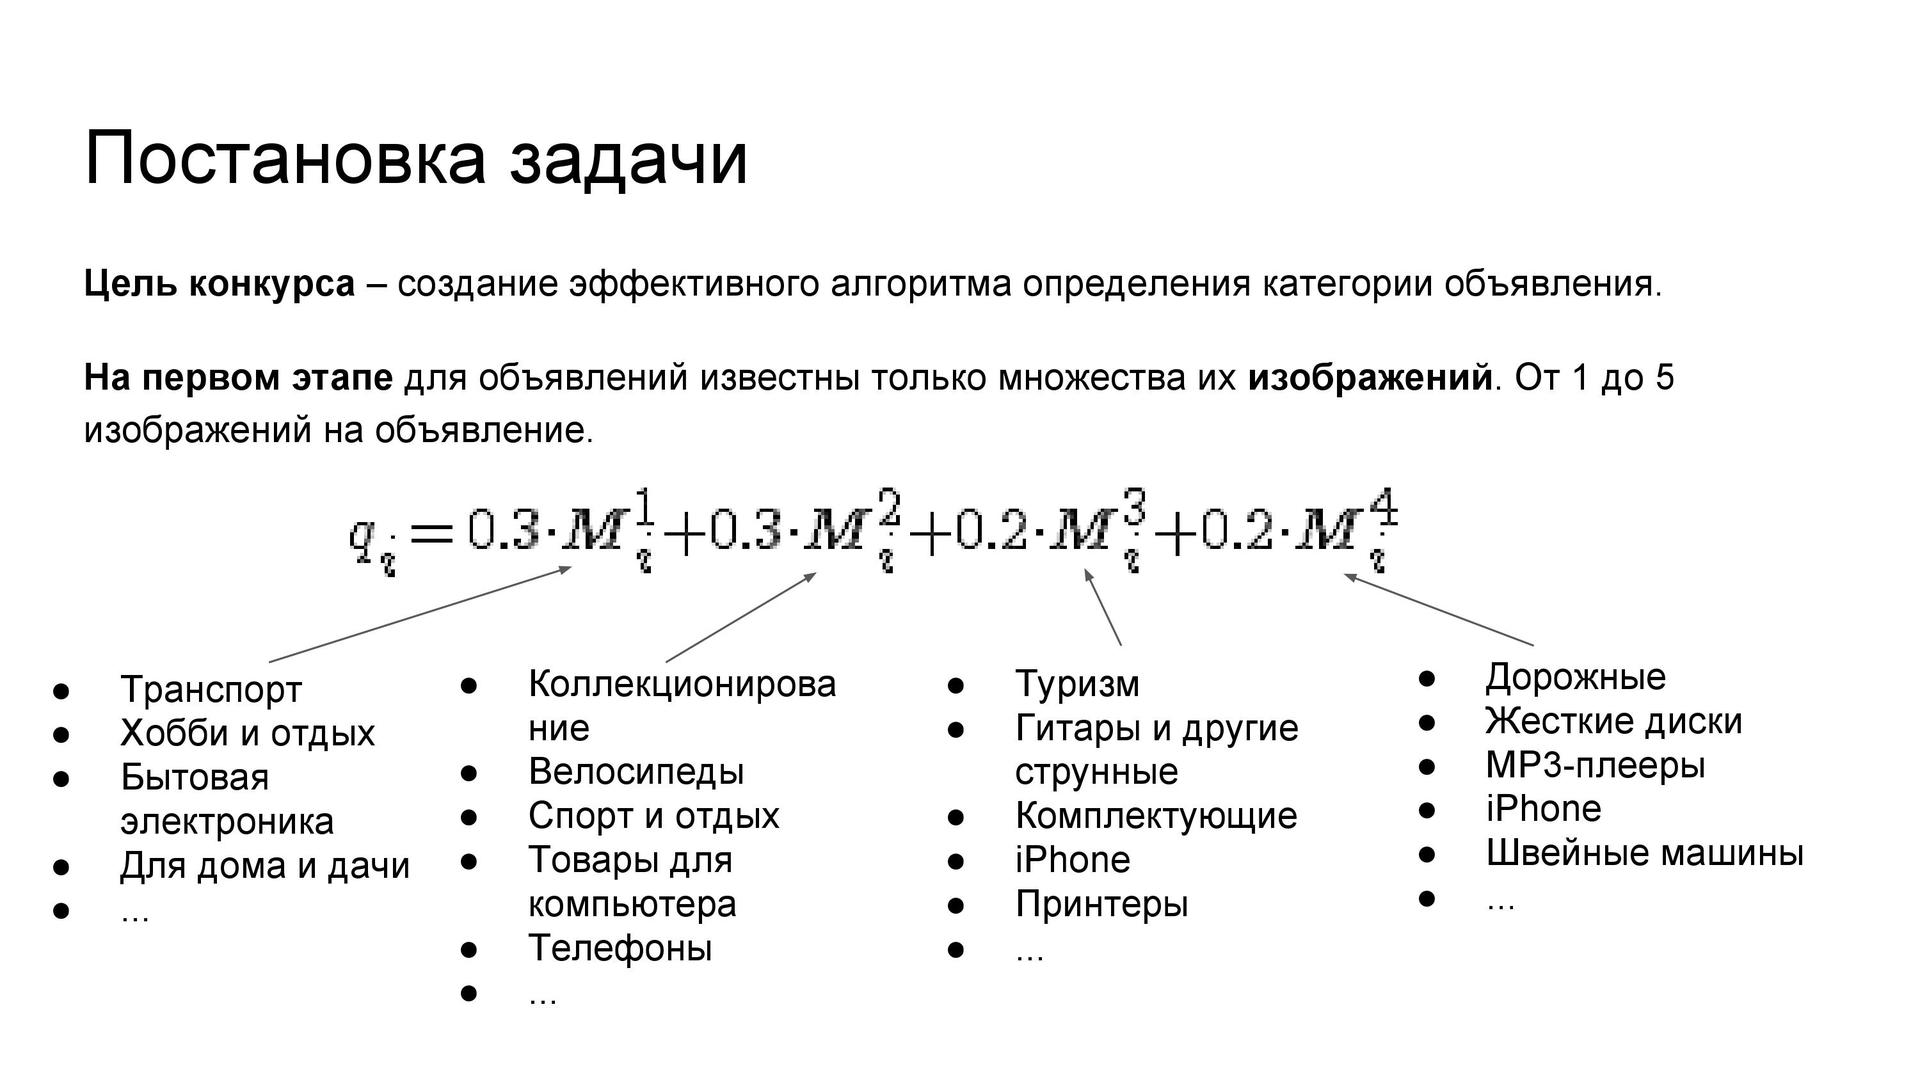
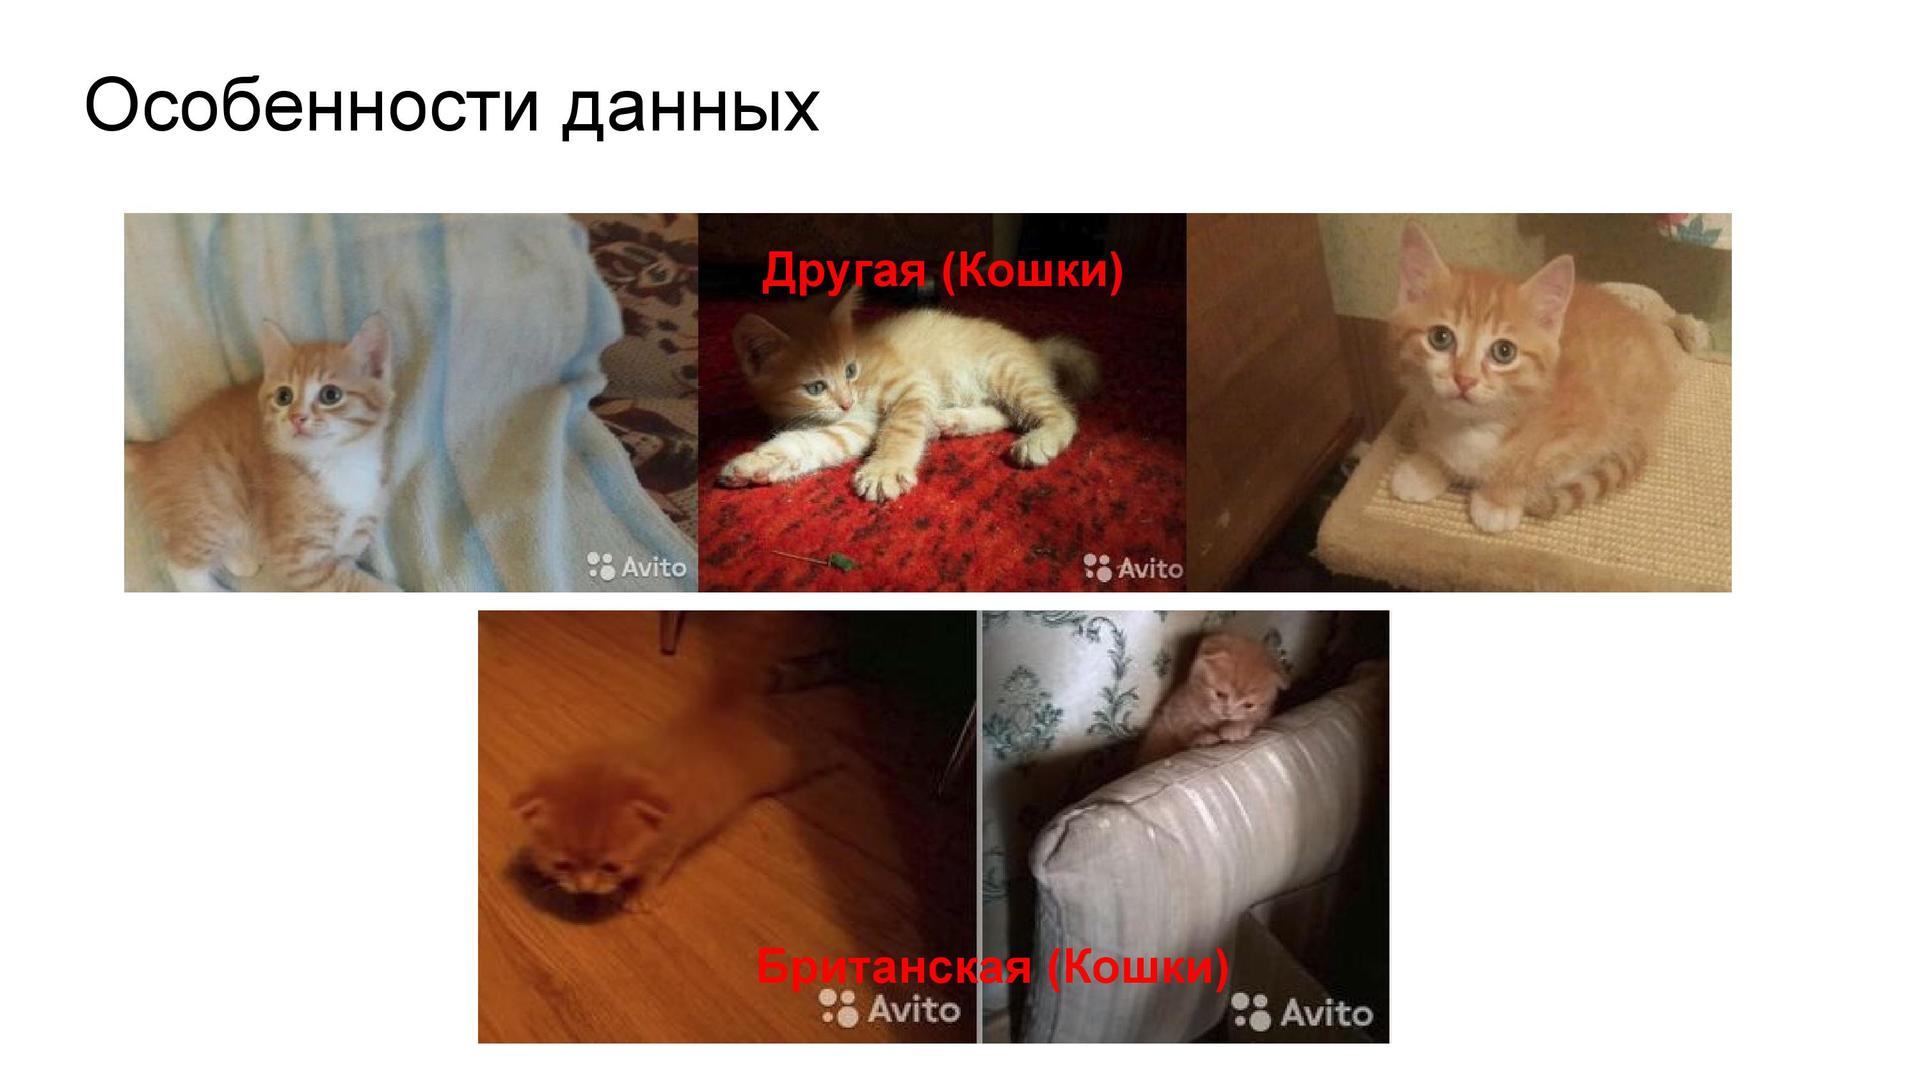
The difficulty of recognition . It would seem that you just need to learn how to distinguish TV from the car, and the car from the shoes. But, for example, there is a category “British cats”, and there are “other cats”, and among them there are very similar images - although you can still distinguish them from each other. What about tires, wheels and wheels? Here the man can not cope. These difficulties are the reason for the appearance of some limit on the results of all participants.

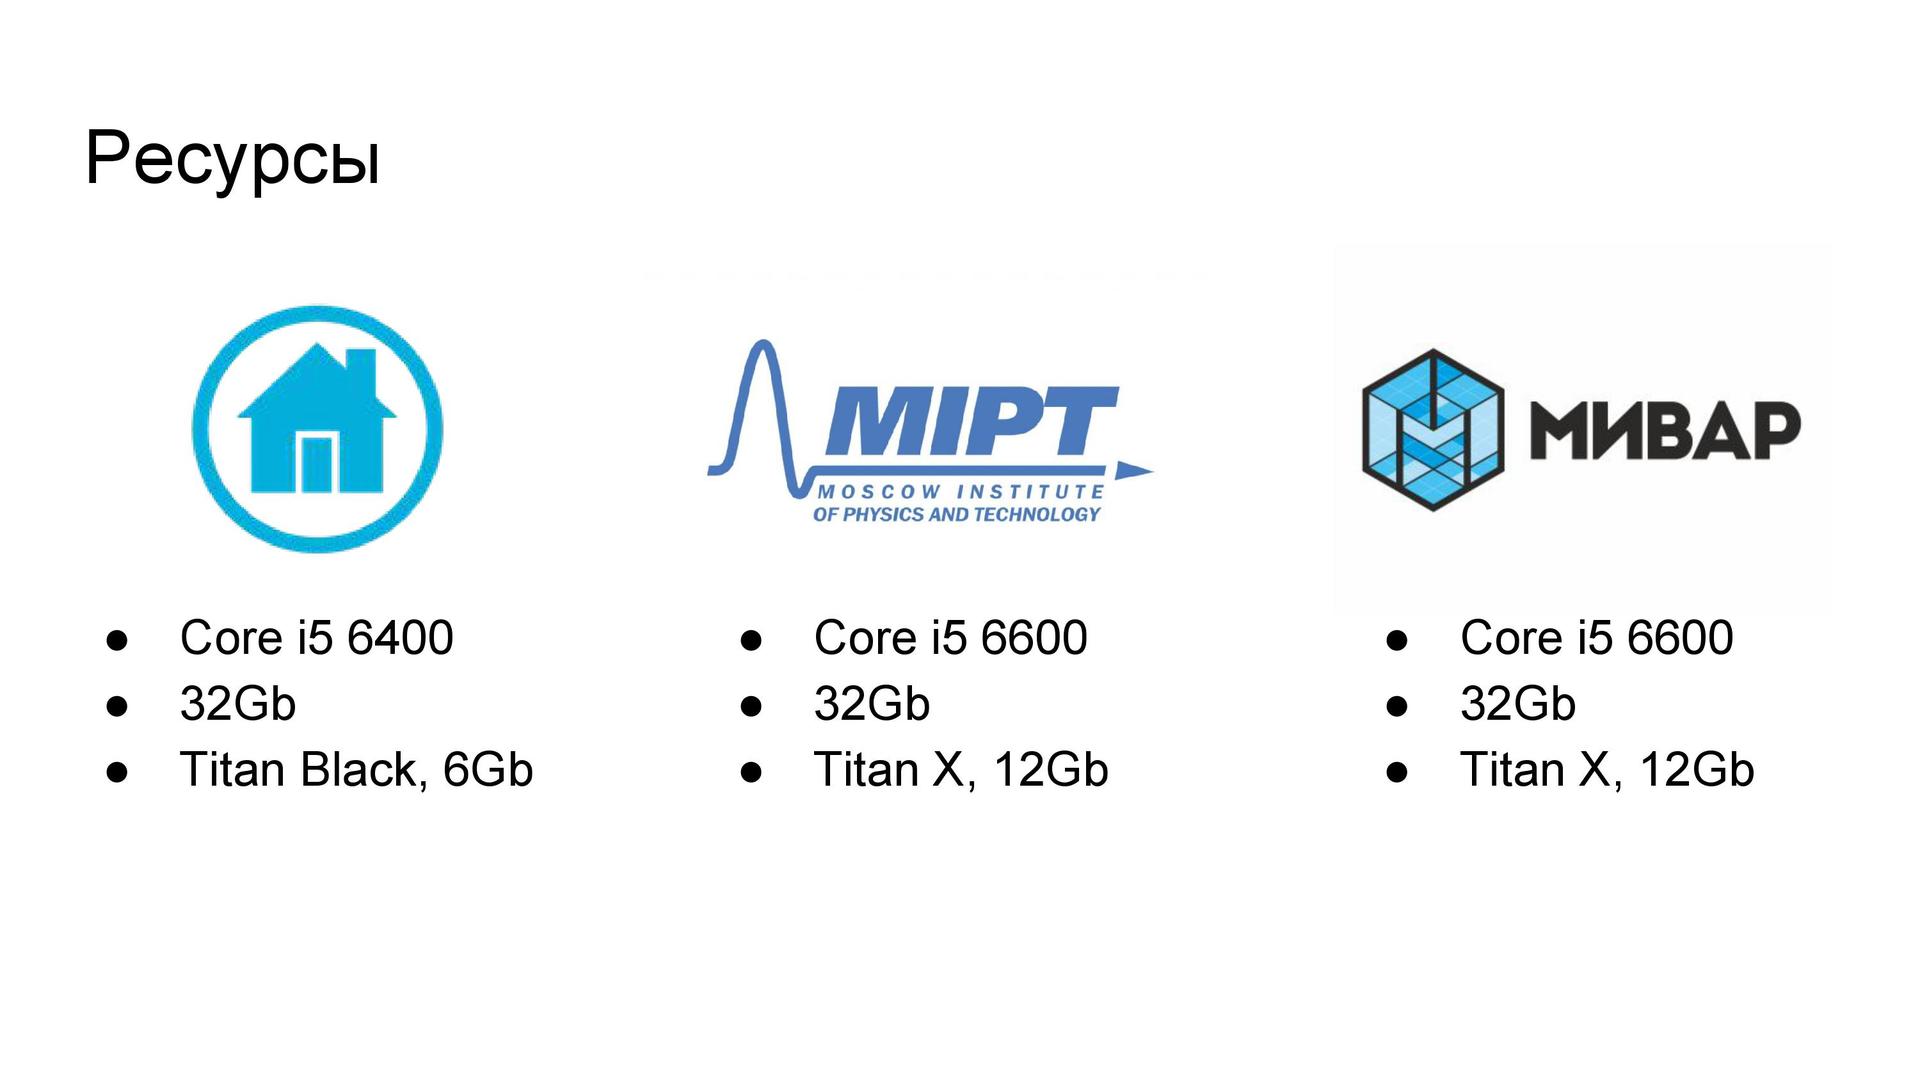
Resources and framework . I had at my disposal three computers with powerful video cards: a home computer provided by a laboratory at MIPT and a computer at work. Therefore, it was possible (and had to) train several networks simultaneously. MXNet was chosen as the main neural network learning framework, created by the same guys who wrote the well-known XGBoost . This alone was the reason to trust their new product. The advantage of MXNet is that an effective iterator is available out of the box with a regular augmentation, which is sufficient for most tasks.
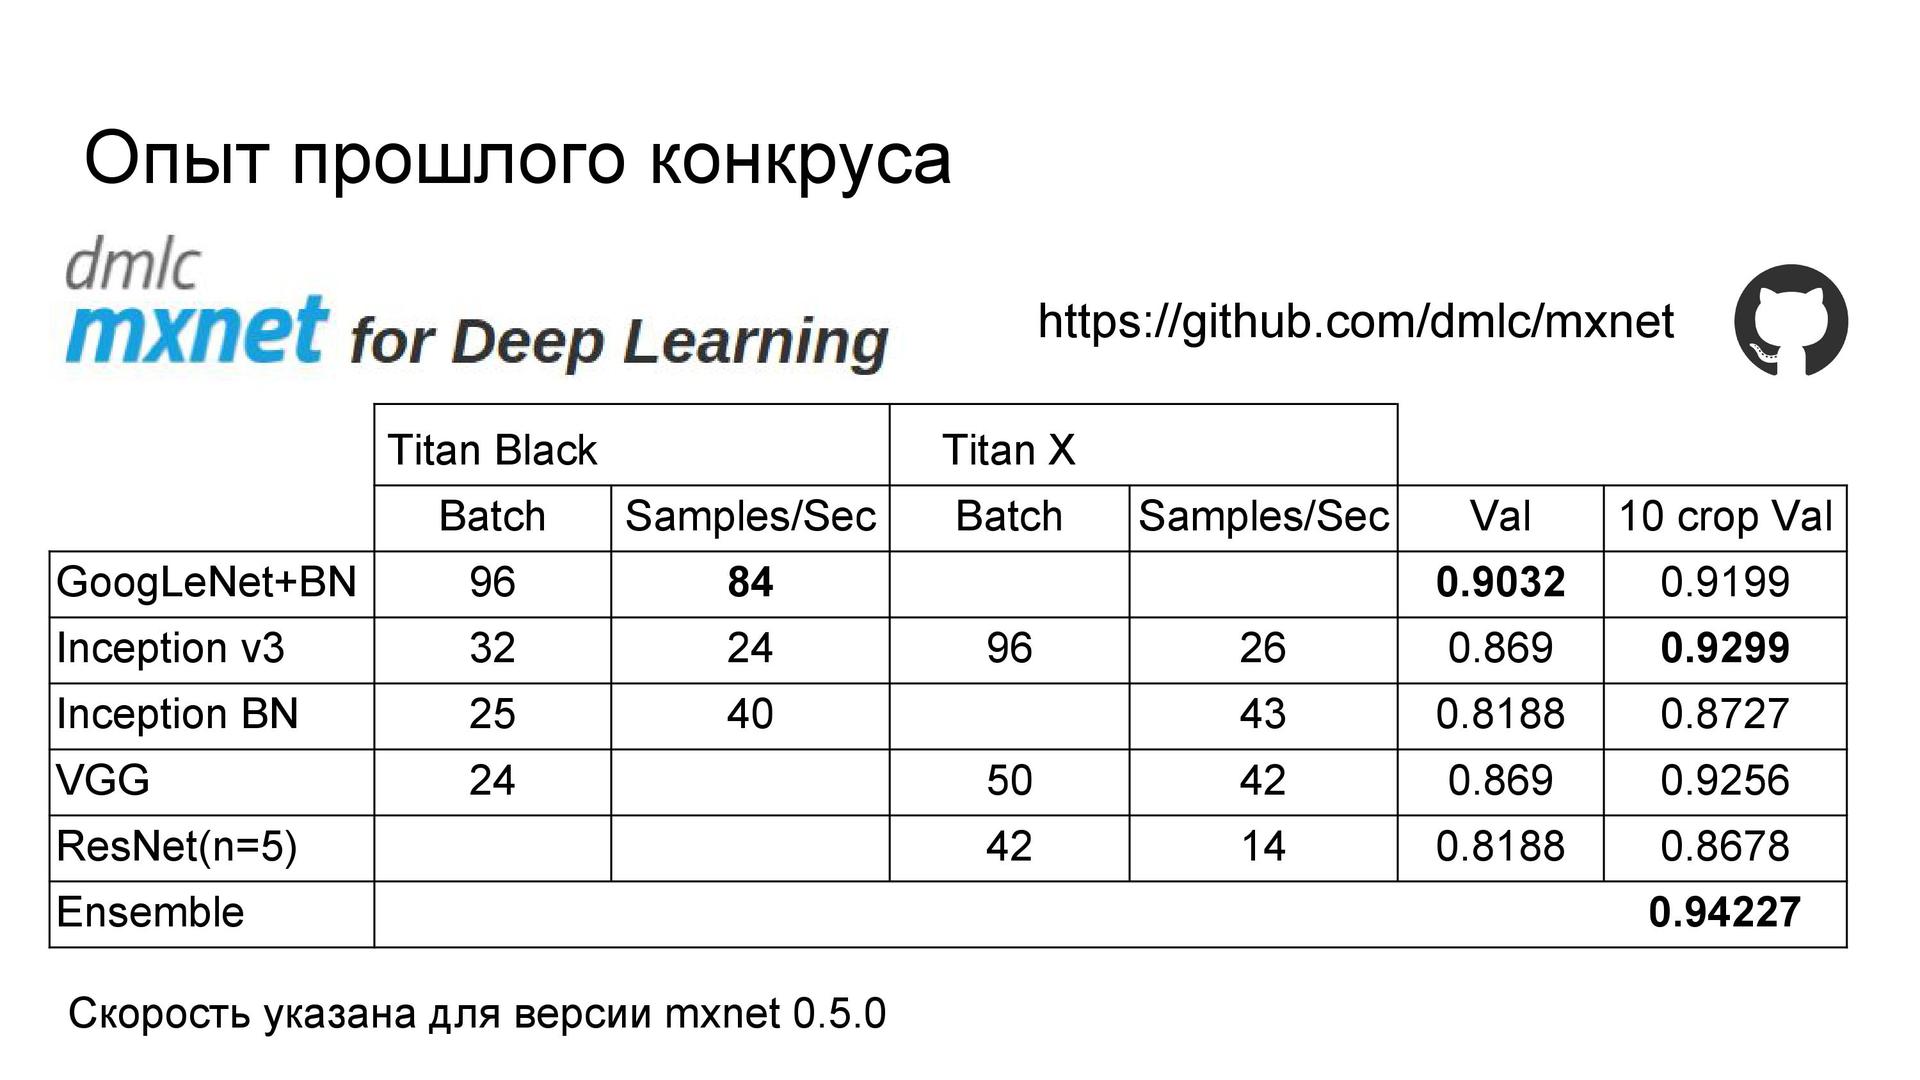
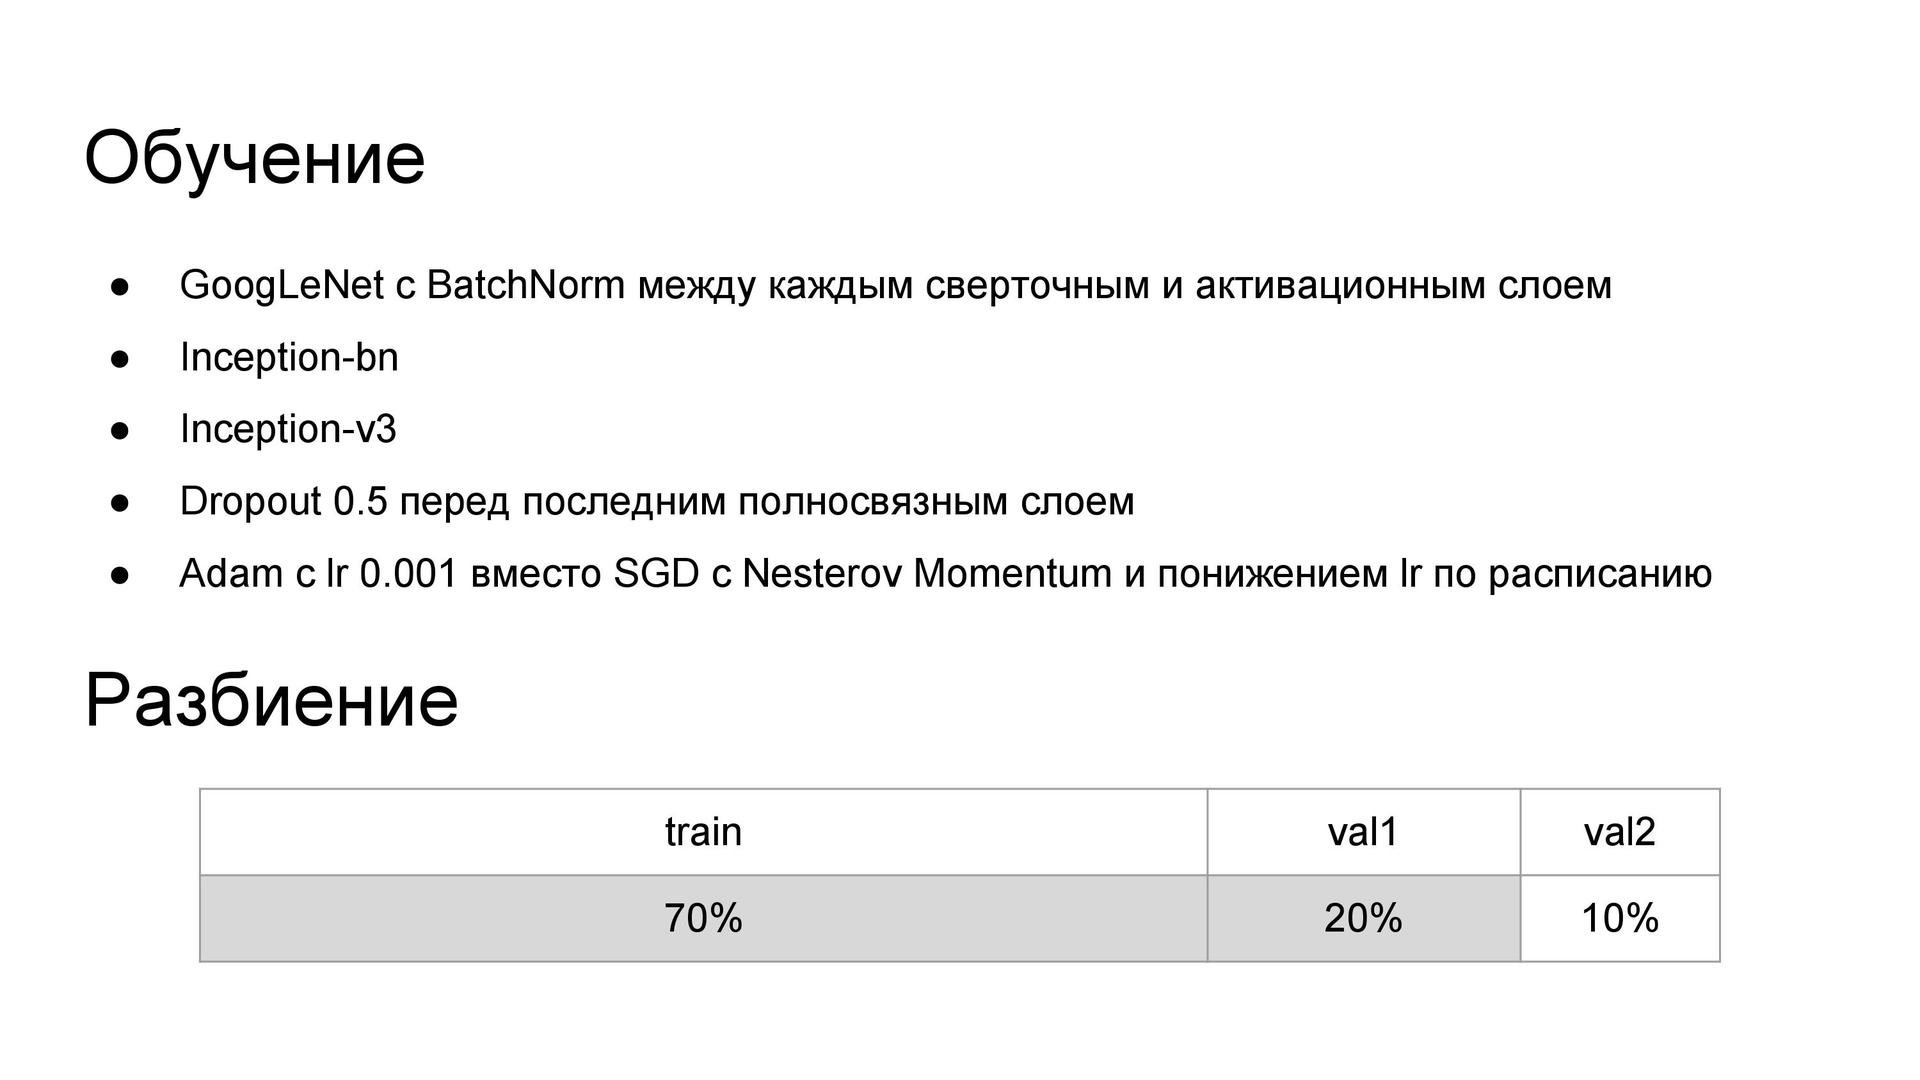
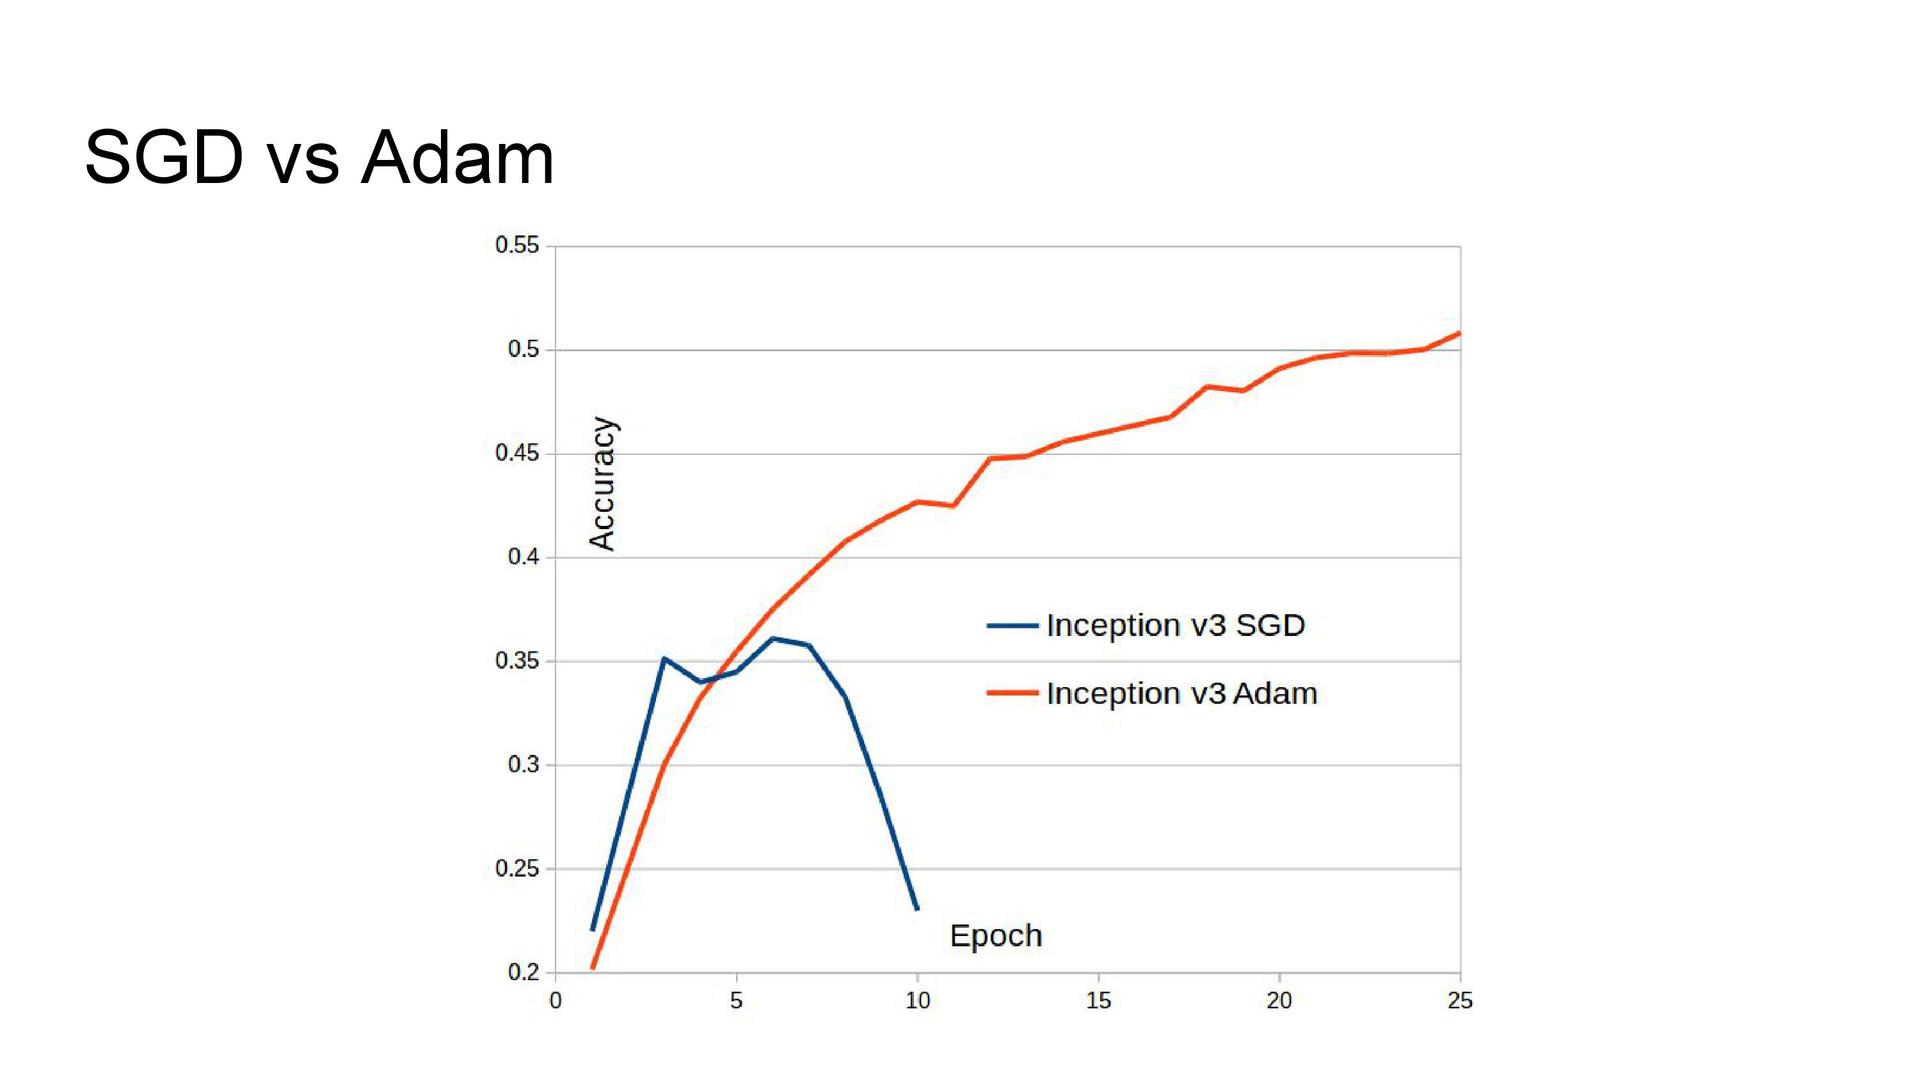
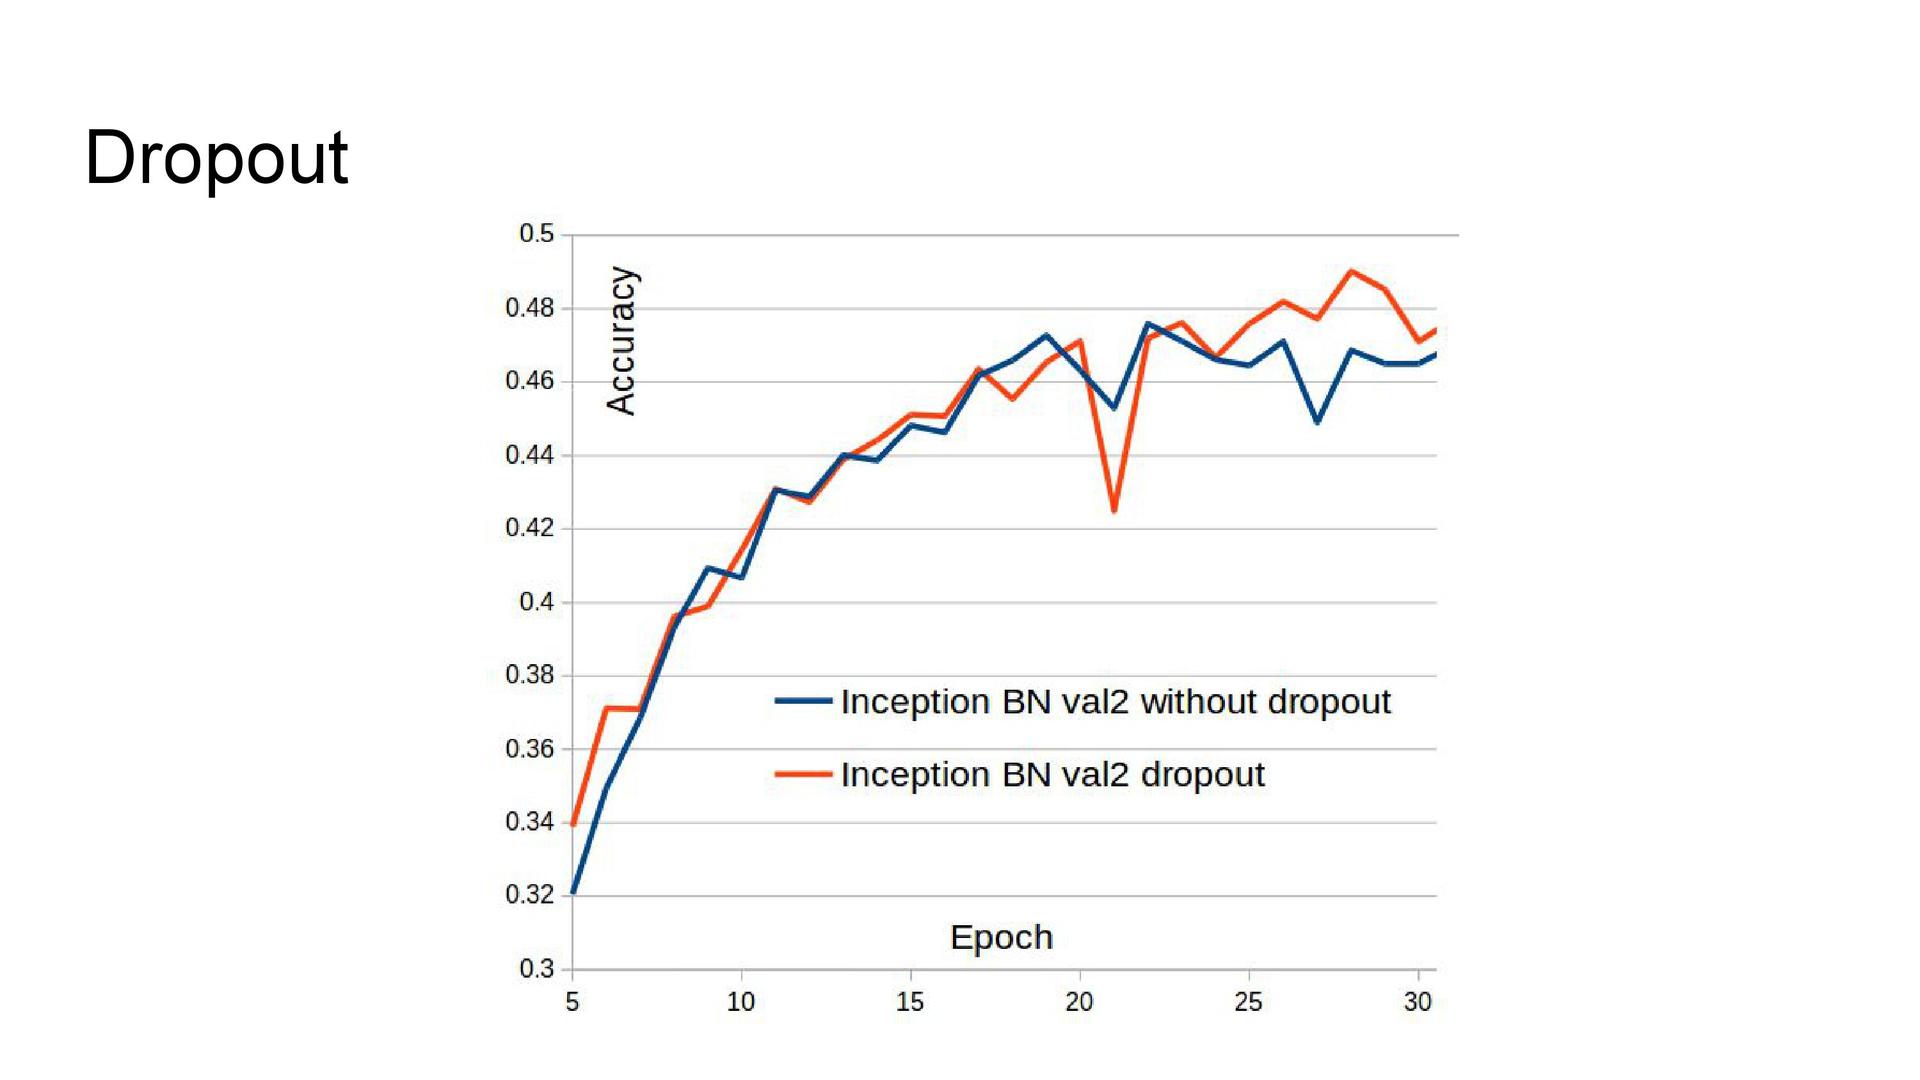
Network Architecture The experience of participating in one of the past competitions showed that the architecture of the Inception series shows the best quality. I used them here. Butch normalization was added to GoogLeNet as it accelerated the learning of the model. The Inception-v3 and Inception BN architectures from the Model Zoo model library were also used, to which a dropout was added before the last fully connected layer. Due to technical problems, it was not possible to train the network using a stochastic gradient descent, therefore Adam was used as an optimizer.
Data augmentation . To improve the quality of the network, augmentation was used - adding distorted images to the sample in order to increase the diversity of data. Transformations such as accidental photo cropping, reflection, turning at a small angle, changing the aspect ratio and shifting were involved.

Accuracy and speed of learning . At first I divided the sample into three parts, but then I abandoned one of the validation steps for mixing the models. Therefore, subsequently, the second part of the sample was added to the training set, which improved the quality of networks. In addition, GoogLeNet initially studied at Titan Black, which has half the memory compared to Titan X. So this network was re-trained with a large batch size, and its accuracy increased. If you look at the time of learning networks, we can conclude that in terms of limited time it is not necessary to use Inception-v3, because with two other architectures, learning goes much faster. The reason is the number of parameters. Inception BN learns the fastest.
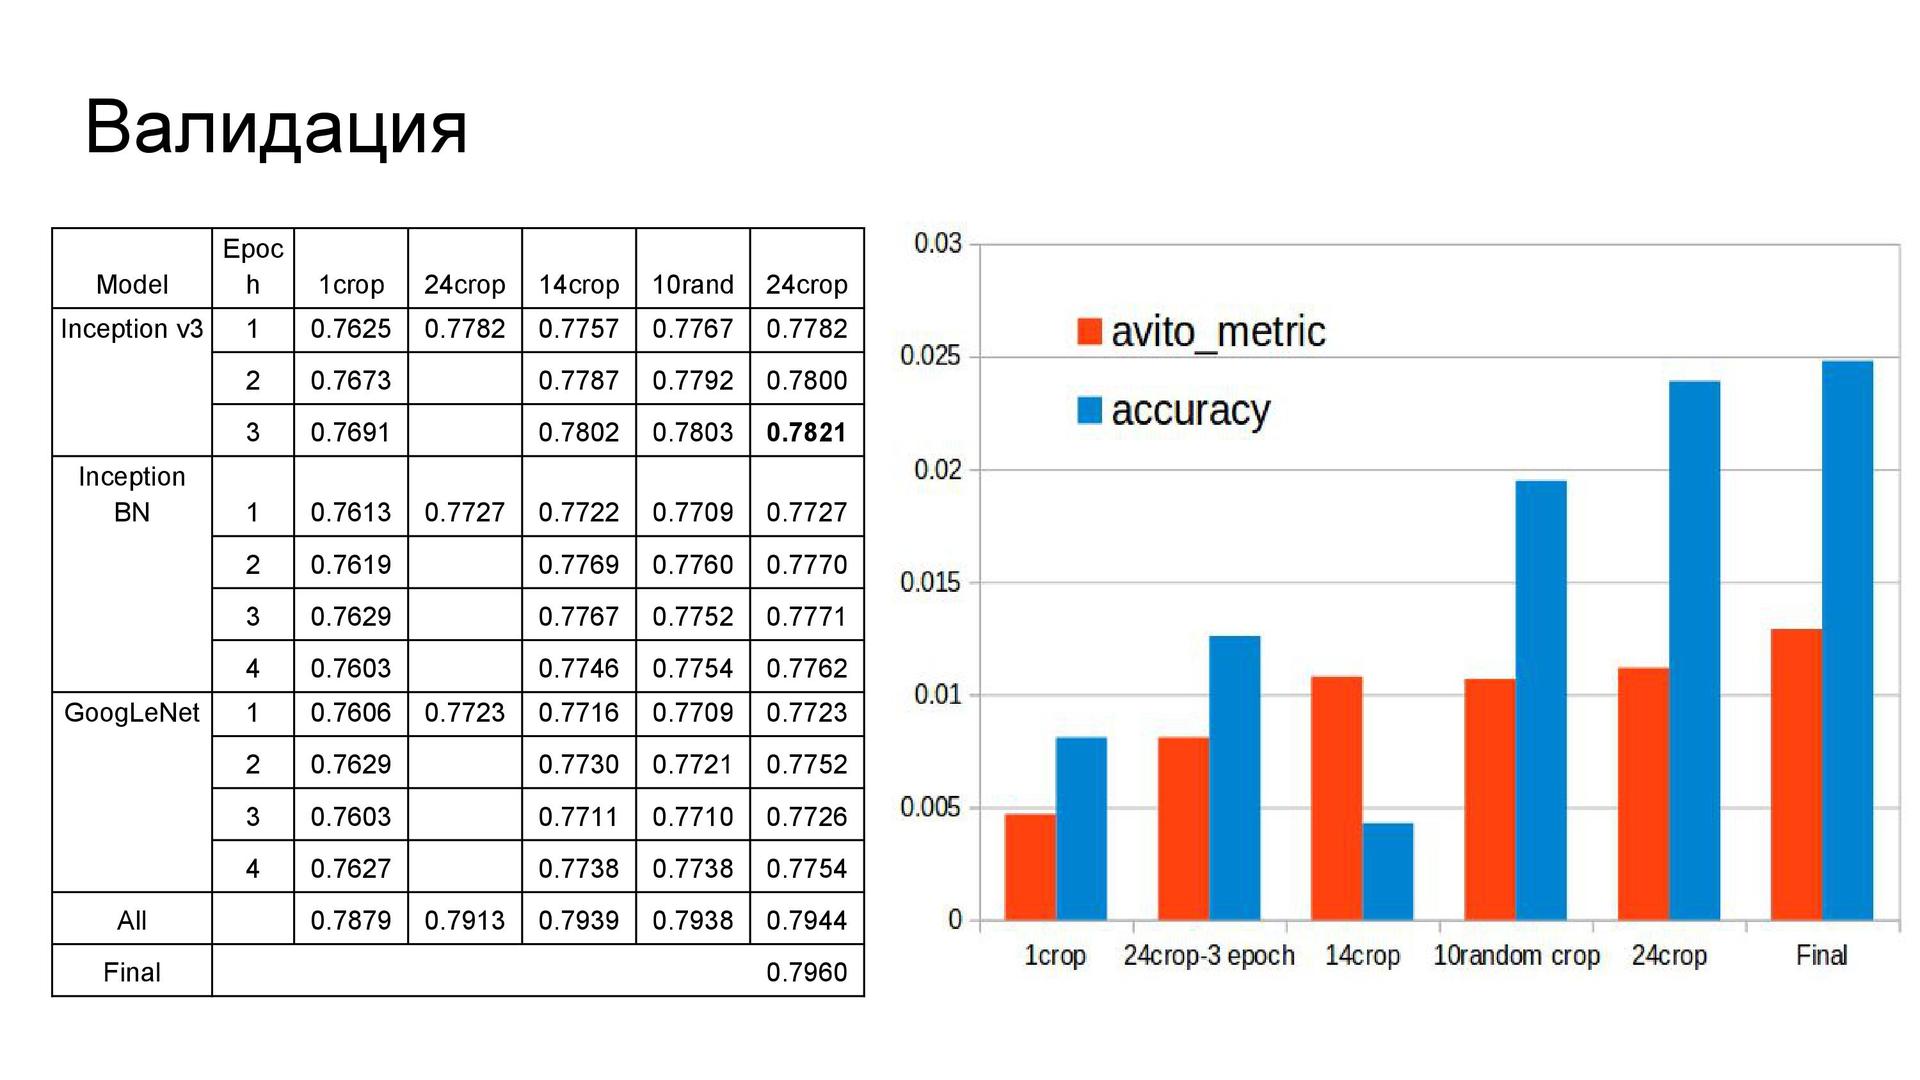
Building predictions .
Like Eugene in the competition with the brands of cars, Arthur used predictions on the crocs - but not on 10 polling stations, but on 24. The plots were angles, their reflections, the center, the turns of the central parts and ten more random ones.
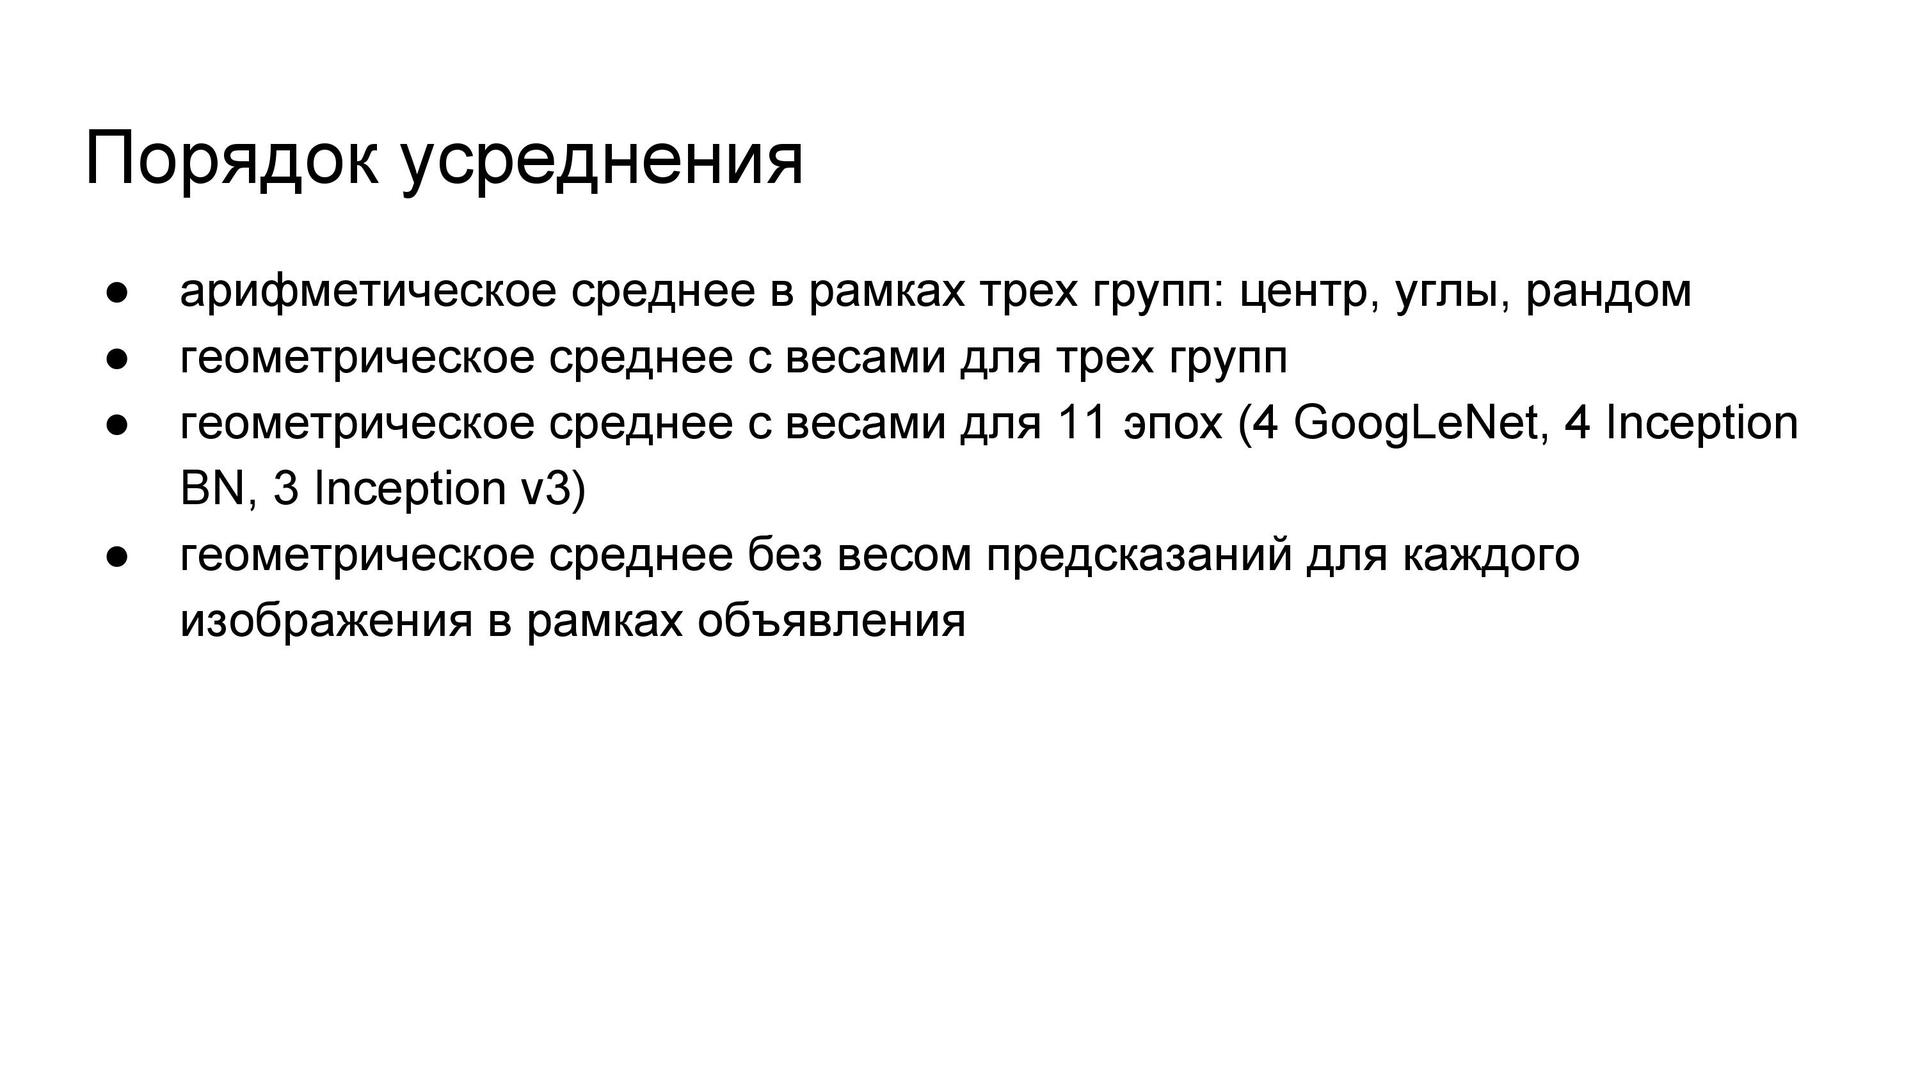
If one maintains the state of the network after each epoch, the result is a variety of different models, not just the final network. Taking into account the time remaining until the end of the competition, I could use the predictions of 11 epoch models — since the construction of predictions using the network also lasts quite a lot. All of these predictions were averaged according to the following scheme: first, using the arithmetic average within the cropping groups, then using the geometric average with weights selected on the validation set. , . .
. , . , . , . , , .
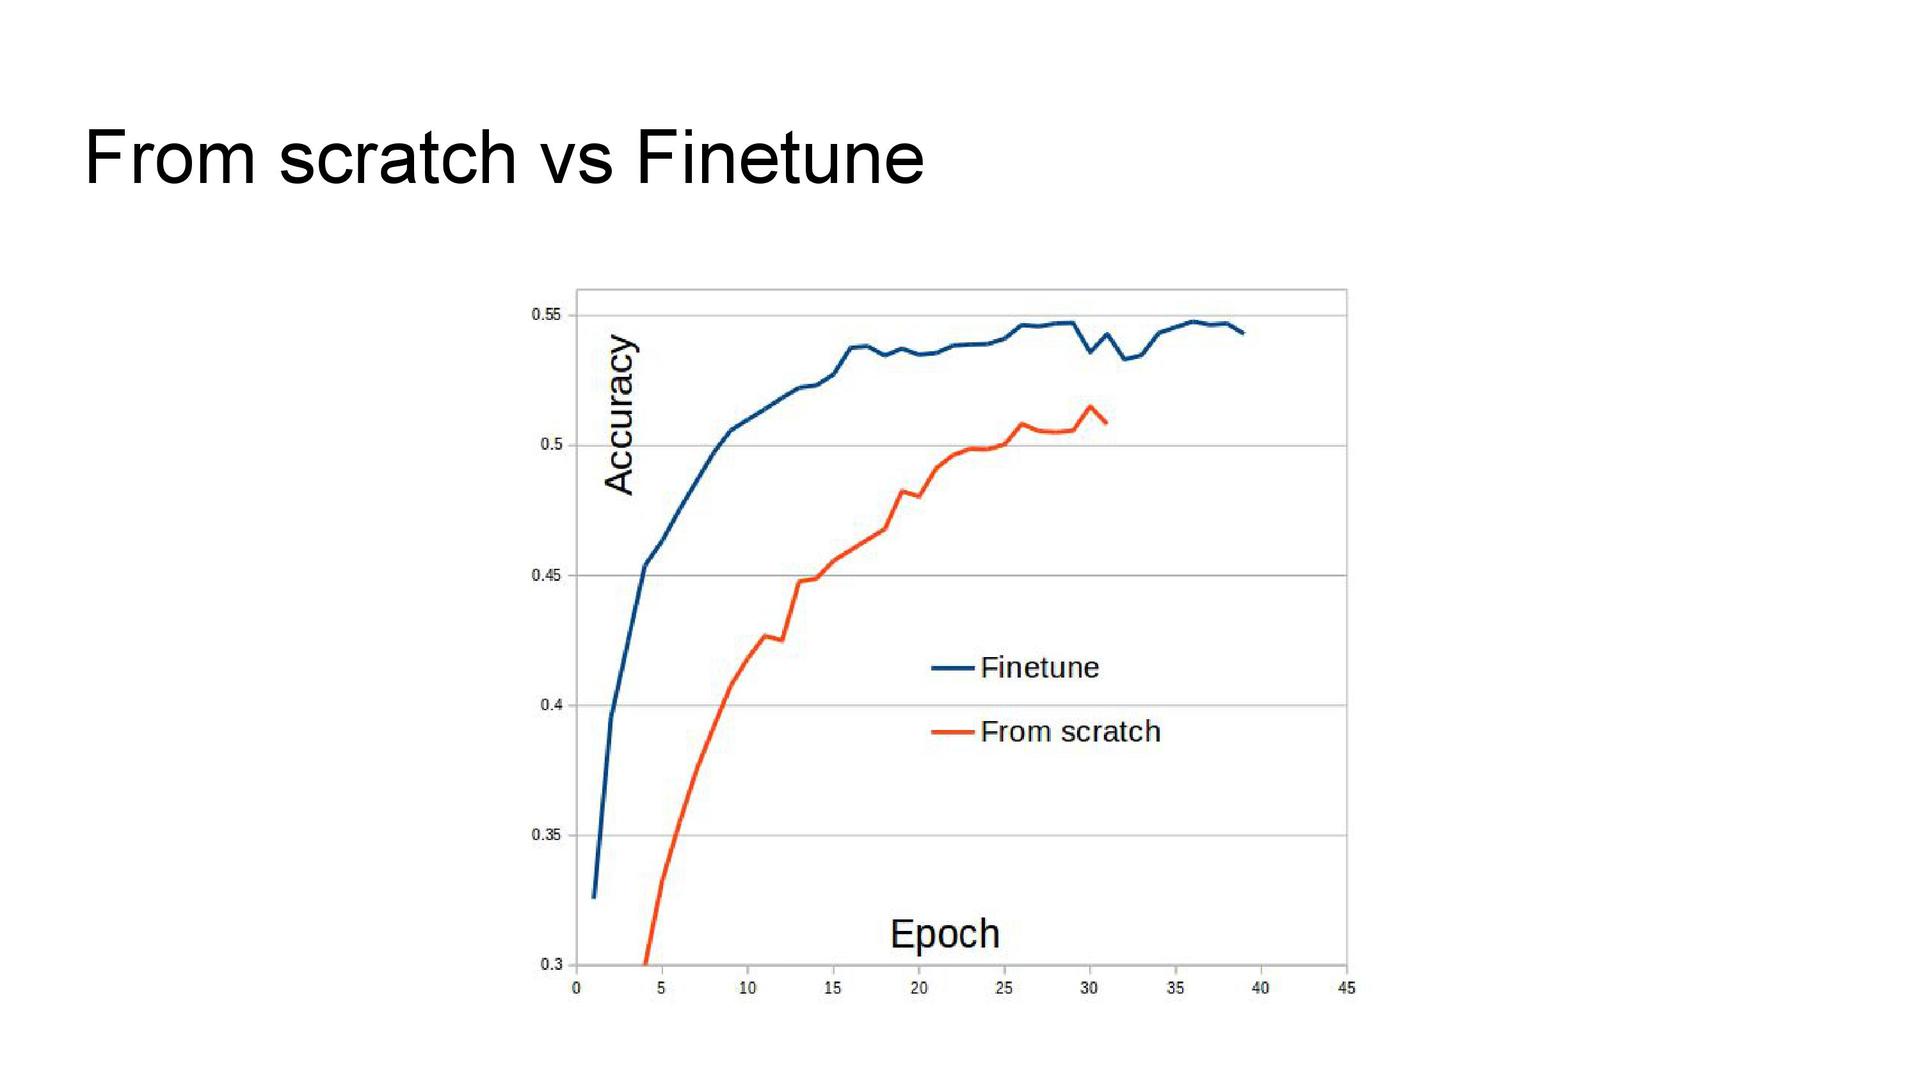
vs. fine-tuning . , , . .
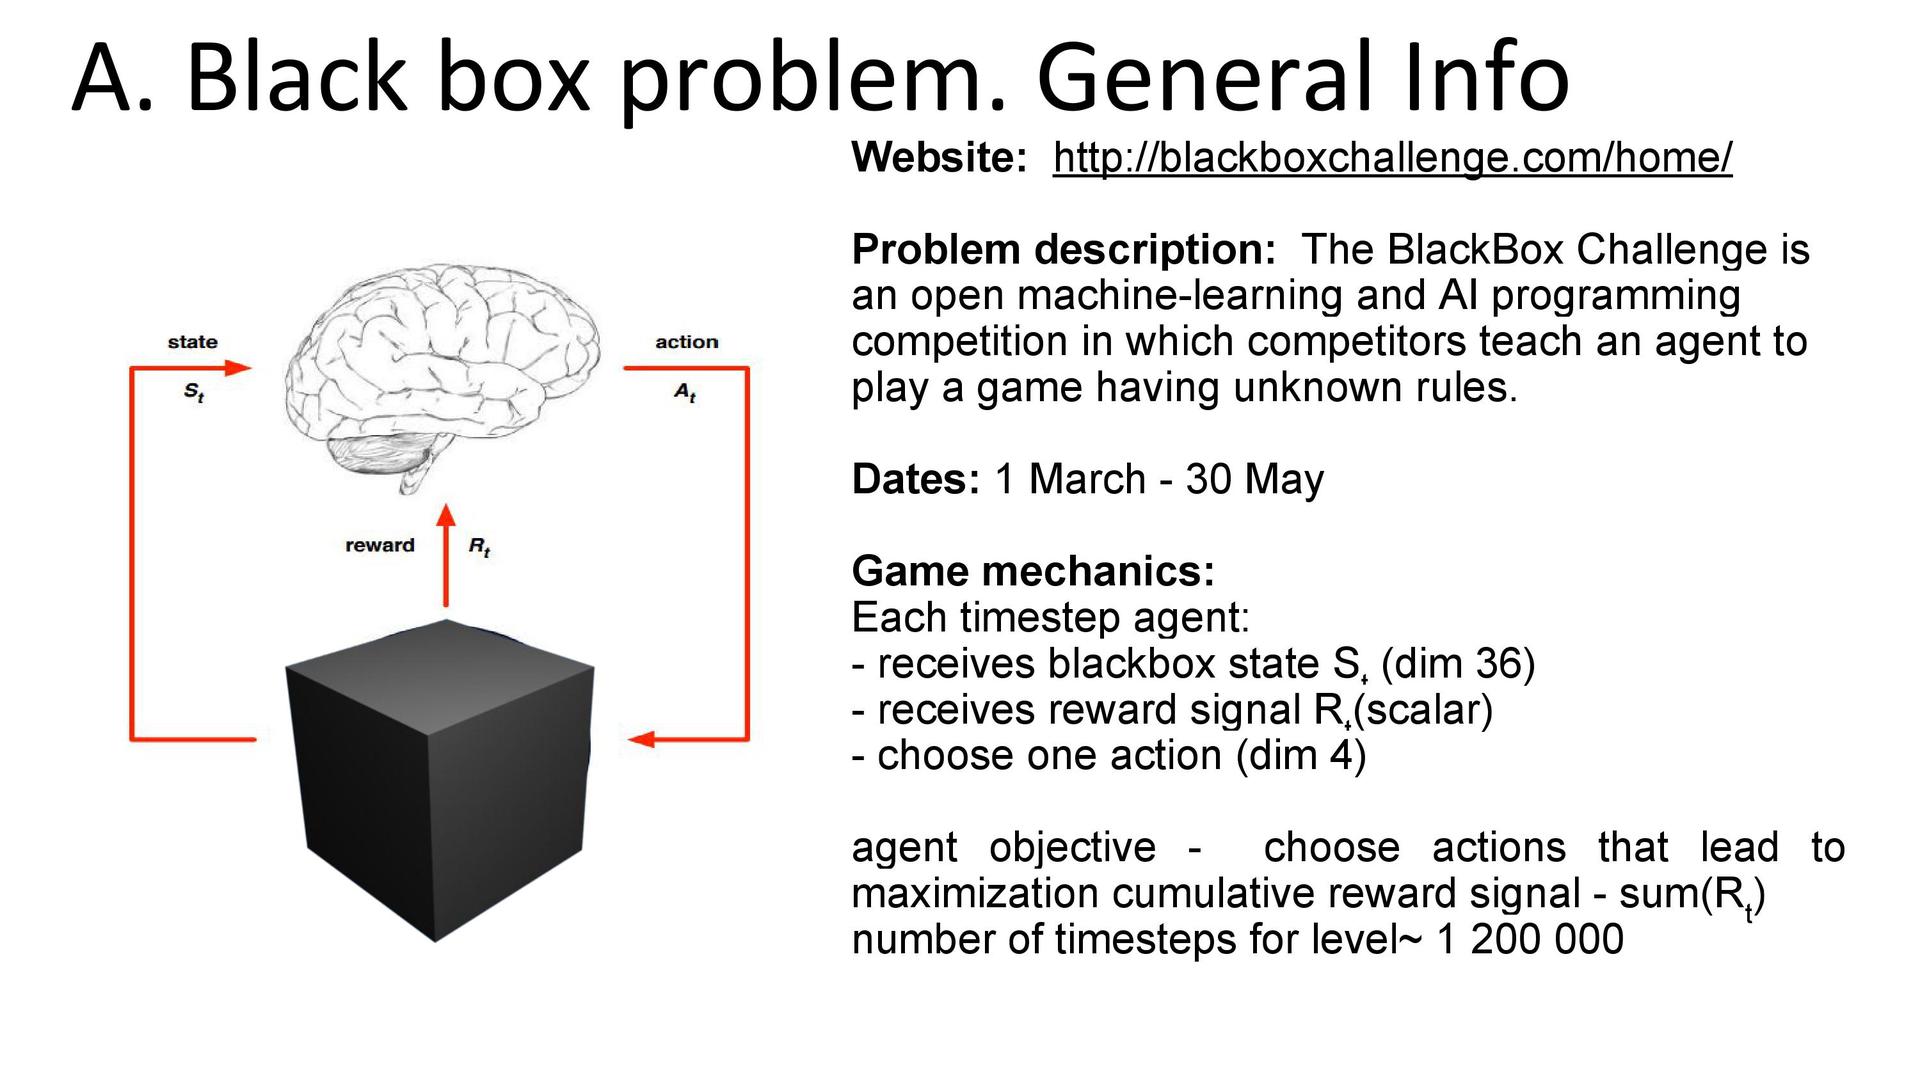
Black Box Challenge, , «». , «» . «», . — reinforcement learning.
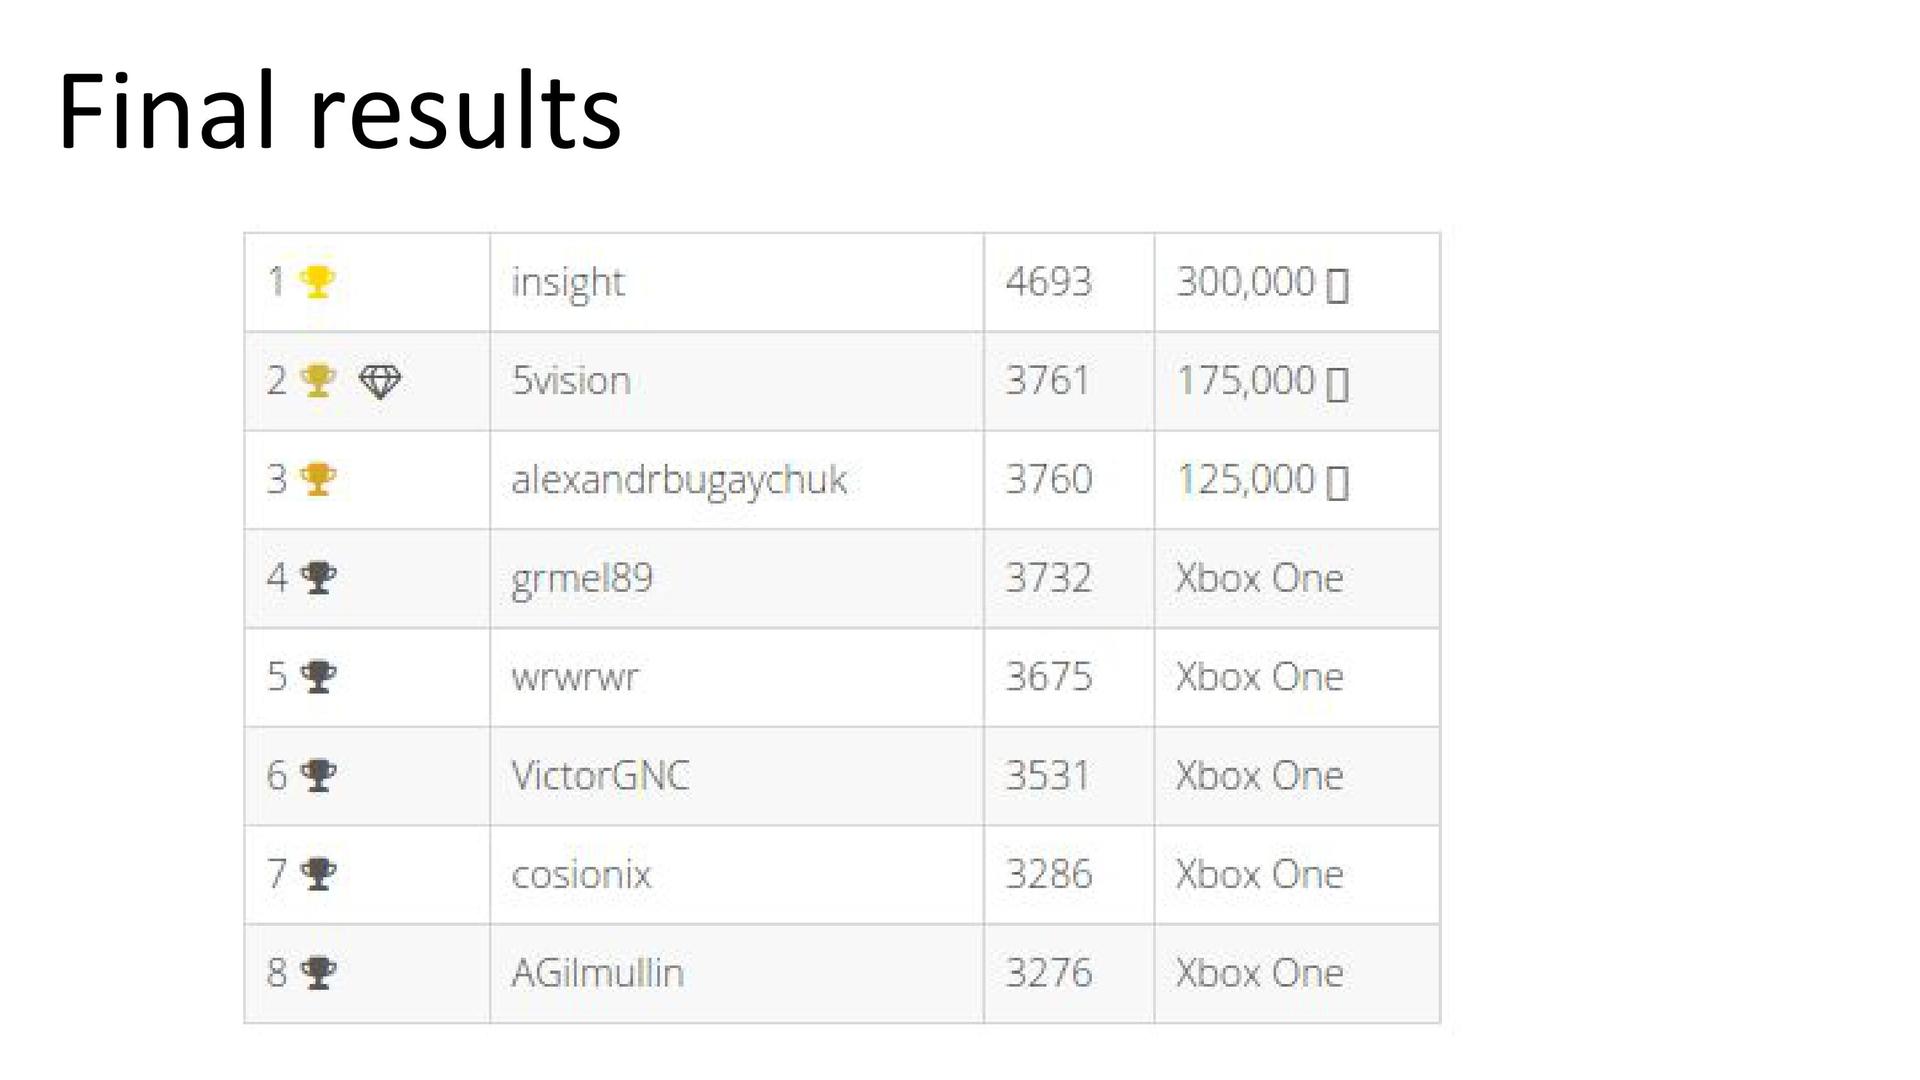
5vision. .
. «», . , , , . . 36 . . — .
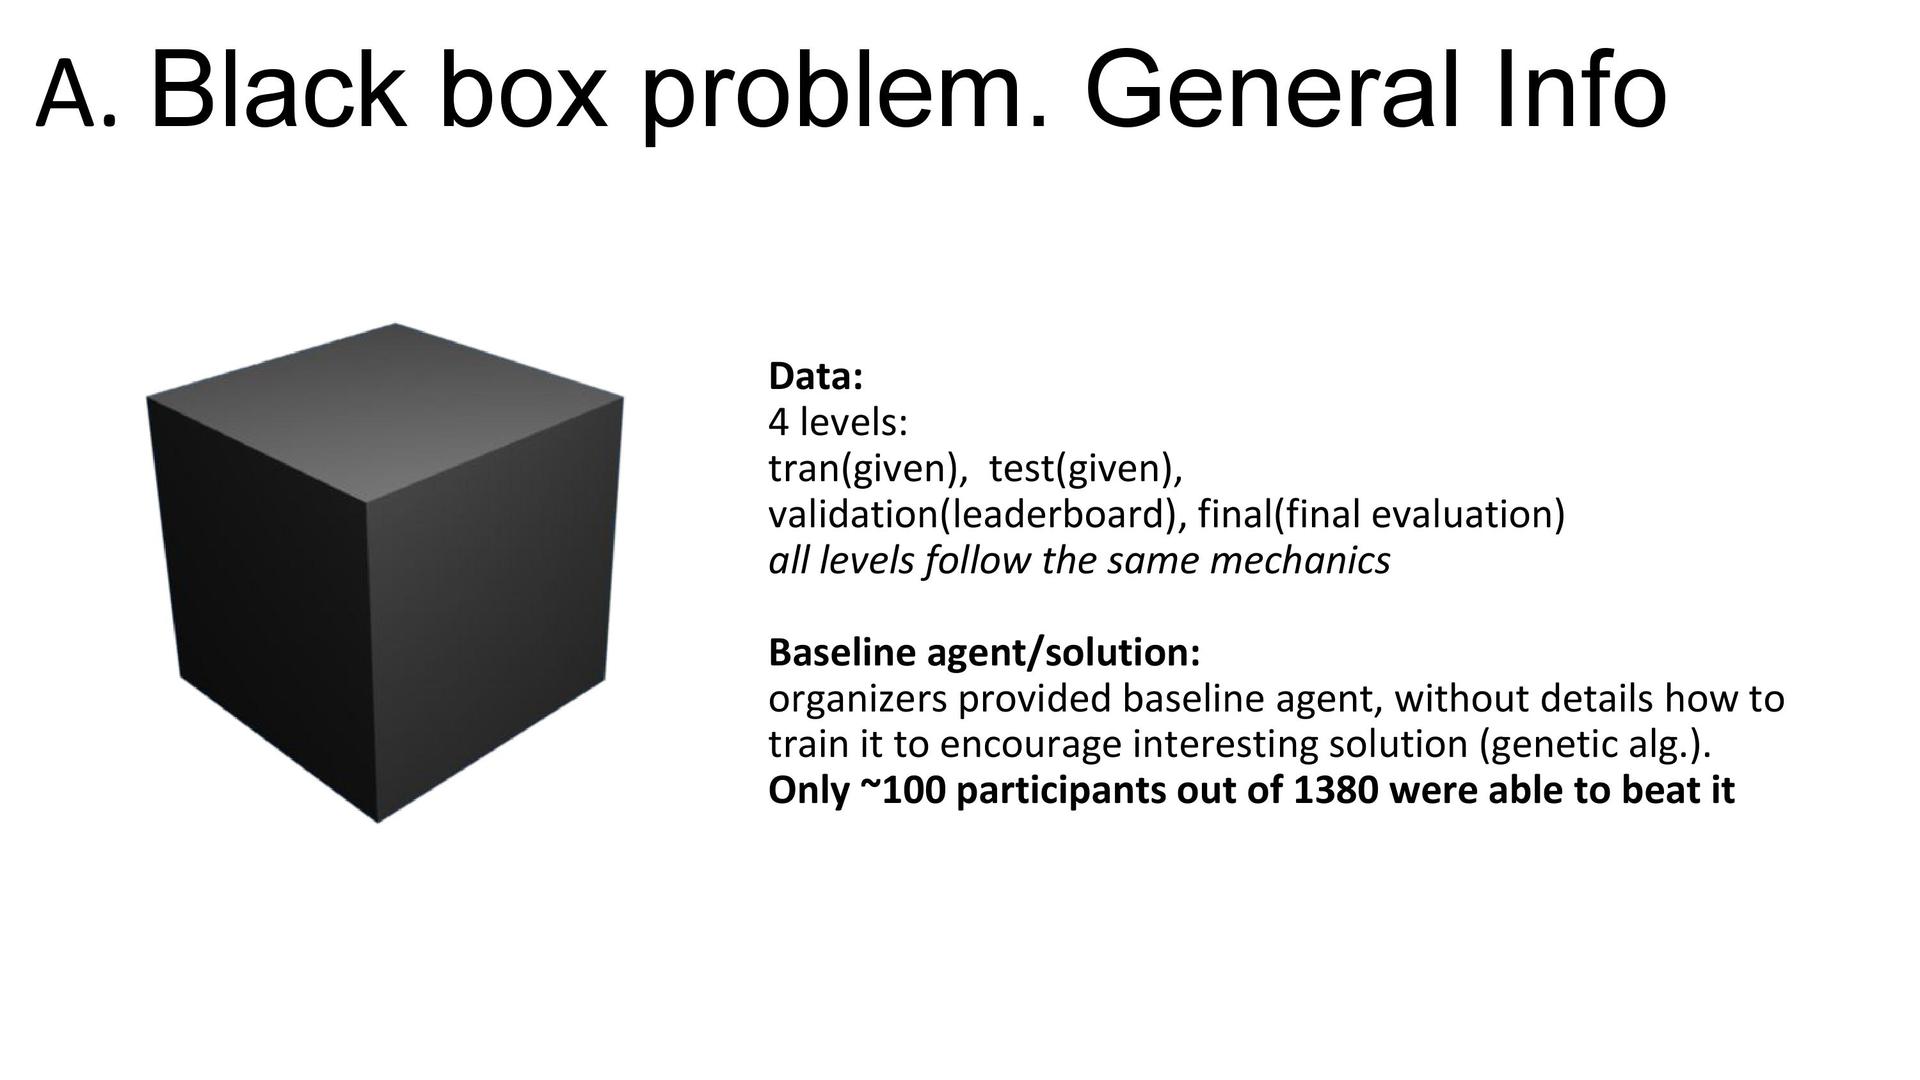
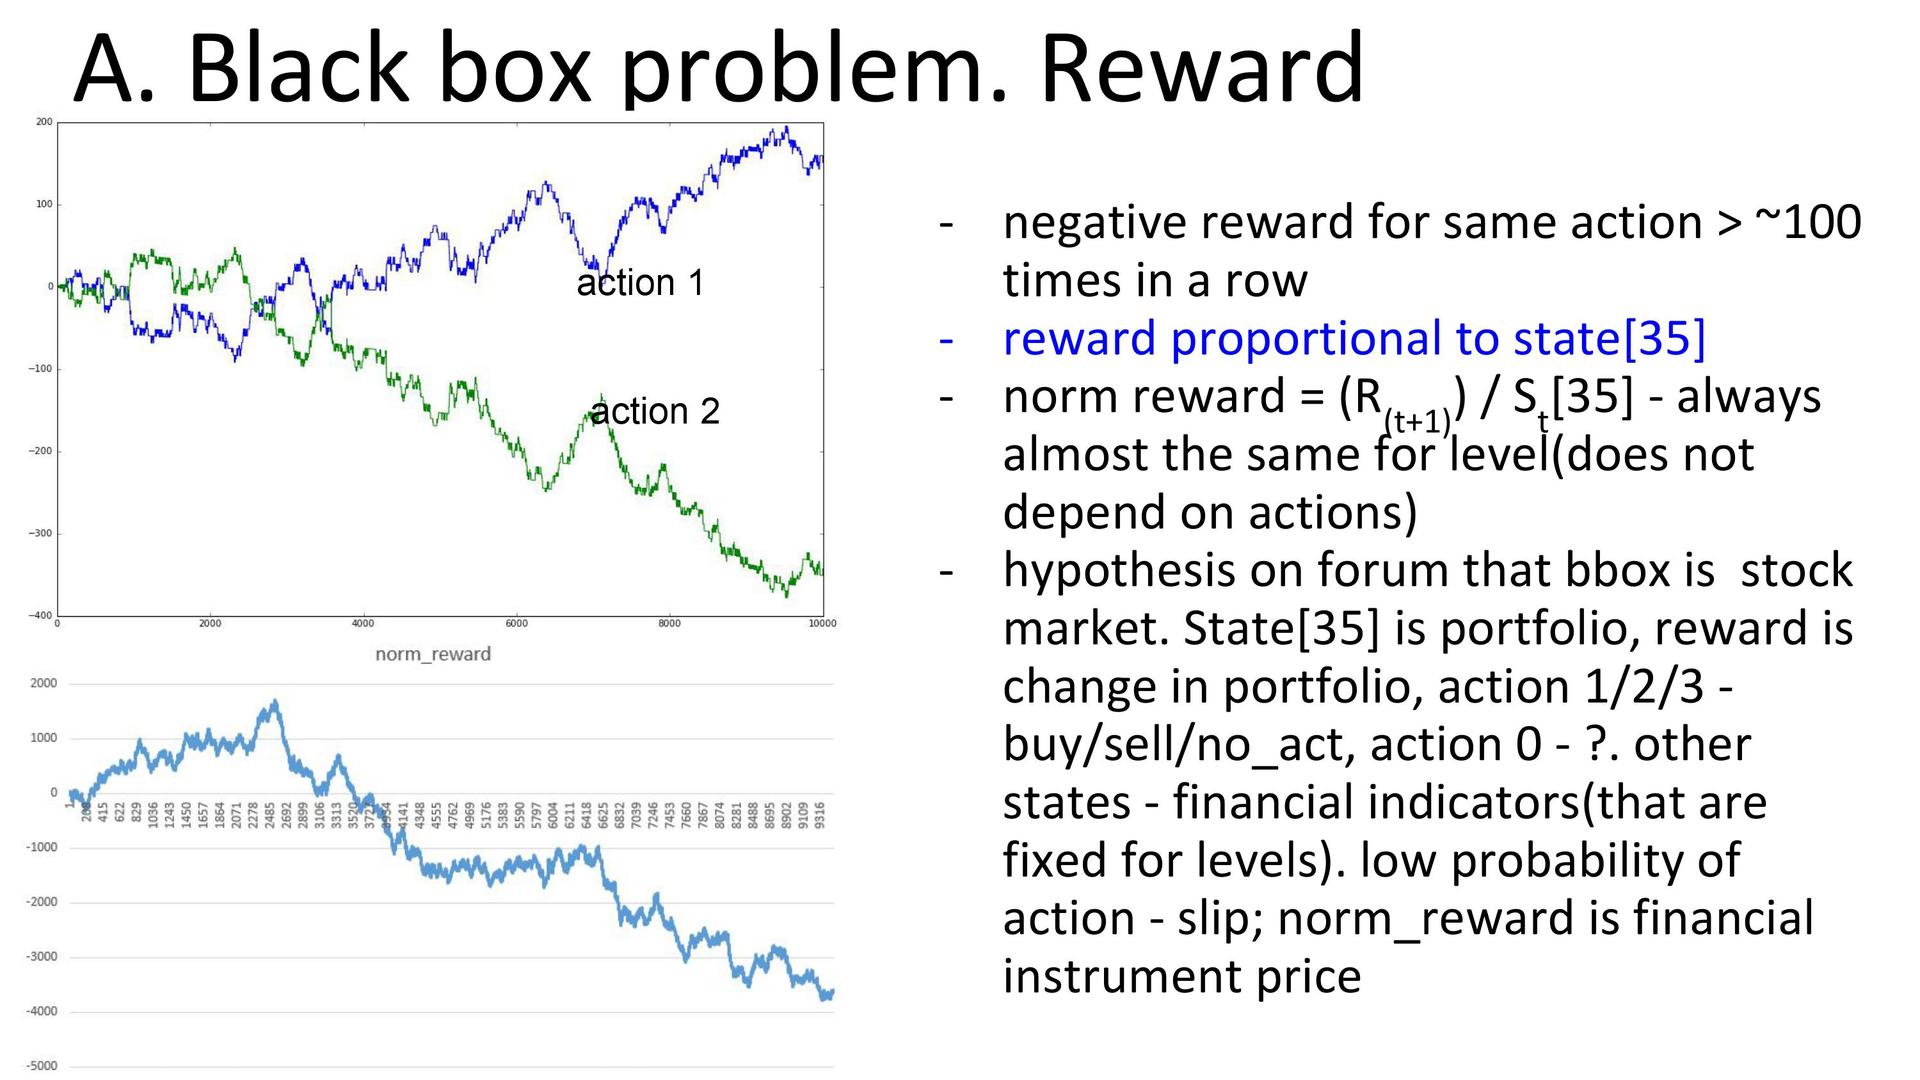
. , 35 36- . -: , . , : . , , 100 , . « » . - , 36- . , , 36- , — , . , .

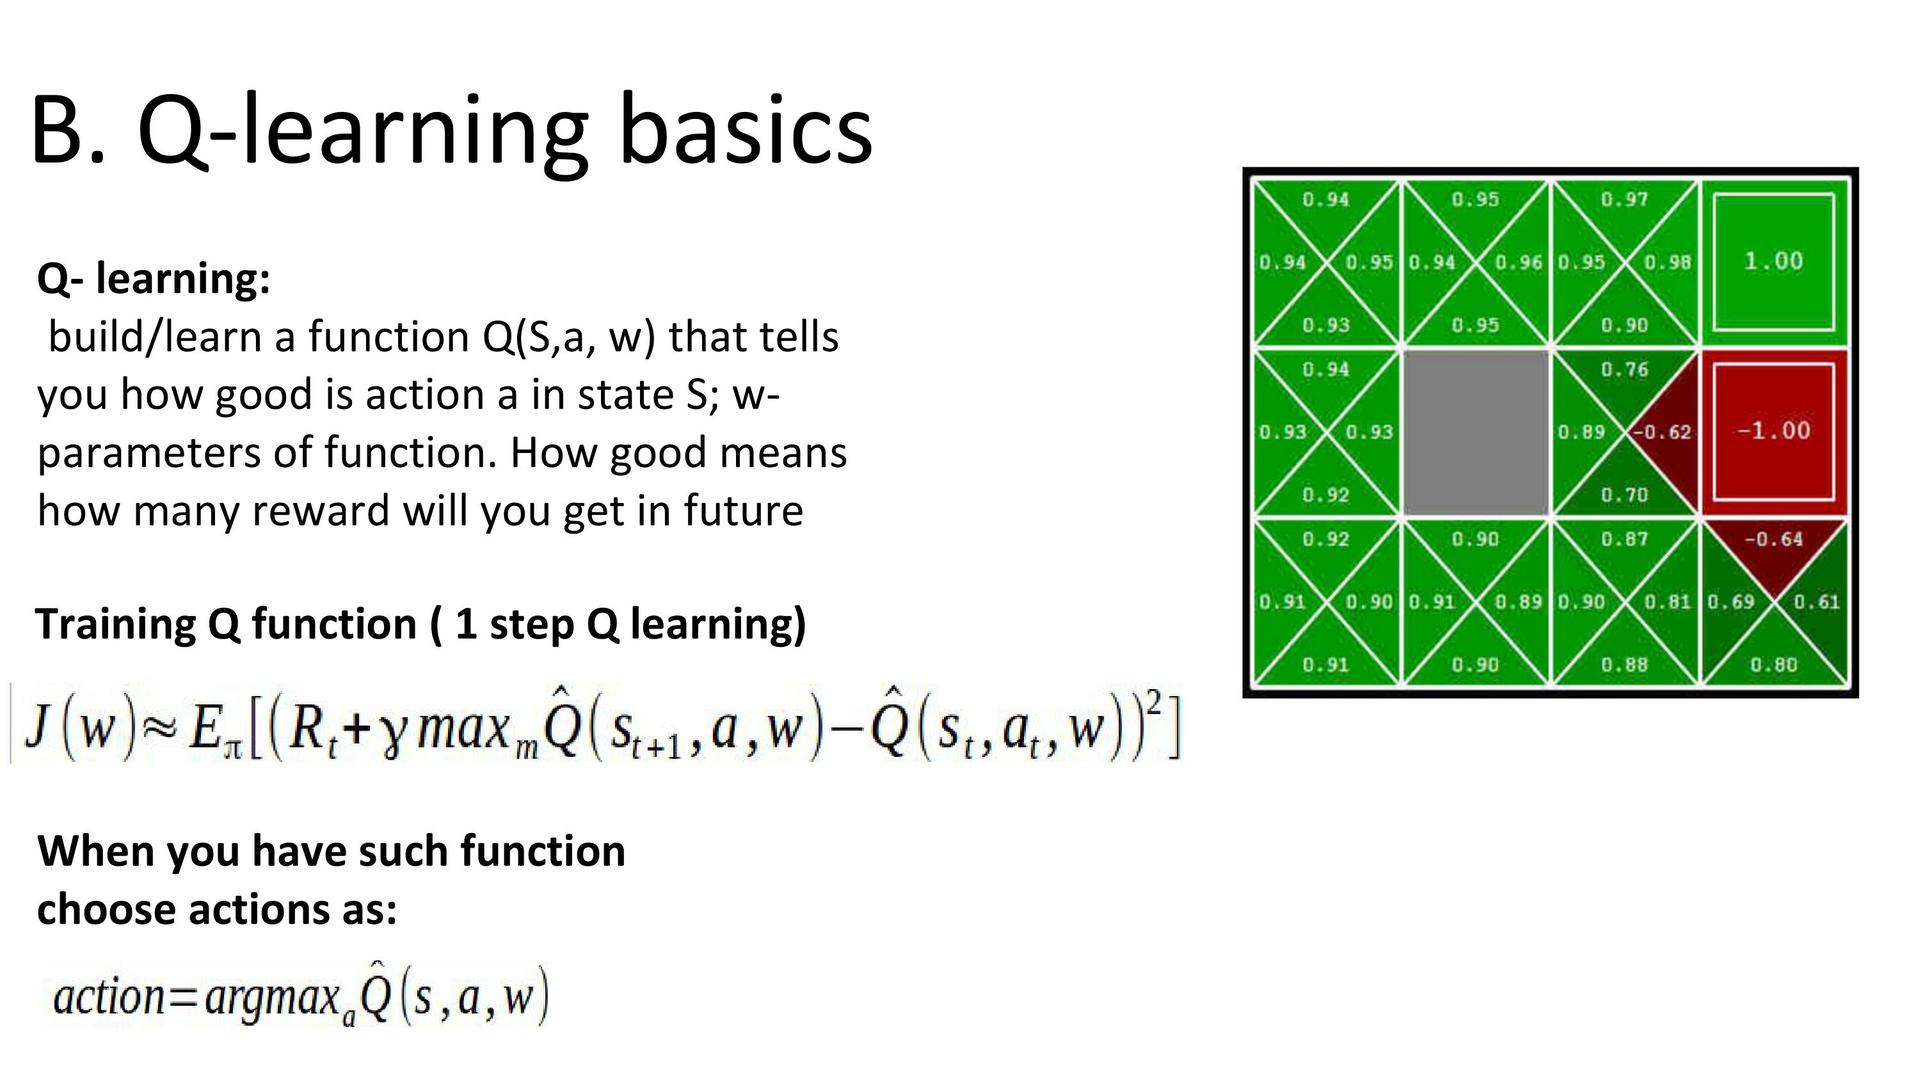
Q-learning . . q-learning. Q, . Q , «» . «» , , . . , . . q-learning ( , ). , , , , q-learning .
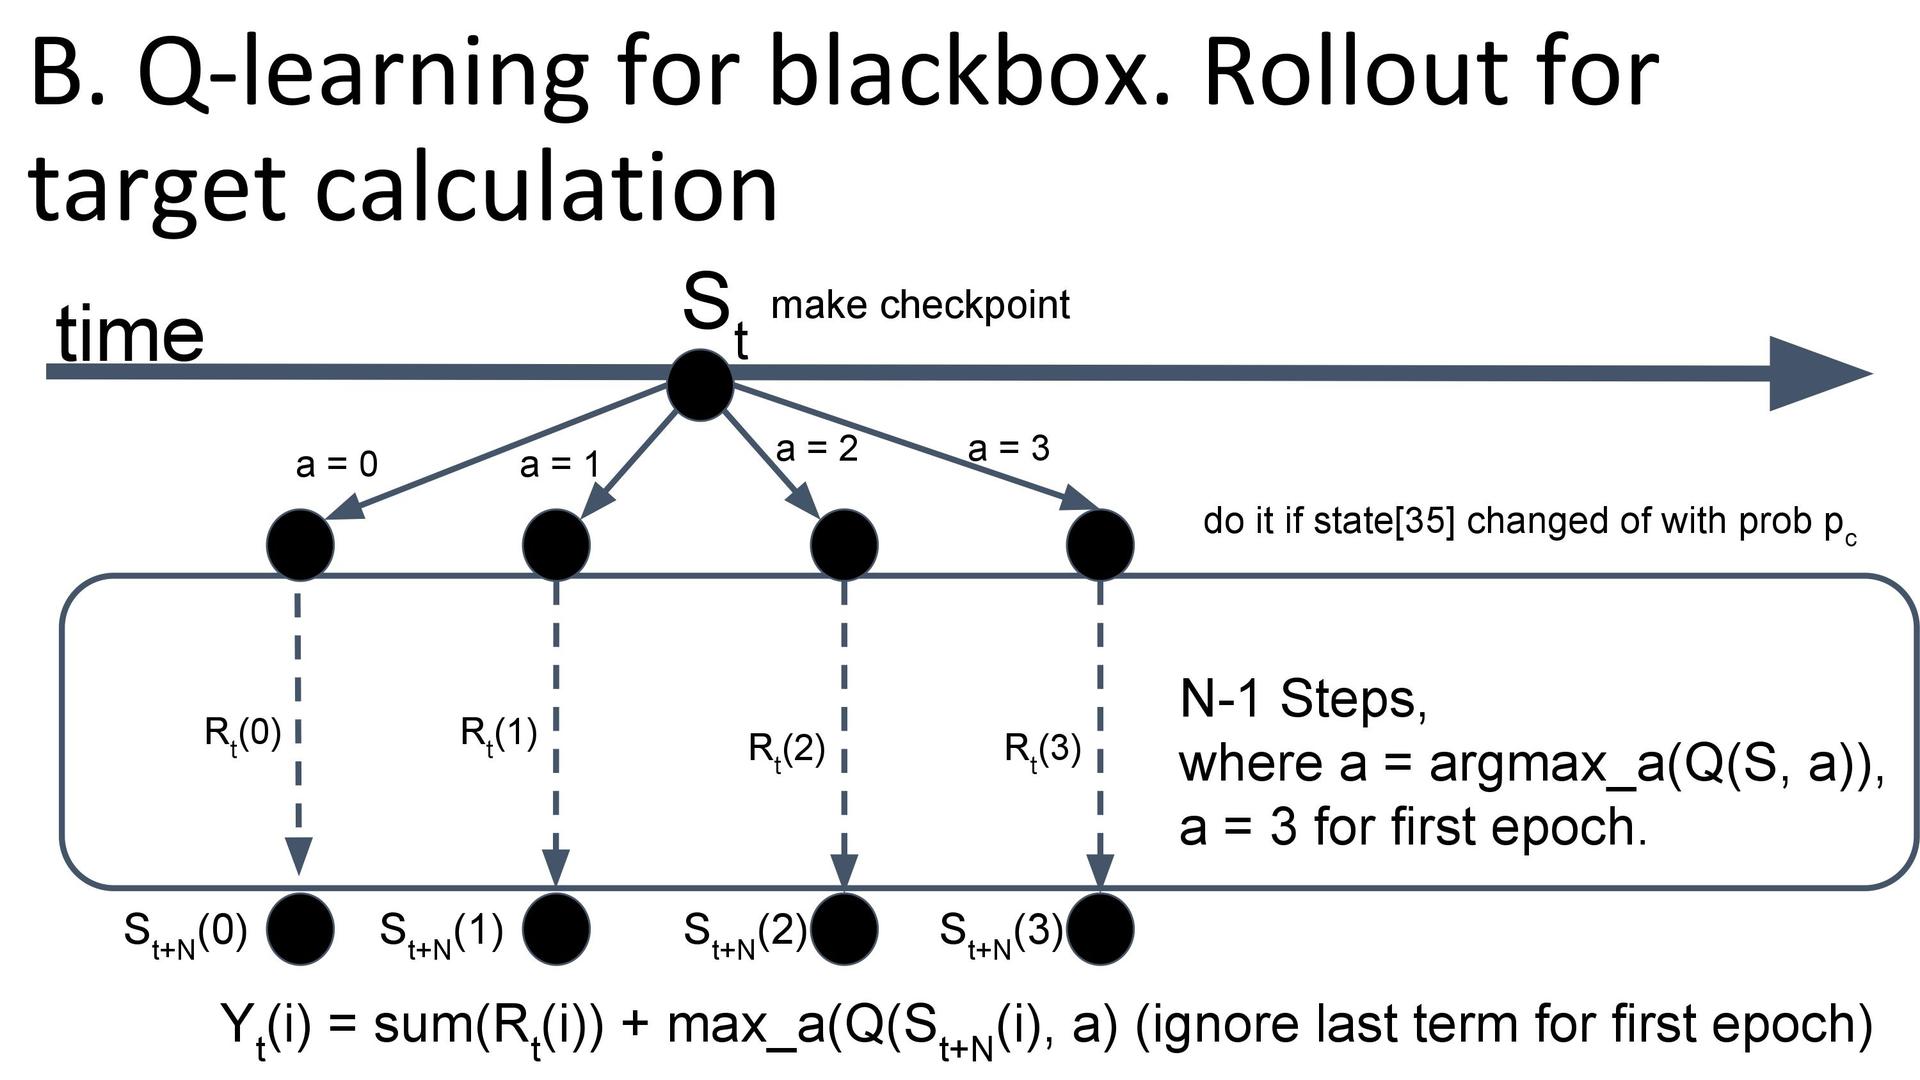
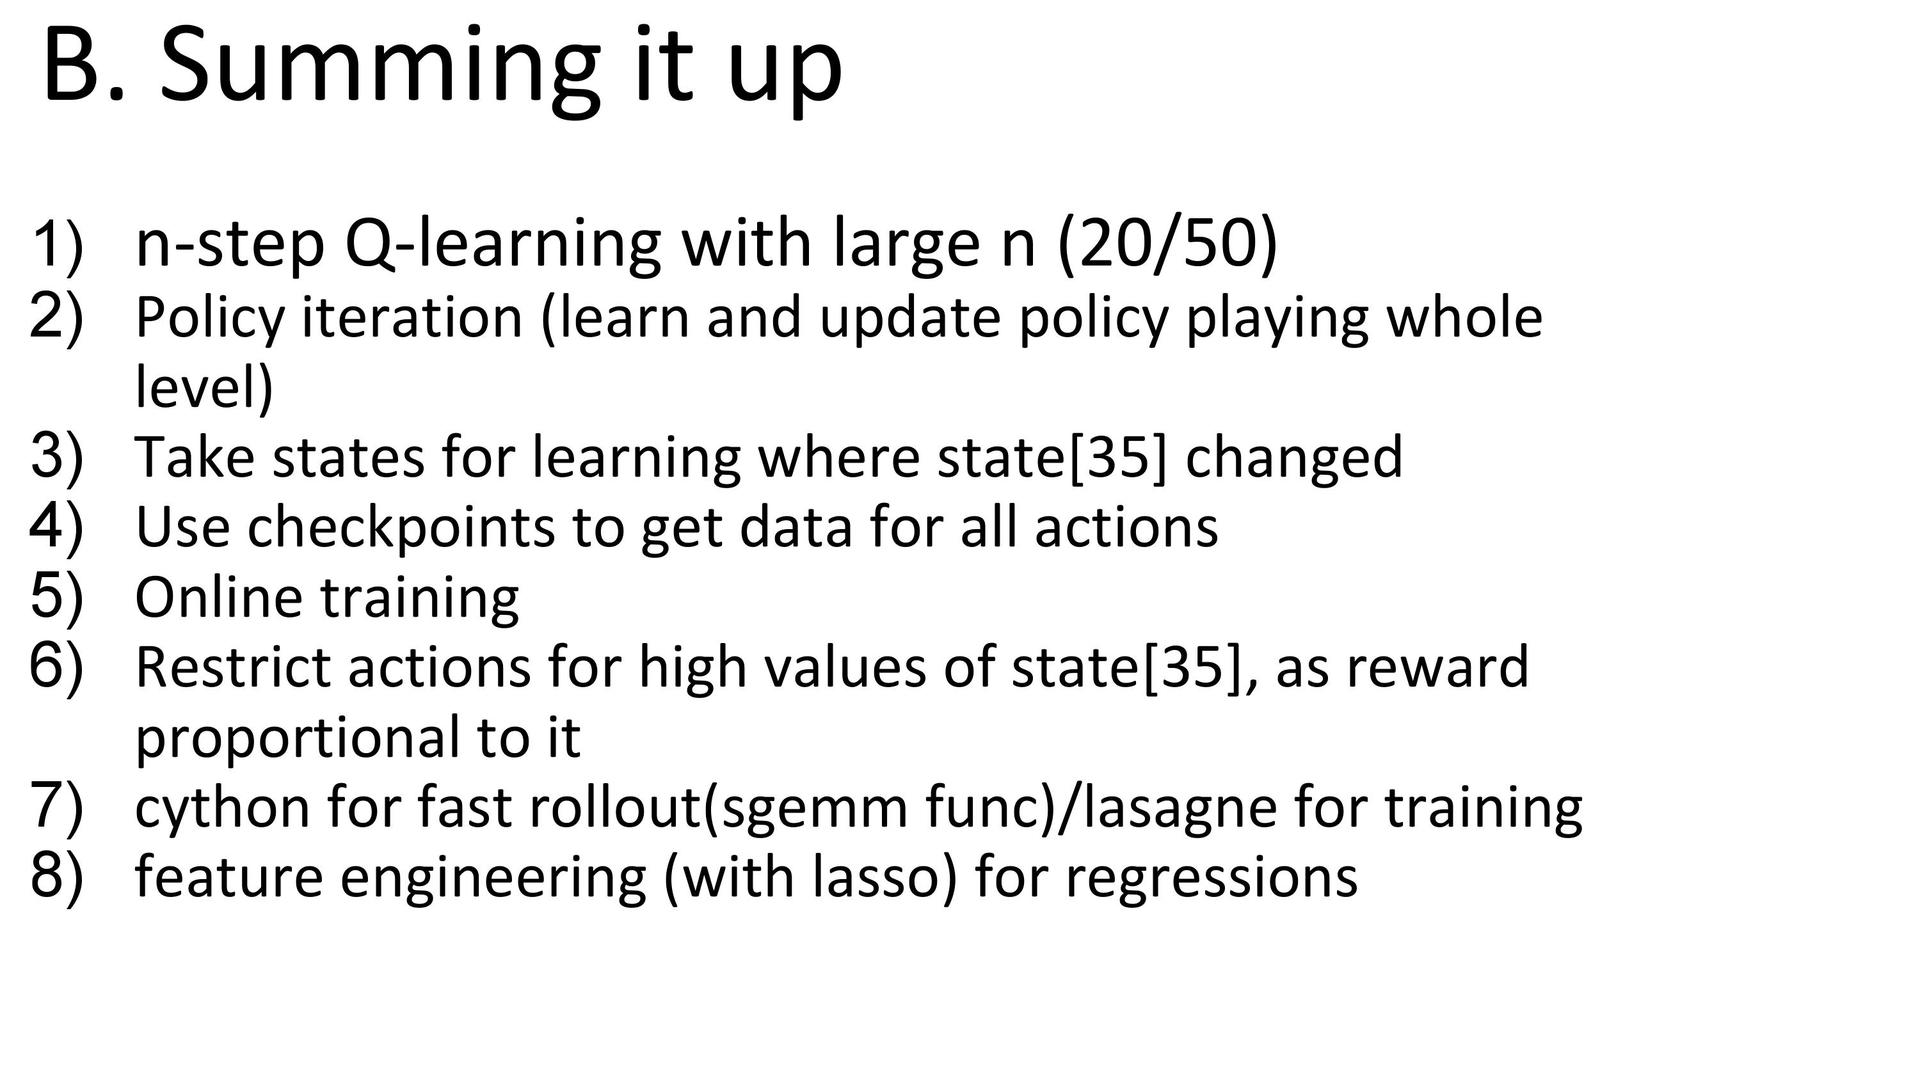
black box . , n-step q-learning, , n . , — , - . , q- , « 3». , .
. : ( ) , , q- — . , q- . — replay memory ( , ) , , — .

. ( ) . . ( Q-) . , -: ́ , . , .
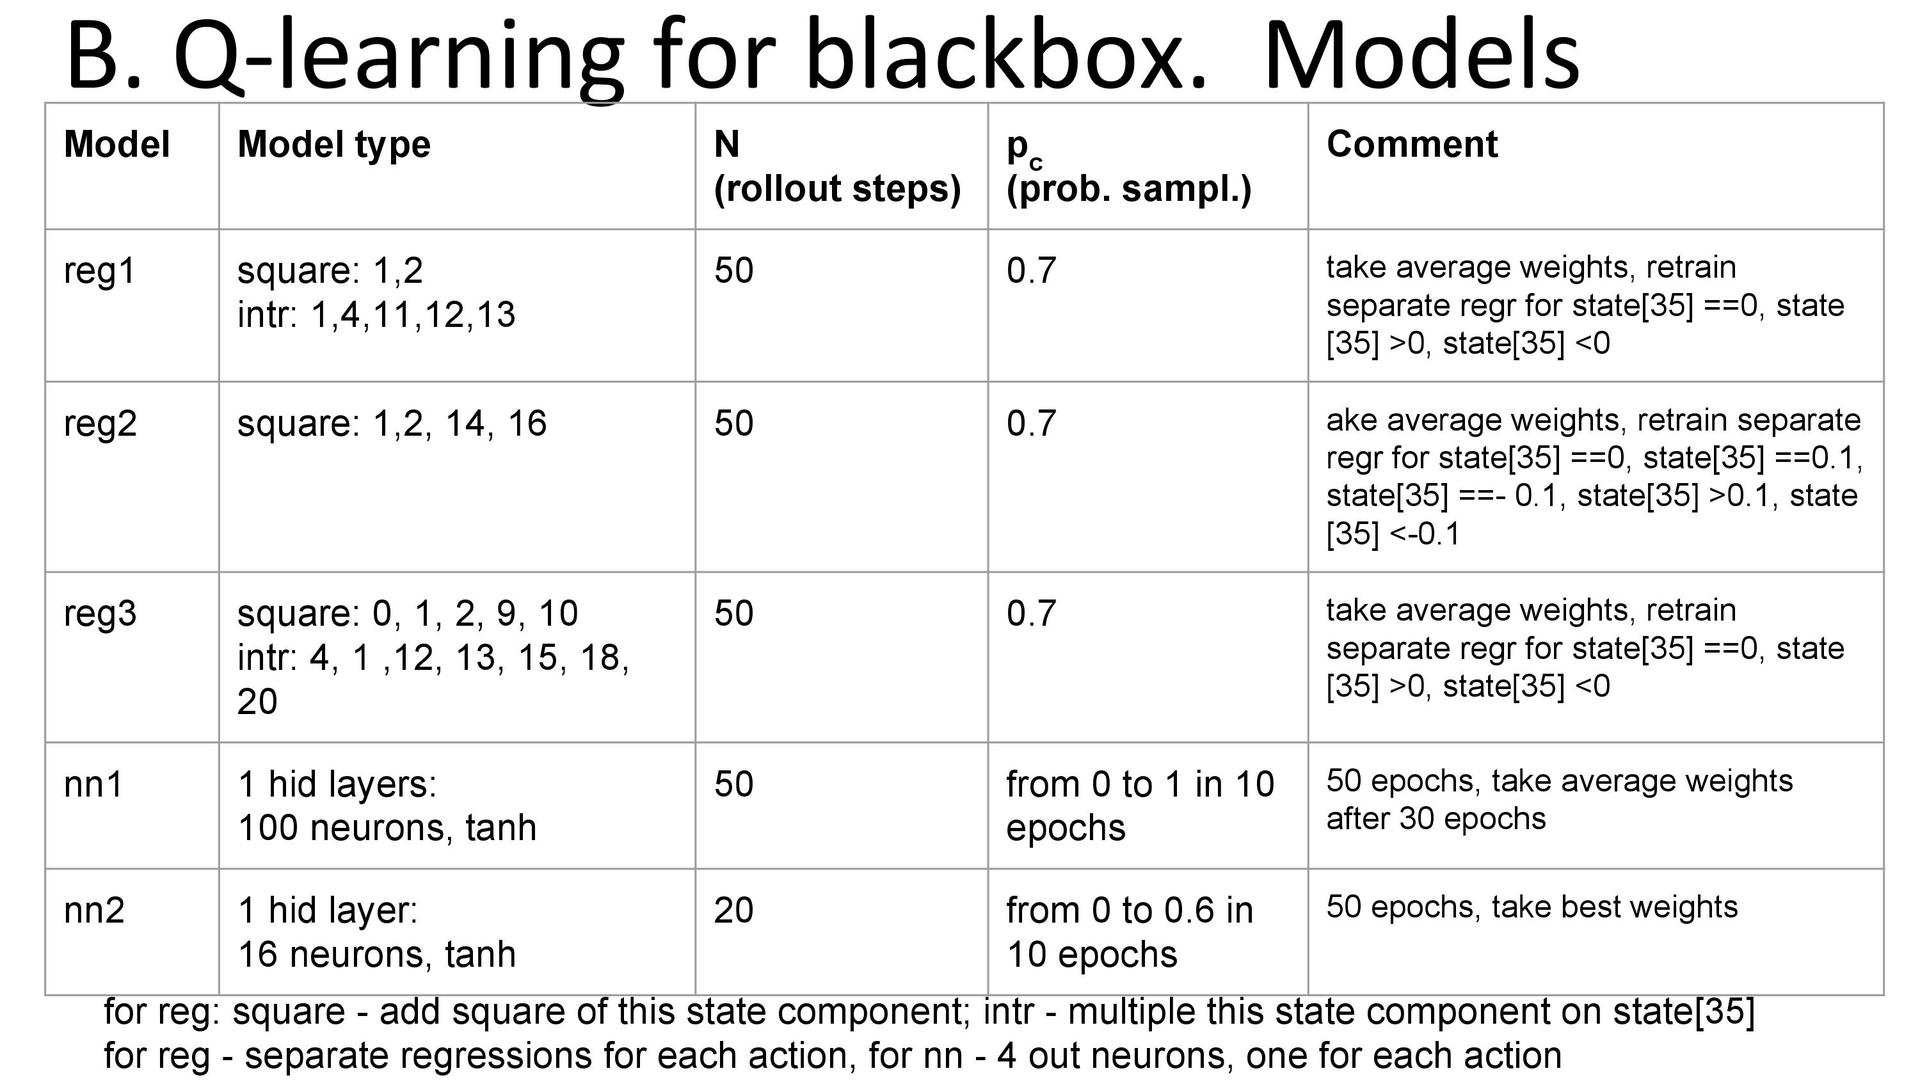
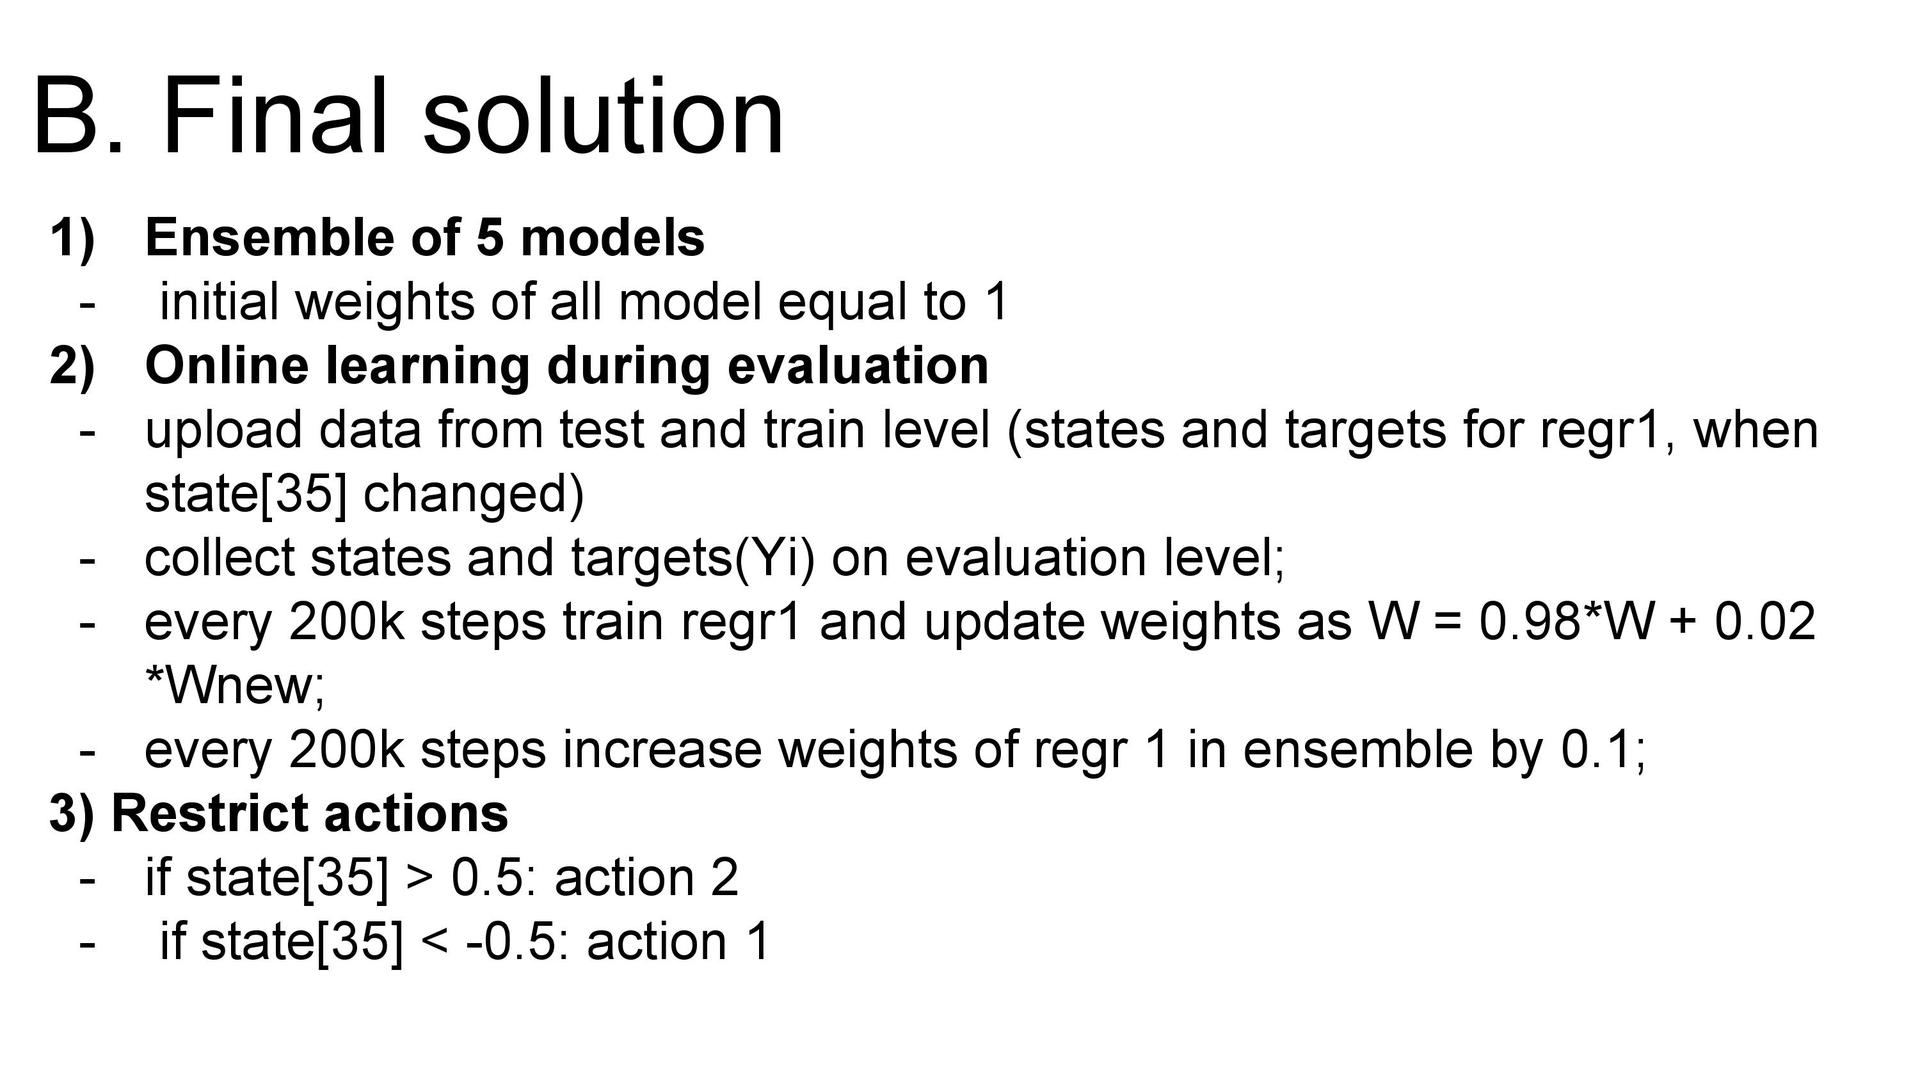
. , . , ( , ), , dueling- ( ) . - — , , .

. 5vision , «».
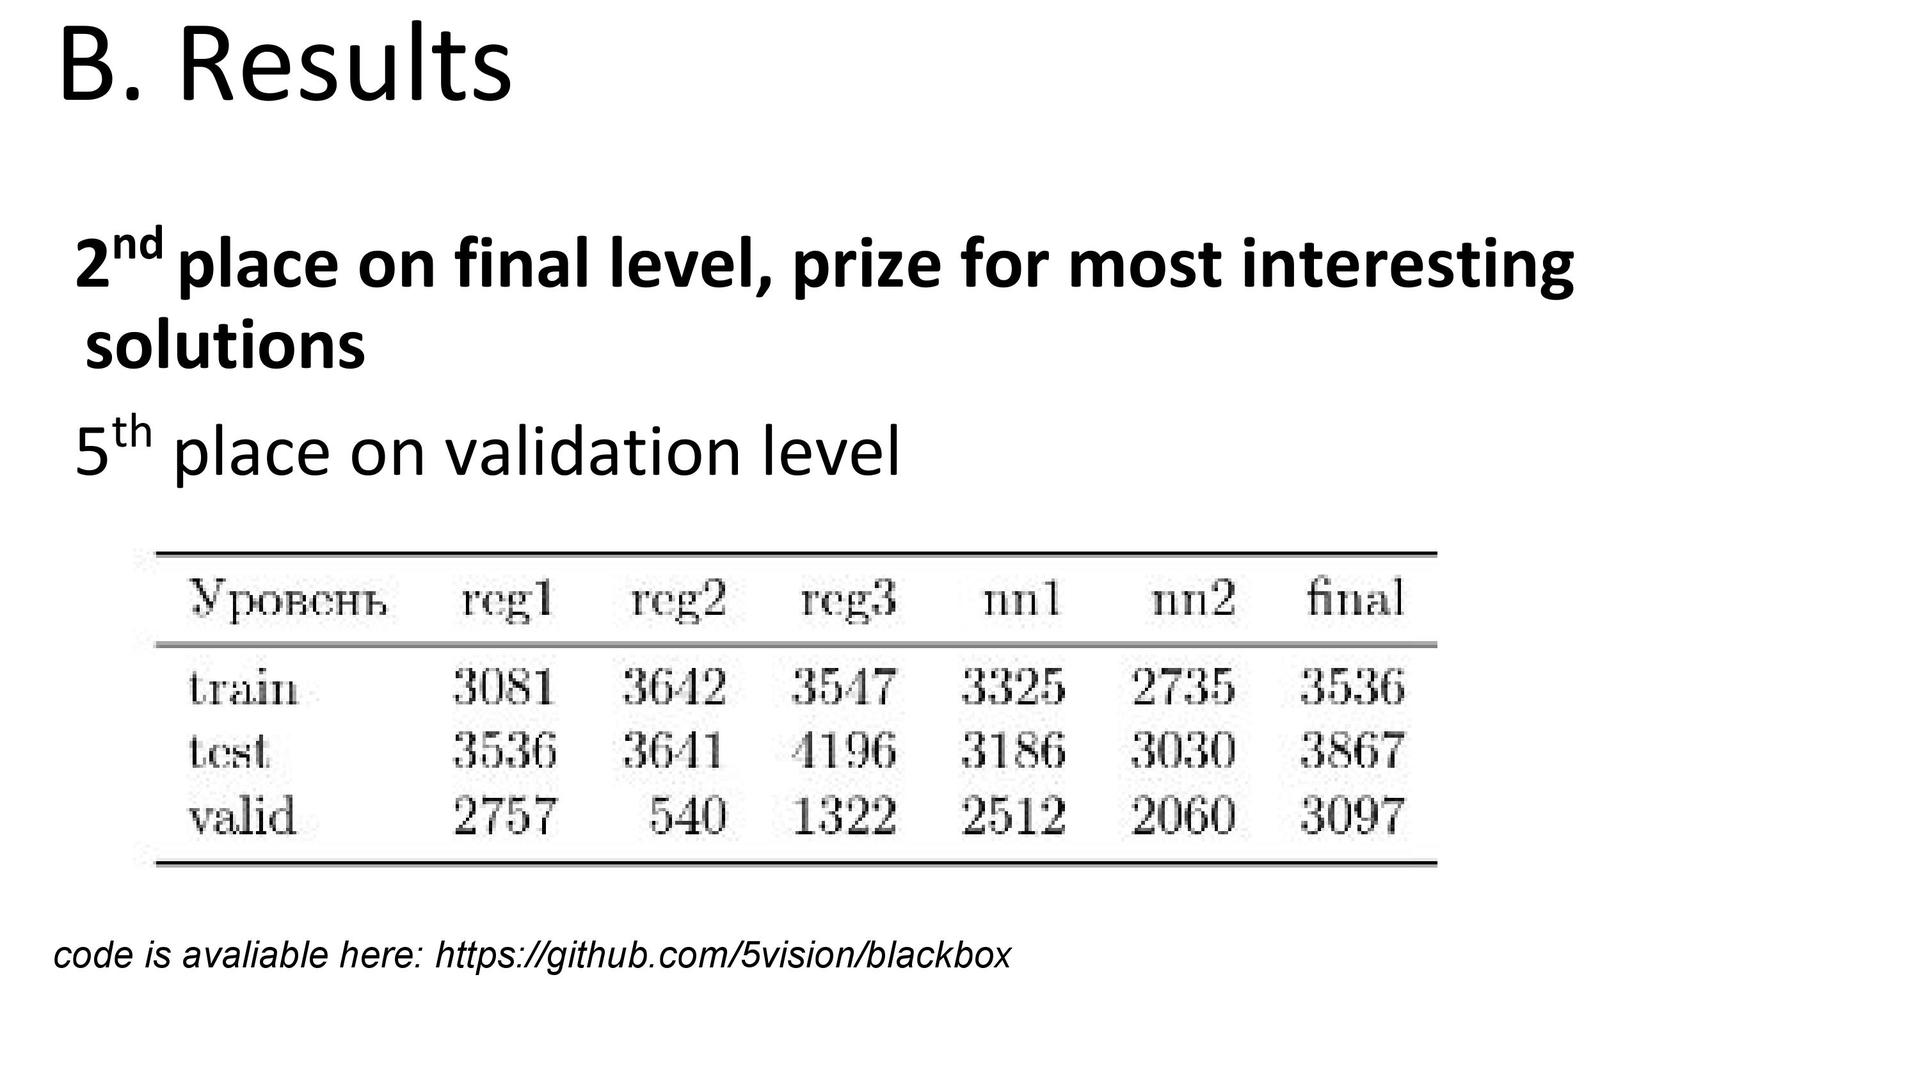
, ?
. — , ( ) — 60-80 . : , - . , , . , , , .
, : , . , . , , YouTube- . , -, , . , — .

That's all. , , , - , , — , data scientist. devops, , , . — , - .
, :
Many of you probably know or at least heard about Kaggle . For those who have not heard: Kaggle is the platform on which companies hold contests to create predictive models. Its popularity is so great that experts often understand the contests themselves as “Cags”. The winner of each competition is determined automatically by the metric that the organizer has appointed. Among others, Kaggle at various times tried Facebook, Microsoft and the current site owner , Google. Yandex also noted several times. As a rule, the Kaggle community is given to solve problems that are quite close to real: this, on the one hand, makes the competition interesting, and on the other, it promotes the company as an employer with solid tasks. However, if you are told that the company-organizer of the competition involved in its service the algorithm of one of the winners - do not believe it. Usually, solutions from the top are too complex and insufficiently productive, while chasing, in thousandths, the values of the metrics are not so necessary in practice. Therefore, the organizers are more interested in the approaches and the ideological part of the algorithms.
')
Kaggle is not the only platform for data analysis competitions. There are others: DrivenData , DataScience.net , CodaLab . In addition, competitions are held in the framework of scientific conferences related to machine learning: SIGKDD, RecSys, CIKM.
For a successful solution, it is necessary, on the one hand, to study the theory, and on the other hand, to start practicing the use of various approaches and models. In other words, participation in “logs” is quite capable of making you data analytics. The question is - how to learn to participate in them?
Three years ago, several ShAD students began to gather and solve various interesting tasks, including those taken from Kaggle. For example, among these guys was the current winner of the second place and the recent leader of the Kaggle rating, Stanislav Semyonov. Over time, the meetings received the name of machine-training sessions. They gained popularity, the participants began to regularly take prizes and tell each other about their decisions, share experiences.
To understand exactly what we do in training, I will give a few examples. In each example, first there is a video with a story, and then a text based on the video.
The task of classifying car images
Link to MachineLearning.ru.
Last year, Avito held a series of contests. Including - a car brand recognition contest, the winner of which, Yevgeny Nizhibitsky, told about his decision at the training.
Task setting . It is necessary to determine the make and model of the car images. The metric was the accuracy of predictions, that is, the proportion of correct answers. The sample consisted of three parts: the first part was available for training initially, the second was given later, and the third was required to show the final predictions.
Computational resources . I used my home computer, which had been heating my room all this time, and the servers provided at work.
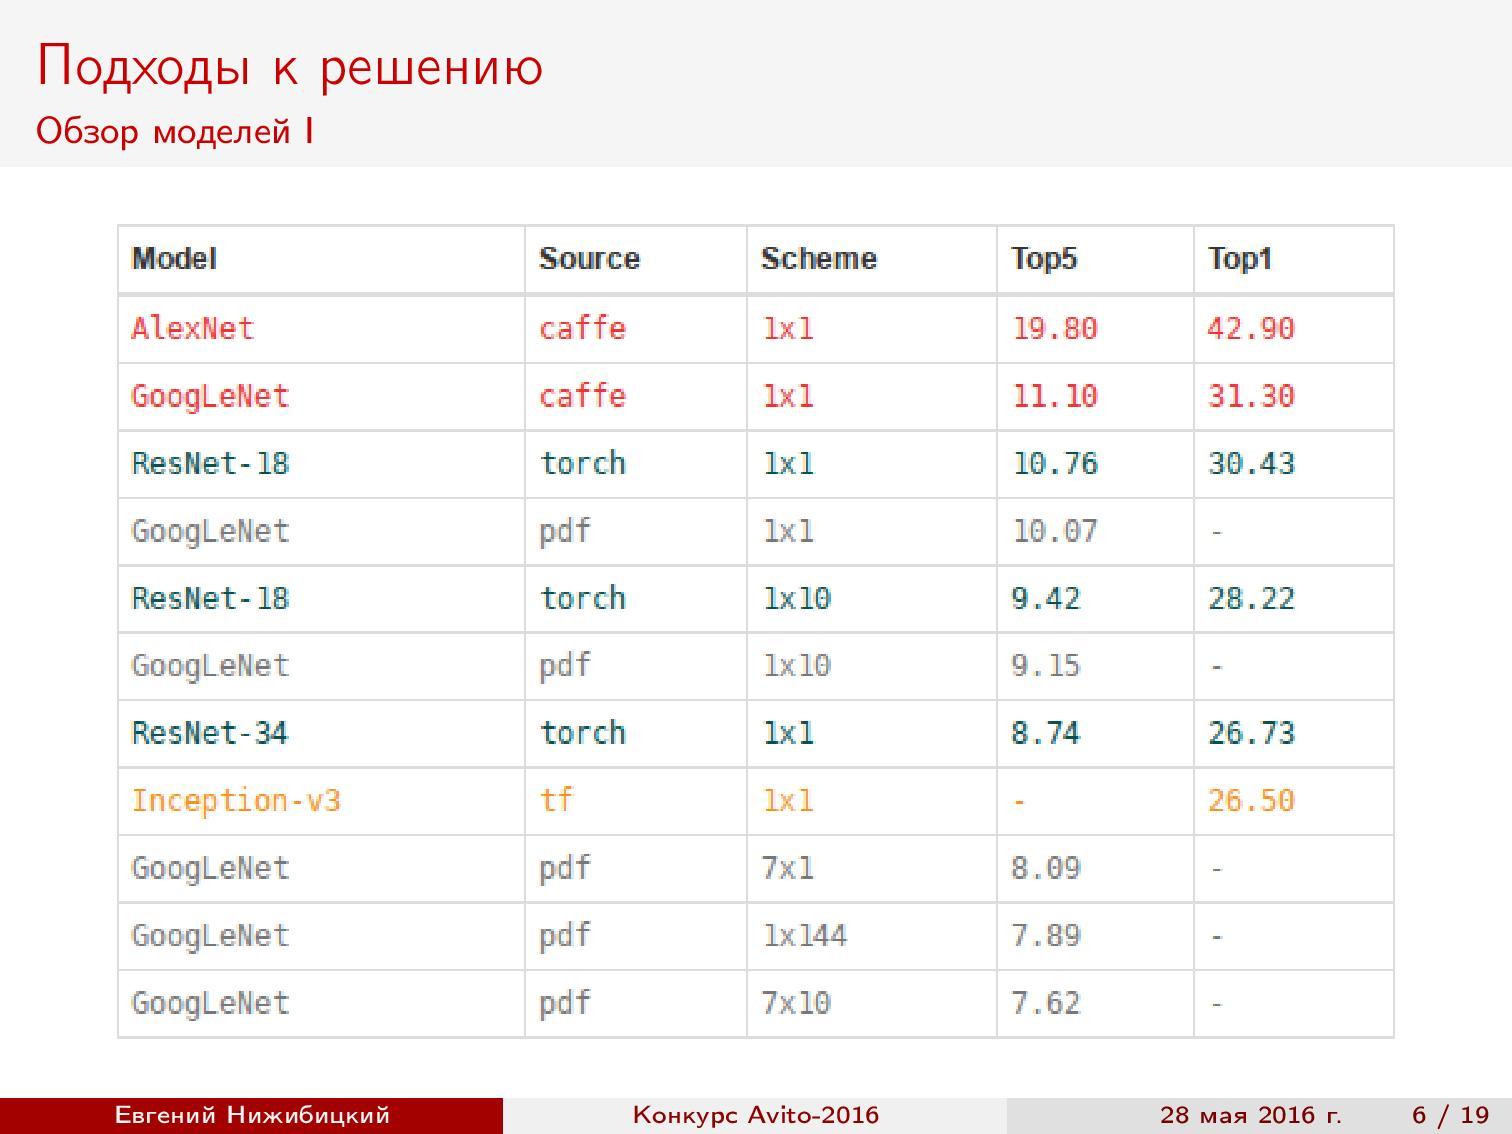
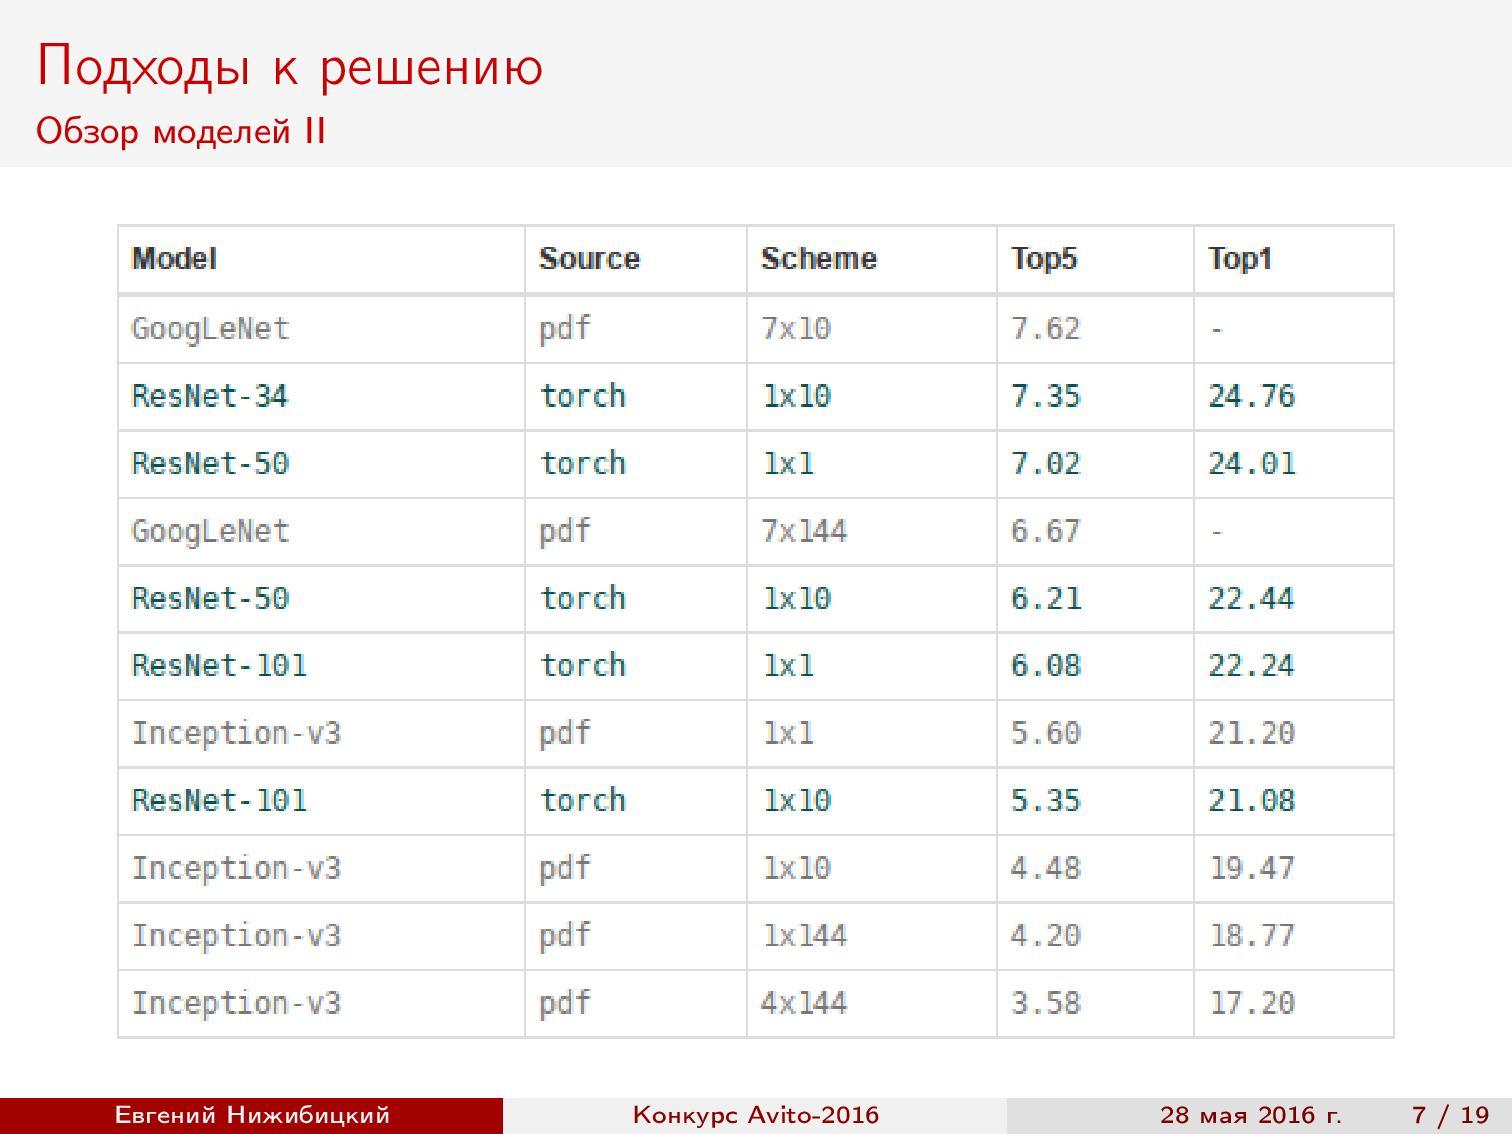
Review of models . Since our task is to recognize, the first thing I want is to take advantage of the progress in the quality of image classification on the well-known ImageNet . As is known, modern architectures make it possible to achieve even higher quality than that of humans. Therefore, I began with a review of recent articles and collected a summary table of architectures, implementations and qualities based on ImageNet.
Note that the best quality is achieved on the Inception and ResNet architectures .
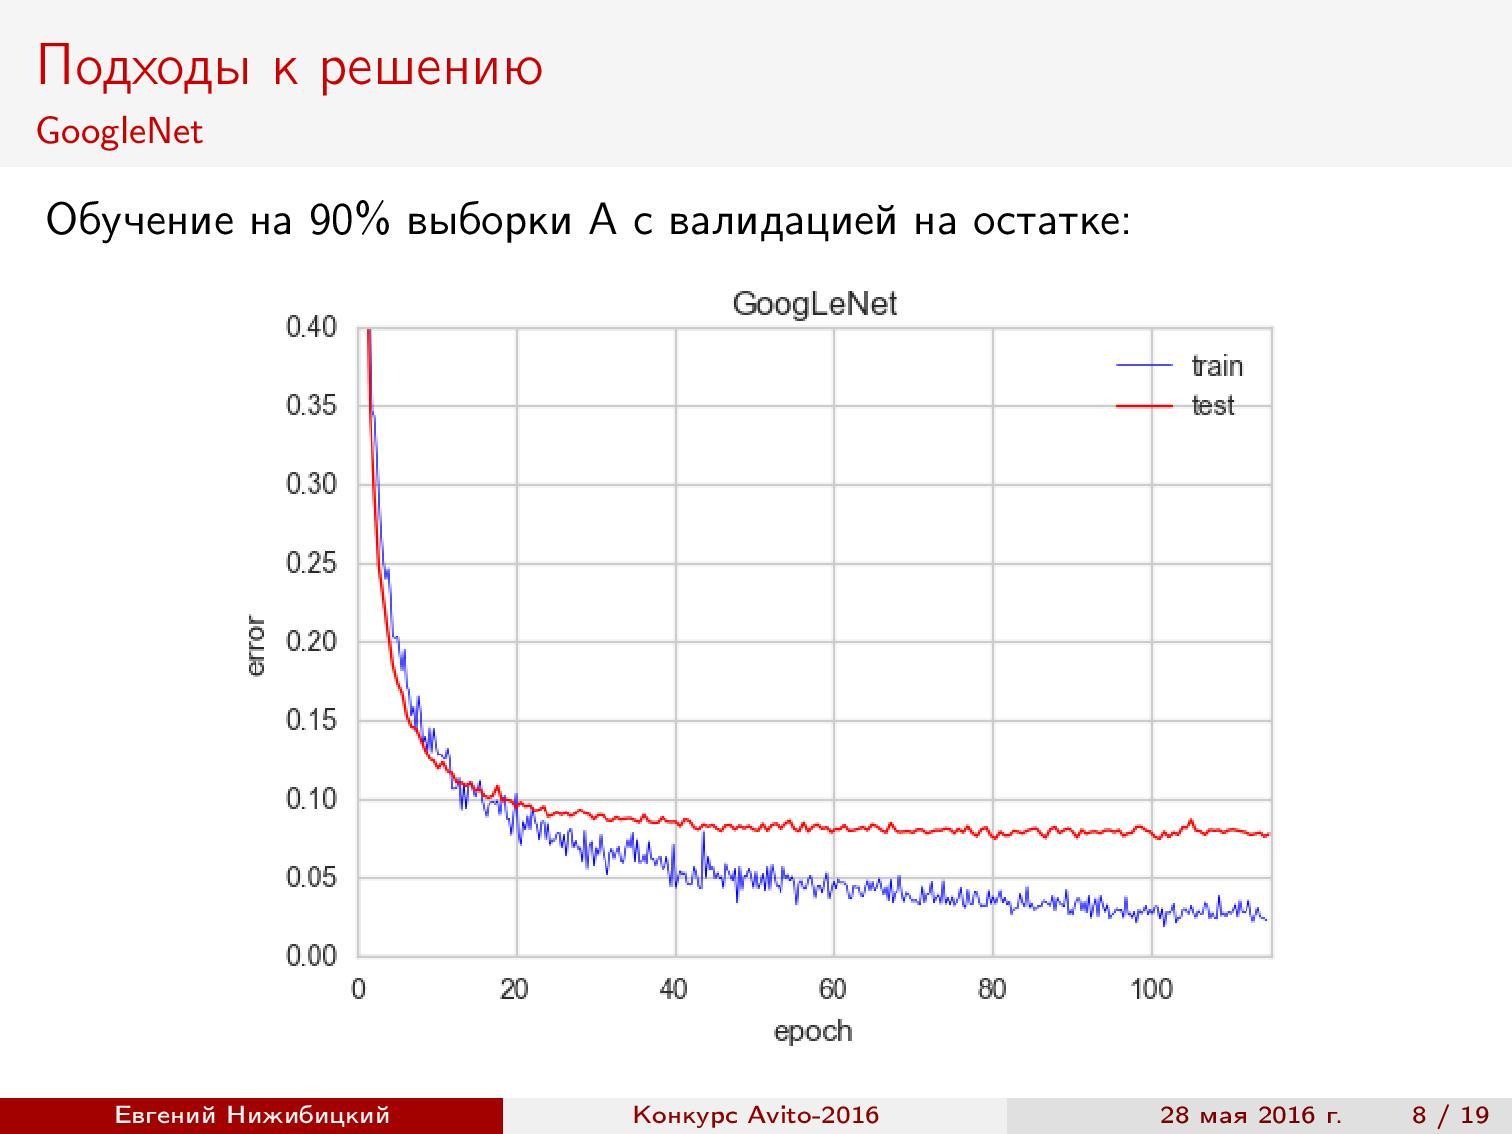
Fine-tuning networks . Teaching a deep neural network from scratch is quite a time-consuming exercise, and, moreover, is not always effective in terms of results. Therefore, the advanced training of networks is often used: the network already trained on ImageNet is taken, the last layer is replaced with a layer with the required number of classes, and then the network is set up with a low learning rate, but with data from the competition. This scheme allows you to train the network faster and with higher quality.
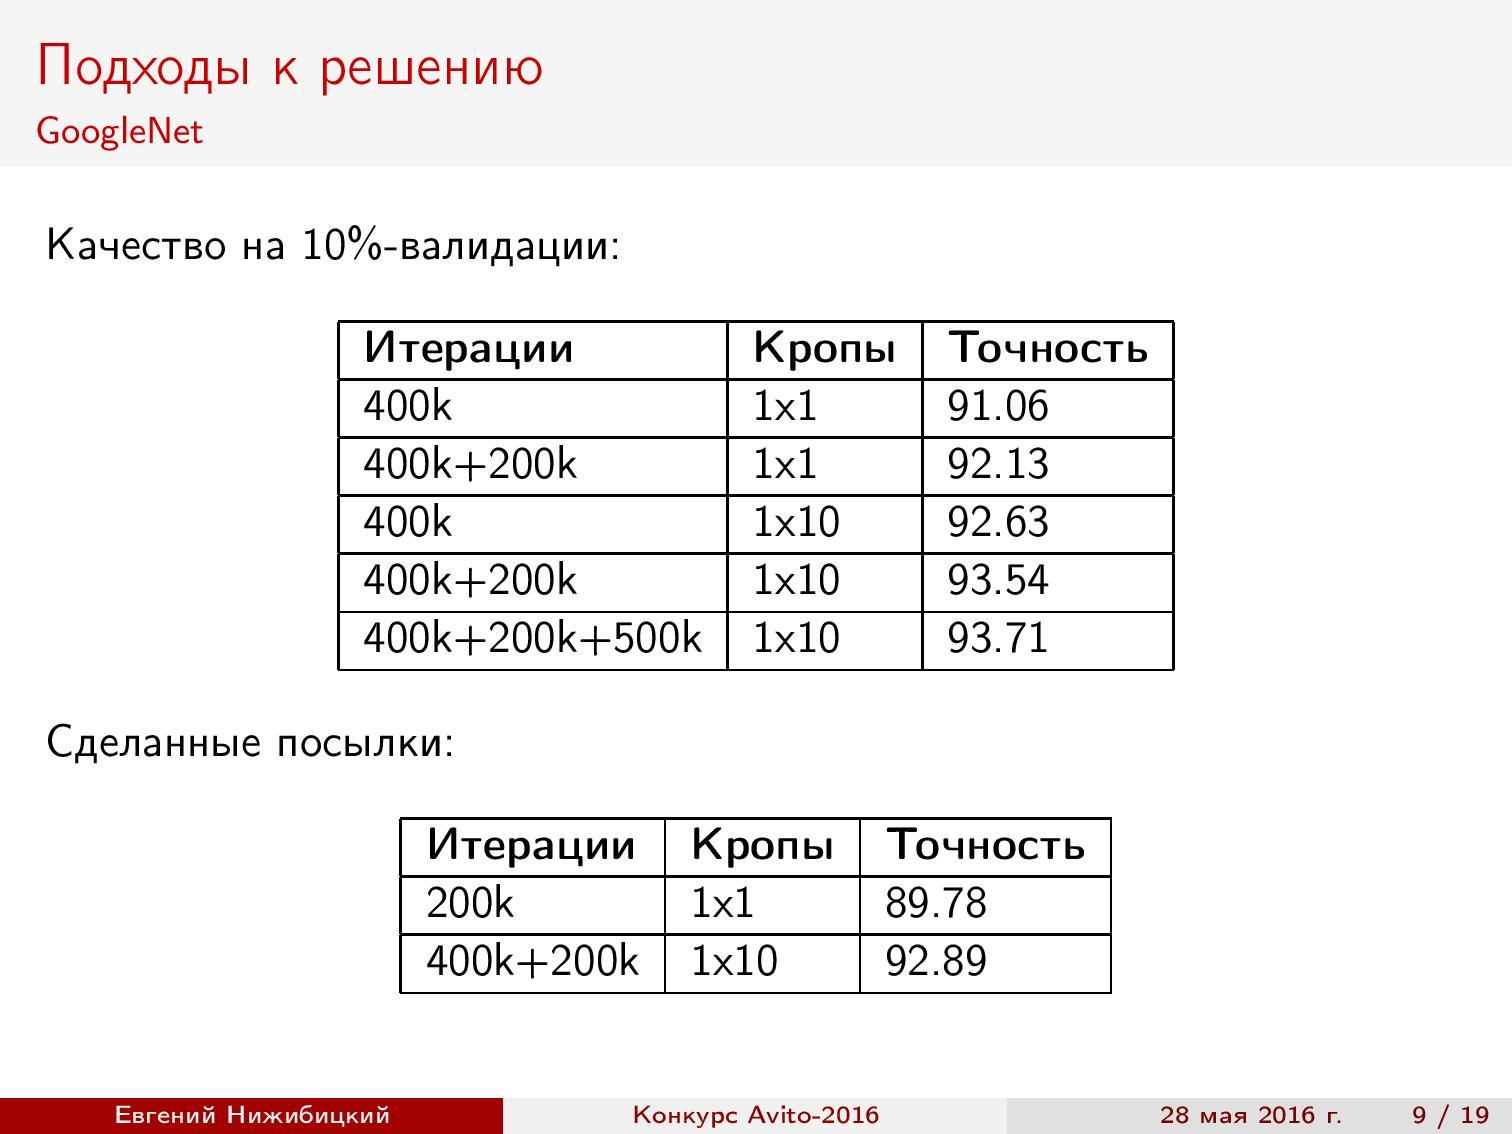
The first approach to additional training GoogLeNet showed approximately 92% accuracy during validation.
Crop prediction . Using the neural network to predict on a test sample, you can improve the quality. To do this, cut out fragments of a suitable size in different places of the original image, and then average the results. Crop 1x10 means that the center of the image is taken, four corners, and then everything is the same, but reflected horizontally. As you can see, the quality increases, but the prediction time increases.
Validation of results . After the issuance of the second part of the sample, I divided the sample into several parts. All further results are shown on this partition.
ResNet-34 Torch . You can use the ready-made repository of the authors of the architecture, but to get the predictions on the test in the right format, you need to fix some scripts. In addition, you need to solve the problems of large memory consumption dumps. Accuracy during validation is about 95%.
Inception-v3 TensorFlow . Here, the finished implementation was also used, but the pre-processing of images was changed, and the cropping of images during the generation of the batch was also limited. The result is almost 96% accuracy.
Ensemble of models . The result was two ResNet models and two Inception-v3 models. What quality during validation can be obtained by mixing models? The class probabilities were averaged using the geometric mean. Weights (in this case, degrees) were selected on a delayed sample.
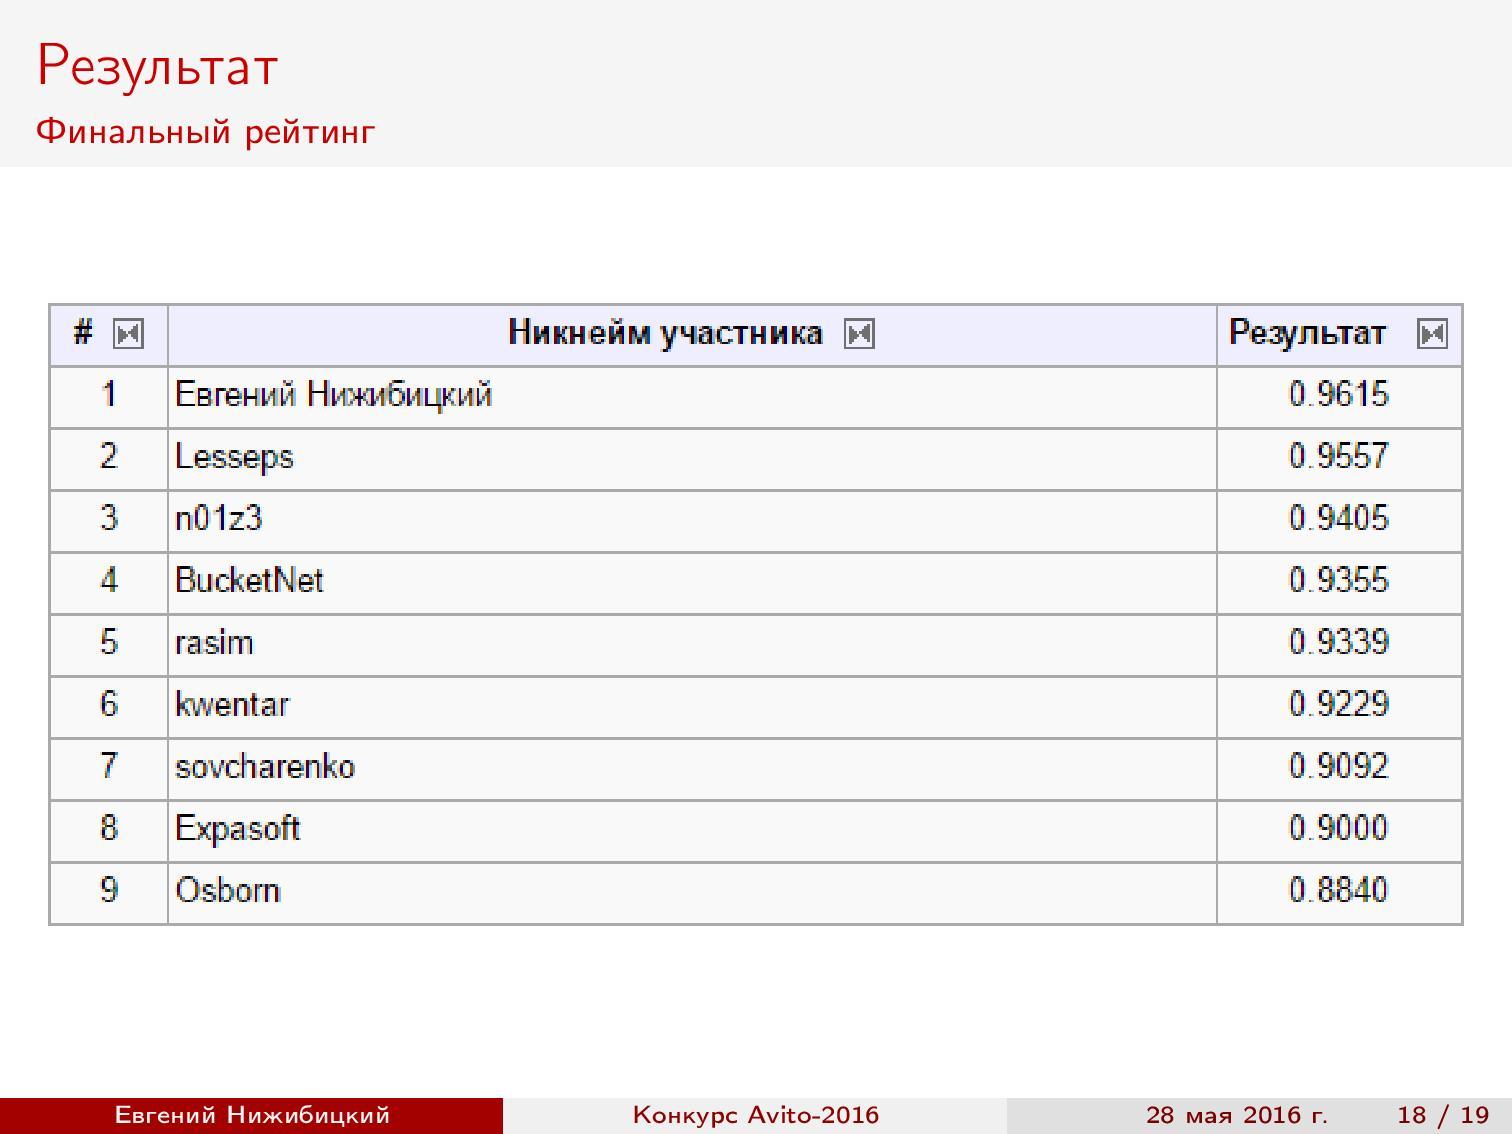
The results . ResNet training on the GTX 980 took 60 hours, and Inception-v3 on the TitanX - 48 hours. During the competition, we managed to test new frameworks with new architectures.
The task of classifying bank customers
Link to Kaggle .
Stanislav Semenov tells how he and other participants of the Kaggle top joined together and won a prize in the competition on the classification of applications from customers of a large bank - BNP Paribas .
Task setting . According to the obfuscated data from insurance claims, it is necessary to predict whether it is possible to confirm the request without additional manual checks. For a bank, this is the process of automating the processing of applications, and for data analysts, it is simply a machine learning task on binary classification. There are about 230 thousand objects and 130 signs. Metric - LogLoss . It is worth noting that the winning team deciphered the data, which helped them win the competition.
Disposal of artificial noise in the signs . The first thing is to look at the data. Several things are immediately apparent. First, all signs take values from 0 to 20. Secondly, if you look at the distribution of any of the signs, you can see the following picture:
Why is that? The fact is that at the stage of anonymization and noise of data, random noise was added to all values, and then scaling was carried out to the interval from 0 to 20. The inverse transformation was carried out in two steps: first, the values were rounded to a certain decimal place, and then a denominator was selected . Was this required if the tree still selects a threshold for splitting? Yes, after the inverse transformation, the differences of variables begin to carry more meaning, and for categorical variables it is possible to carry out one-hot coding.
Removal of linearly dependent features . We also noticed that some signs are the sum of others. It is clear that they are not needed. For their definitions, subsets of features were taken. Regression was built on such subsets to predict some other variable. And if the predicted values were close to true (it is worth considering the artificial noise), then the sign could be removed. But the team did not bother with it and used the already ready set of filtered features. The set was prepared by someone else. One of the features of Kaggle is the availability of a forum and public solutions, through which participants share their findings.
How to understand what to use? There is a small hack. Suppose you know that someone in old competitions used some technique that helped him to take a high place (forums usually write short decisions). If in the current competition this participant is again among the leaders - most likely, the same technique will shoot here.
Coding categorical variables . It was striking that a certain variable V22 has a large number of values, but at the same time, if we take a subsample for a certain value, the number of levels (different values) of other variables decreases markedly. This includes good correlation with the target variable. What can be done? The simplest solution is to build a separate model for each value of V22, but this is the same as splitting all variables in the first split tree.
There is another way to use the information obtained - coding the average value of the target variable. In other words, each value of the categorical variable is replaced by the average value of the target for the objects for which the given attribute takes the same value. It is impossible to perform such encoding directly for the entire training set: in the process we implicitly enter information about the target variable into the signs. We are talking about information that almost any model is sure to find.
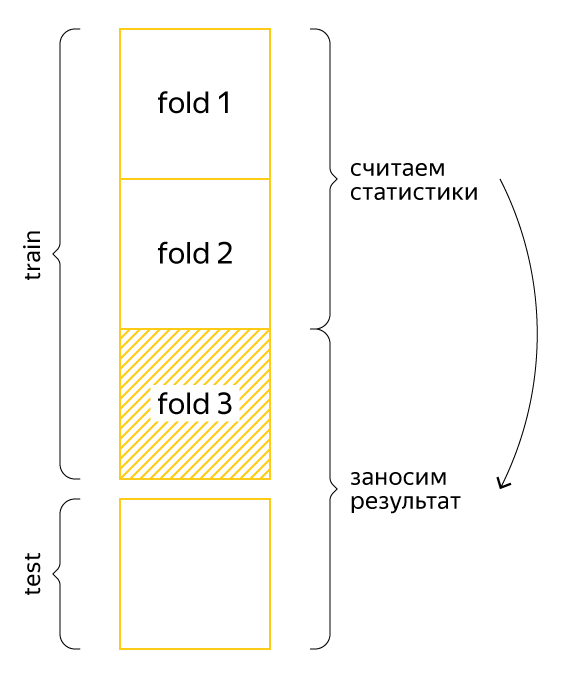
Therefore, these statistics are considered to fold. Here is an example:
Suppose that the data is divided into three parts. For each fold of the training set, we will consider the new feature for the two other folds, and for the test set - for the entire training set. Then the information about the target variable will not be so clearly included in the sample, and the model will be able to use the knowledge gained.
Will there be problems with anything else? Yes - with rare categories and cross-validation.
Rare categories . Suppose a certain category is encountered only a few times and the corresponding objects belong to class 0. Then the mean value of the target variable will also be zero. However, on a test sample, a completely different situation may arise. The solution is a smoothed average (or smoothed likelihood), which is calculated by the following formula:
Here global mean is the average value of the target variable over the entire sample, nrows is how many times the specific value of the categorical variable is met, alpha is the regularization parameter (for example, 10). Now, if some value is rarely met, the global average will have more weight, and if often enough, the result will be close to the initial average for the category. By the way, this formula allows processing previously unknown values of a categorical variable.
Cross validation . Suppose we calculated all smoothed means for categorical variables for other folds. Can we evaluate the quality of the model by standard cross-validation k-fold? Not. Let's take an example.
For example, we want to evaluate the model on the third fold. We are training the model in the first two folds, but they have a new variable with an average value of the target variable, when calculating which we have already used the third test fold. This does not allow us to correctly evaluate the results, but the problem that has arisen is solved by calculating the statistics on the folds within the folds. Consider again the example:
We still want to evaluate the model on the third fold. We divide the first two folds (the training sample of our assessment) into some other three folds, we calculate the new feature in the already analyzed script, and for the third fold (this is a test sample of our assessment), we count the first two folds together. Then no information from the third fold will be used when training the model and the assessment will be honest. In the competition, which we are discussing, only such cross-validation allowed to correctly assess the quality of the model. Of course, the “external” and “internal” number of folds can be any.
Construction of signs . We used not only the already smoothed mean values of the target variable, but also weights of evidence. This is almost the same, but with a logarithmic transformation. In addition, features of the form of the difference in the number of objects of positive and negative classes in a group without any normalization turned out to be useful. Intuition here is the following: the scale shows the degree of confidence in the class, but what to do with the quantitative traits? After all, if we process them in a similar way, then all values will be “forgotten” by the regularization of the global average. One option is to divide the values into bins, which are then considered as separate categories. Another way is simply to build a certain linear model on one sign with the same target. Total got about two thousand signs of 80 filtered.
Stacking and blending . As in most competitions, an important part of the solution is the stacking of models. In short, the essence of stacking is that we transfer the predictions of one model as a sign to another model. However, it is important once again not to retrain. Let's just look at an example:
Taken from the blog of Alexander Dyakonov
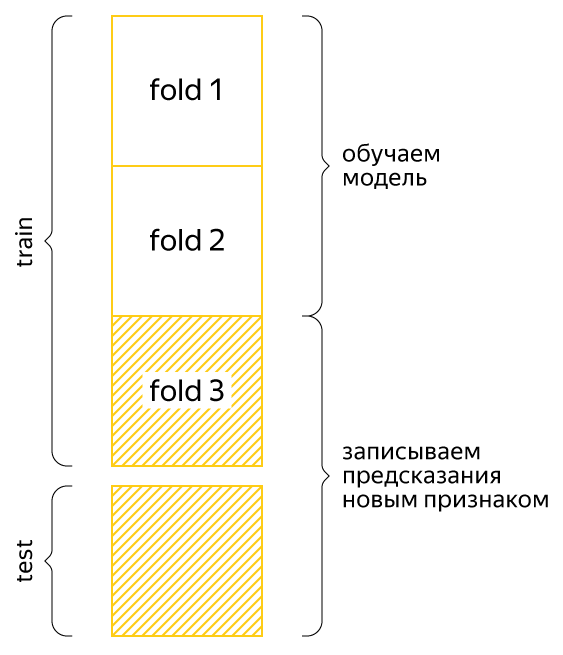
For example, we decided to split our selection into three folds at the stacking stage. Similar to calculating statistics, we must train the model in two folds, and add predicted values for the remaining fold. For a test sample, you can average the predictions of models from each pair of folds. Each stacking level refers to the process of adding a group of new feature-prediction models based on the existing dataset.
On the first level, the team had 200-250 different models, on the second - another 20-30, on the third - a few more. The result is a blending, i.e. a mix of predictions of different models. Various algorithms were used: gradient boosters with different parameters, random forests, neural networks. The main idea is to apply the most diverse models with different parameters, even if they provide not the highest quality.
Teamwork . Usually, participants are combined into teams before the end of the competition, when everyone already has their own groundwork. We teamed up with other "Kaglerami" at the very beginning. Each team member had a folder in the public cloud where datasets and scripts were located. The general procedure of cross-validation was approved in advance so that it could be compared with each other. Roles were distributed as follows: I invented new signs, the second participant built models, the third selected them, and the fourth controlled the entire process.
Where to get power . Testing a large number of hypotheses, building multilevel stacking and learning models can take too much time if you use a laptop. Therefore, many participants use compute servers with a large number of cores and RAM. I usually use AWS servers, and my team members, as it turned out, use cars at work for contests while they are idle.
Communication with the organizing company . After successful performance in the competition, communication with the company takes place in the form of a joint conference call. Participants talk about their decision and answer questions. In BNP, people were not surprised by multilevel stacking, but they were interested, of course, in building signs, working in a team, validating results — anything that might be useful to them in improving their own system.
Whether it is necessary to decipher . The winning team noticed one feature in the data. Some signs have missing values, and some do not. That is, some characteristics are not dependent on specific people. In addition, we got 360 unique values. It is logical to assume that we are talking about some time stamps. It turned out that if we take the difference between two such signs and sort the entire sample by it, then first zeros will go more often, and then ones. The winners took advantage of this.
Our team ranked third. In total, nearly three thousand teams participated.
Ad category recognition task
Link to DataRing .
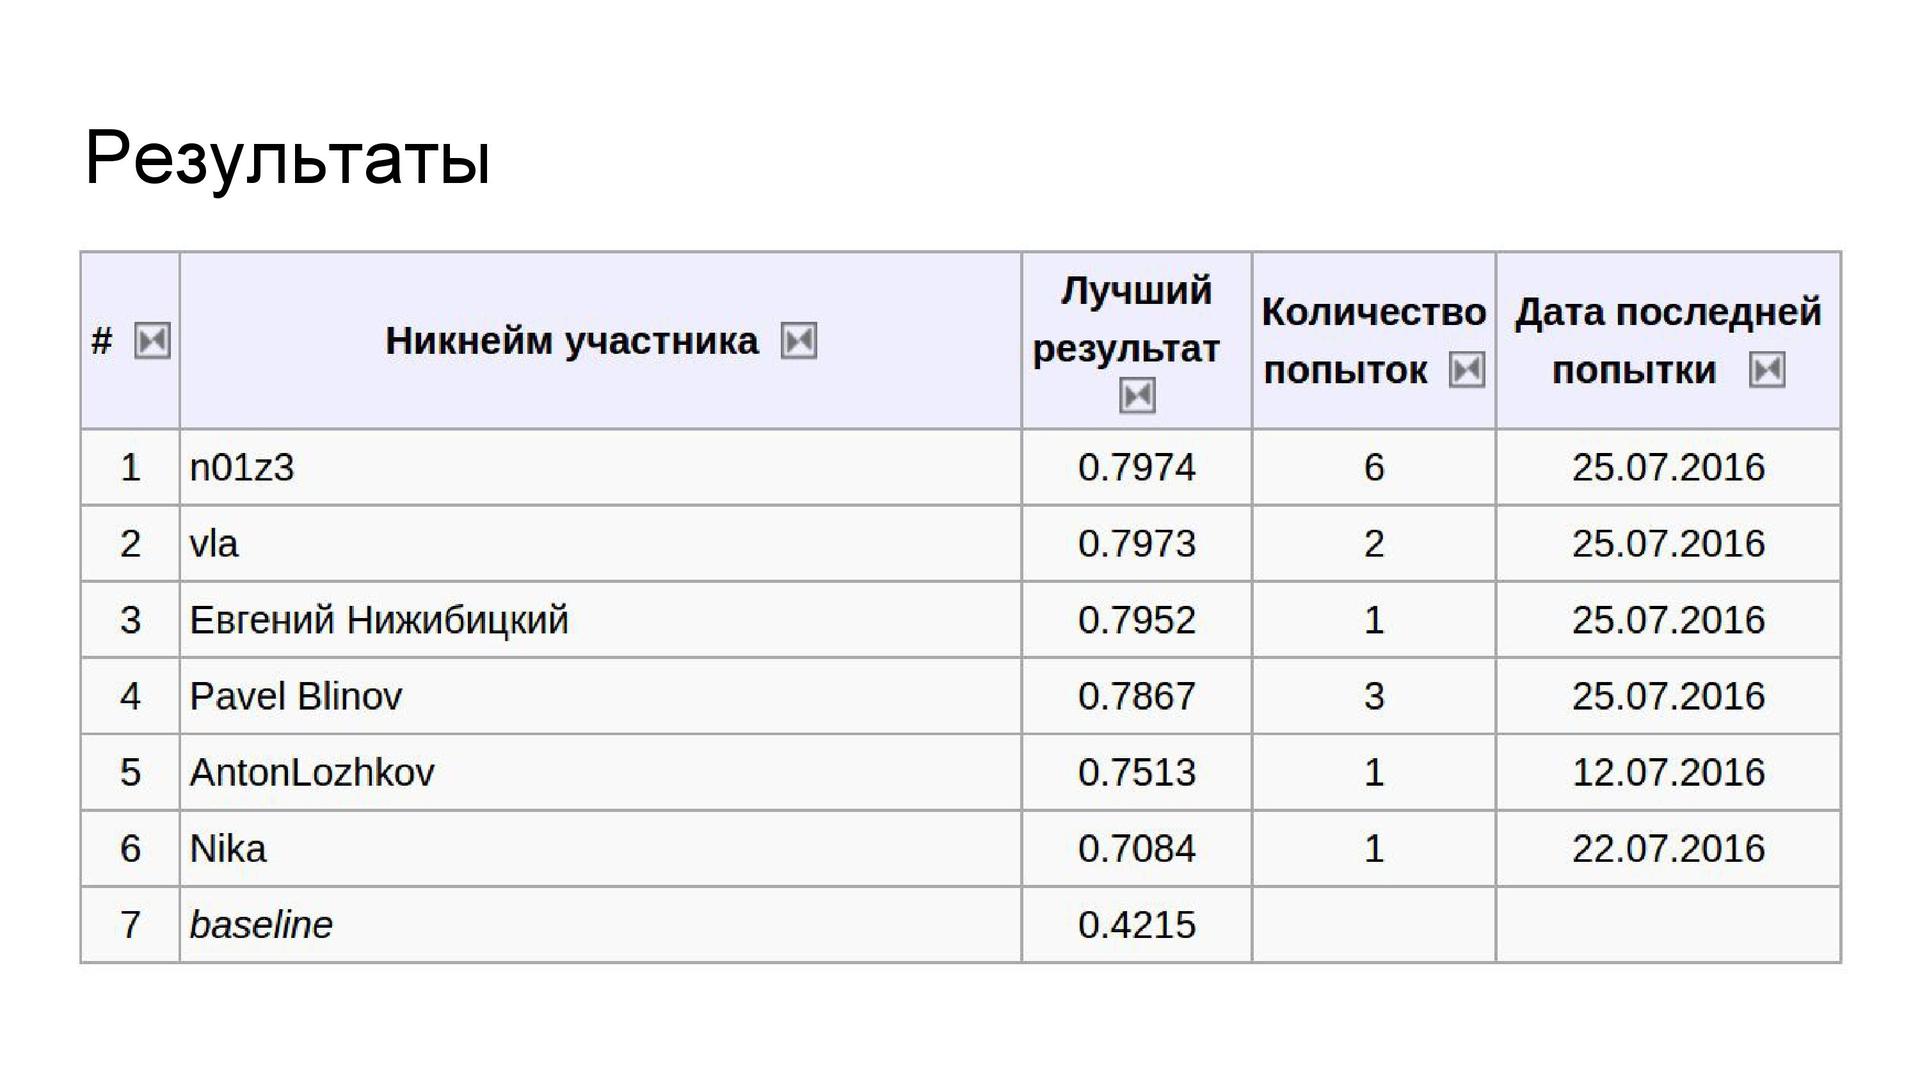
This is another Avito contest. It took place in several stages, the first of which (as, incidentally, also the third) was won by Arthur Kuzin N01Z3 .
Task setting . According to the photos from the ad, you must define a category. Each ad corresponded from one to five images. The metric took into account the coincidence of categories at different levels of the hierarchy - from general to narrower (the latter level contains 194 categories). In total, the training sample had almost a million images, which is close to the size of ImageNet.
The difficulty of recognition . It would seem that you just need to learn how to distinguish TV from the car, and the car from the shoes. But, for example, there is a category “British cats”, and there are “other cats”, and among them there are very similar images - although you can still distinguish them from each other. What about tires, wheels and wheels? Here the man can not cope. These difficulties are the reason for the appearance of some limit on the results of all participants.
Resources and framework . I had at my disposal three computers with powerful video cards: a home computer provided by a laboratory at MIPT and a computer at work. Therefore, it was possible (and had to) train several networks simultaneously. MXNet was chosen as the main neural network learning framework, created by the same guys who wrote the well-known XGBoost . This alone was the reason to trust their new product. The advantage of MXNet is that an effective iterator is available out of the box with a regular augmentation, which is sufficient for most tasks.
Network Architecture The experience of participating in one of the past competitions showed that the architecture of the Inception series shows the best quality. I used them here. Butch normalization was added to GoogLeNet as it accelerated the learning of the model. The Inception-v3 and Inception BN architectures from the Model Zoo model library were also used, to which a dropout was added before the last fully connected layer. Due to technical problems, it was not possible to train the network using a stochastic gradient descent, therefore Adam was used as an optimizer.
Data augmentation . To improve the quality of the network, augmentation was used - adding distorted images to the sample in order to increase the diversity of data. Transformations such as accidental photo cropping, reflection, turning at a small angle, changing the aspect ratio and shifting were involved.
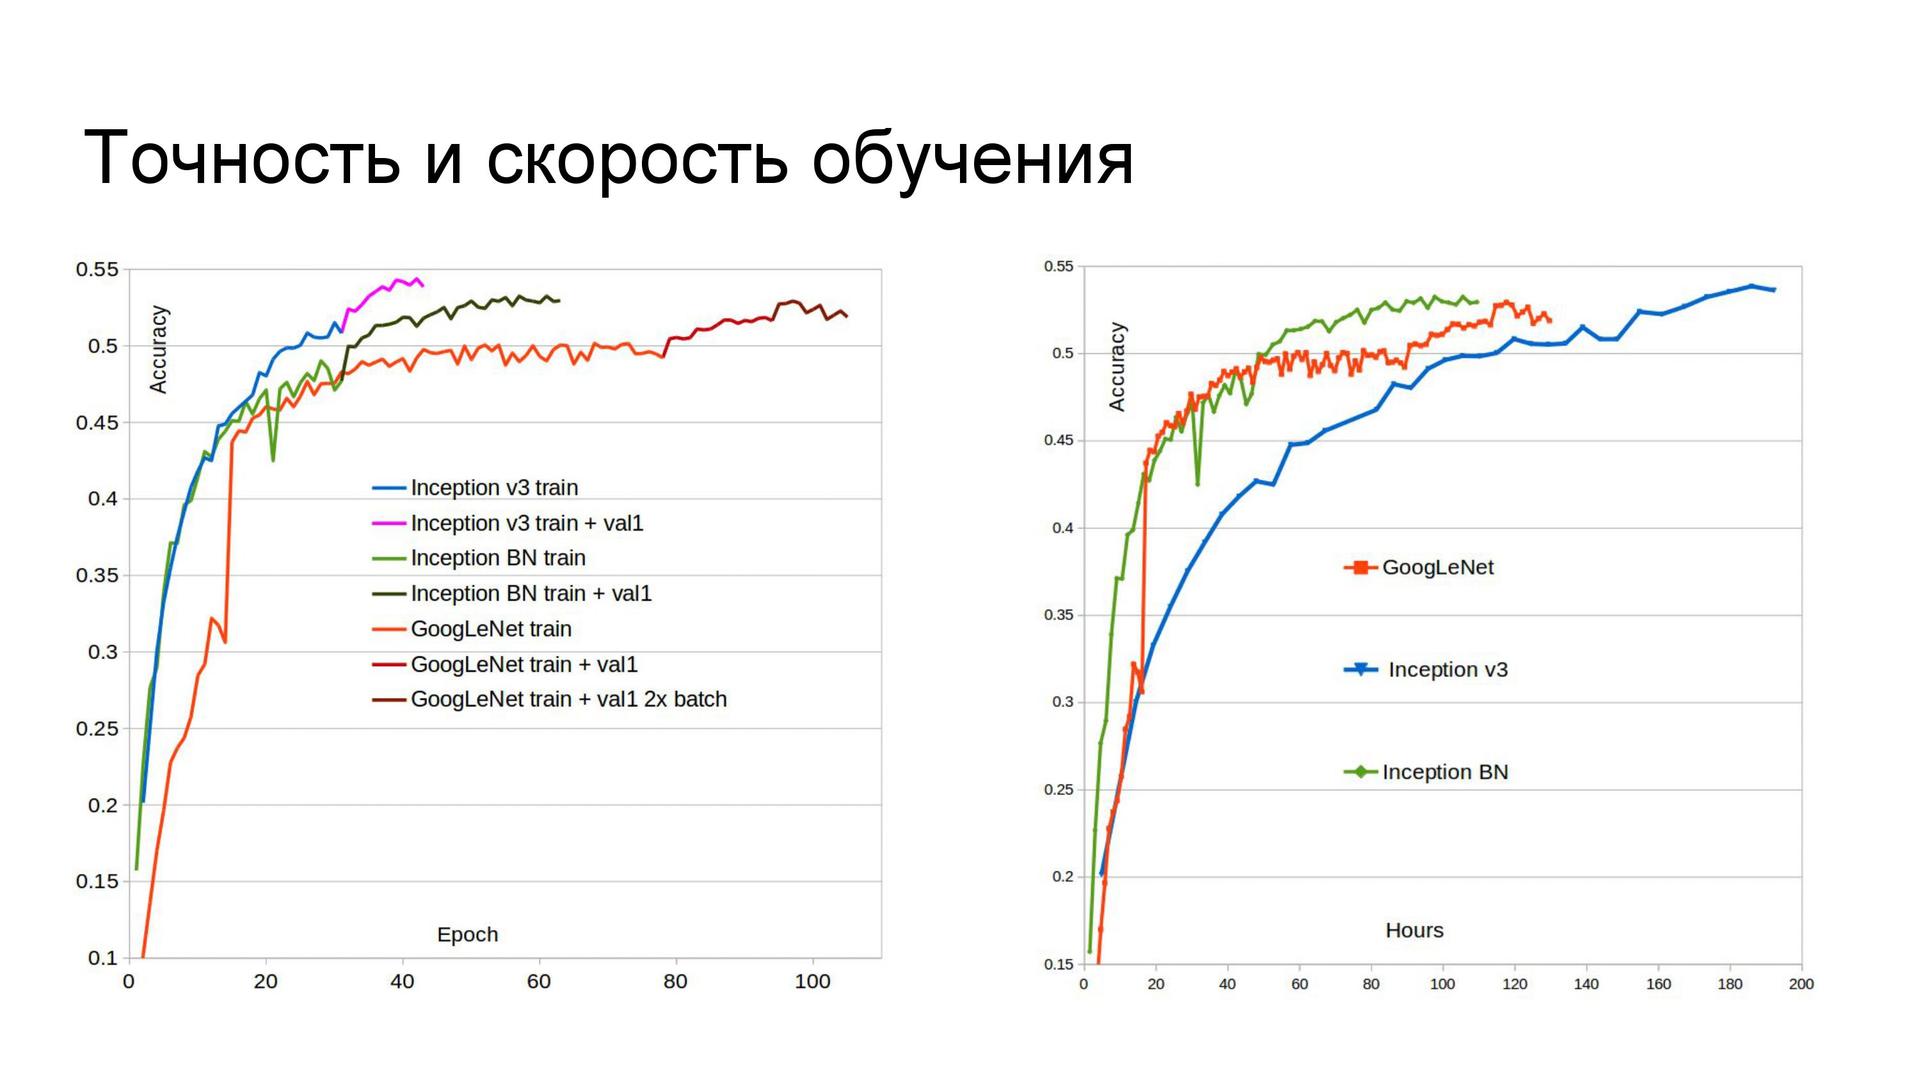
Accuracy and speed of learning . At first I divided the sample into three parts, but then I abandoned one of the validation steps for mixing the models. Therefore, subsequently, the second part of the sample was added to the training set, which improved the quality of networks. In addition, GoogLeNet initially studied at Titan Black, which has half the memory compared to Titan X. So this network was re-trained with a large batch size, and its accuracy increased. If you look at the time of learning networks, we can conclude that in terms of limited time it is not necessary to use Inception-v3, because with two other architectures, learning goes much faster. The reason is the number of parameters. Inception BN learns the fastest.
Building predictions .
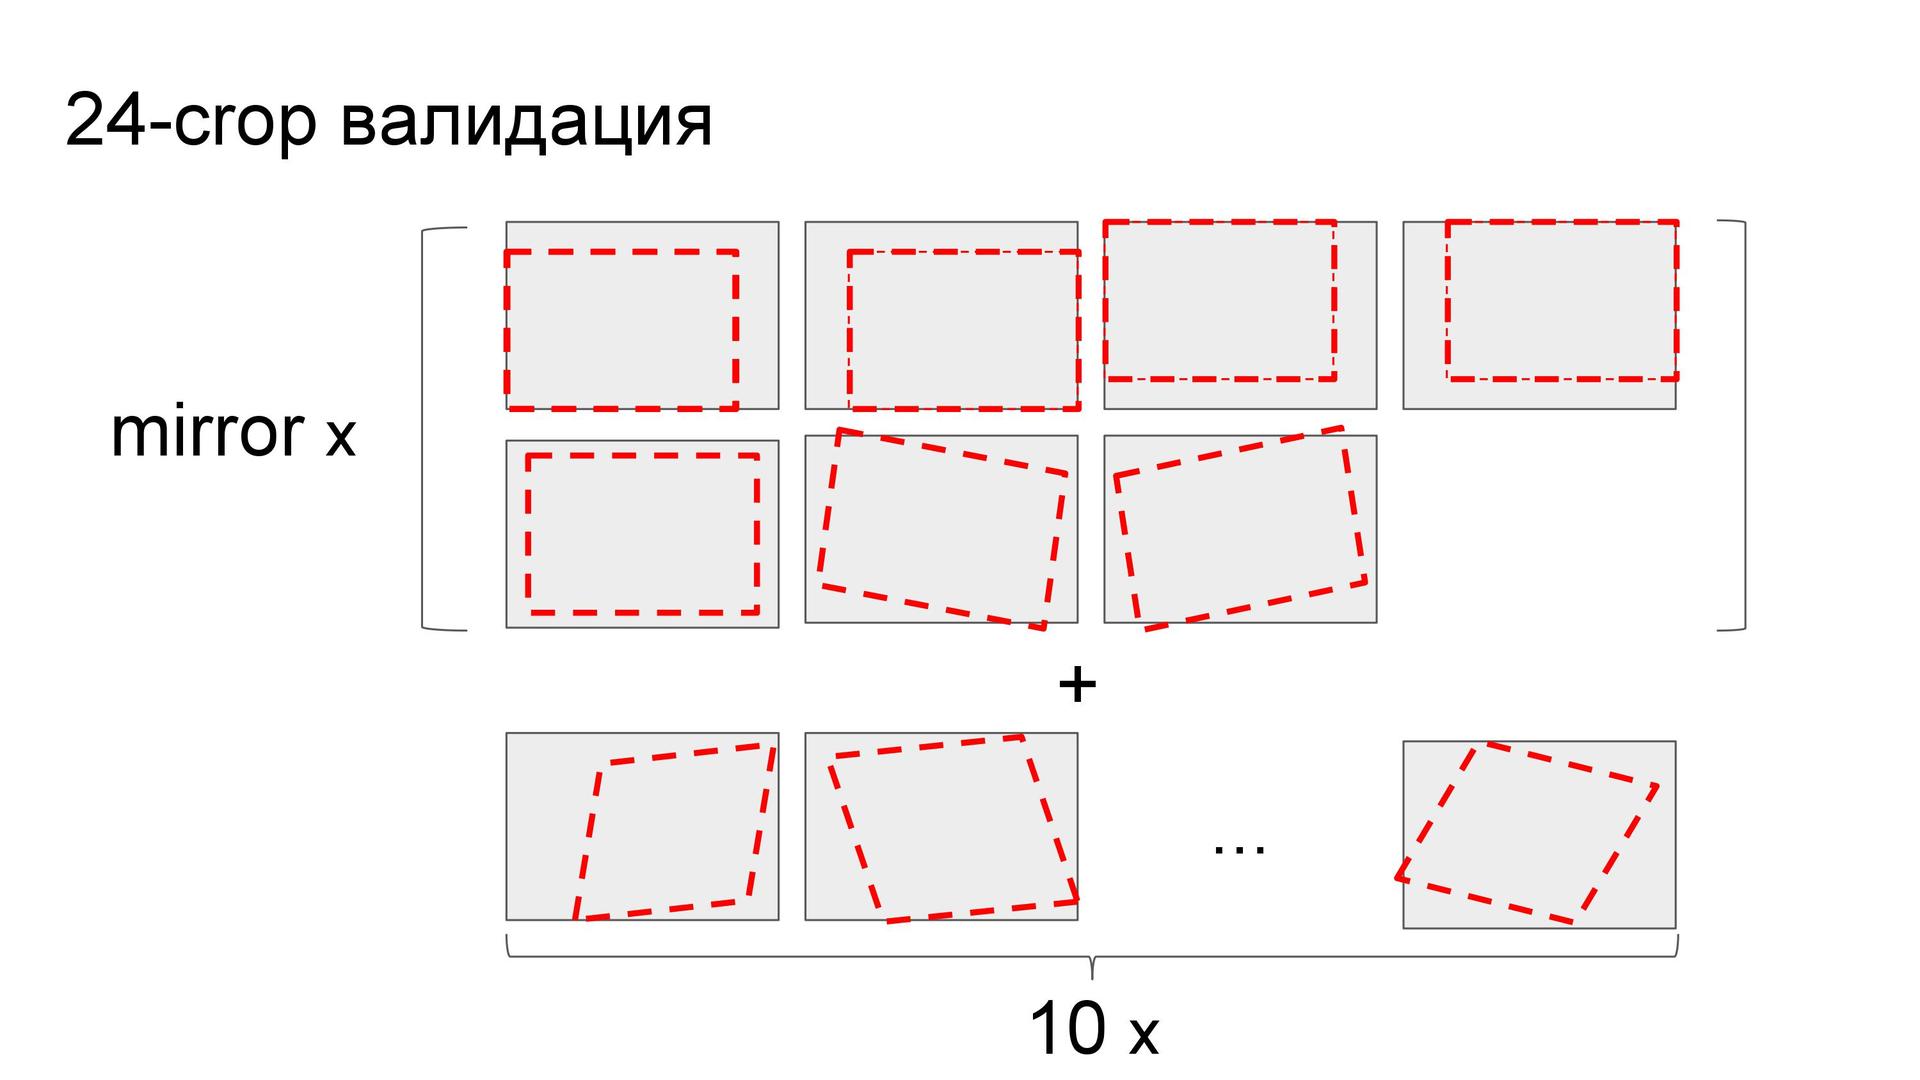
Like Eugene in the competition with the brands of cars, Arthur used predictions on the crocs - but not on 10 polling stations, but on 24. The plots were angles, their reflections, the center, the turns of the central parts and ten more random ones.
If one maintains the state of the network after each epoch, the result is a variety of different models, not just the final network. Taking into account the time remaining until the end of the competition, I could use the predictions of 11 epoch models — since the construction of predictions using the network also lasts quite a lot. All of these predictions were averaged according to the following scheme: first, using the arithmetic average within the cropping groups, then using the geometric average with weights selected on the validation set. , . .
. , . , . , . , , .
vs. fine-tuning . , , . .
Black Box Challenge, , «». , «» . «», . — reinforcement learning.
5vision. .
. «», . , , , . . 36 . . — .
. , 35 36- . -: , . , : . , , 100 , . « » . - , 36- . , , 36- , — , . , .
Q-learning . . q-learning. Q, . Q , «» . «» , , . . , . . q-learning ( , ). , , , , q-learning .
black box . , n-step q-learning, , n . , — , - . , q- , « 3». , .
. : ( ) , , q- — . , q- . — replay memory ( , ) , , — .
. ( ) . . ( Q-) . , -: ́ , . , .
. , . , ( , ), , dueling- ( ) . - — , , .
. 5vision , «».
, ?
. — , ( ) — 60-80 . : , - . , , . , , , .
, : , . , . , , YouTube- . , -, , . , — .
That's all. , , , - , , — , data scientist. devops, , , . — , - .
, :
- If you are no longer a beginner and want to “pump over” in a short time on the main topics - take a Yandex course “Introduction to machine learning” at Coursera .
- For those who wish to study the subject, the specialization “Machine learning and data analysis” will be more suitable .
- Open Data Science community (#mltrainings_beginners, #mltrainings_live channels).
Source: https://habr.com/ru/post/327444/
All Articles