All on the shelves: web analytics with Rambler / Top 100, part 1

Part one, in which we talk about restarting the Rambler / Top-100 service and the new tool for detailed hierarchical analytics “Site sections”.
In the fall of 2016, we restarted Rambler / Top-100, a web analytics service and the oldest catalog of Runet websites. Since then, we have added several additional features that we want to talk about. This spring Top 100 met under the flag of thematic analytics on the Russian Internet.
')
In general, restarting the service had several tasks. First, we changed outdated and expensive components in support to modern and more stable ones. Secondly, it was time to refresh the look long ago - the warm tube design of the old Top 100 gave the beginning to zero. Thirdly, it was necessary to revise the functionality of the counter and analytical interface, adding new features.
Starting the work on the new version of Top-100, we turned for advice to our colleagues: analysts, marketers and managers. They, as the target audience of the service, with their suggestions and comments helped to make the Top 100 more useful and better. The people of these professions are our most active and demanding users, so the requirements for the MVP (Minimum viable product) included two important points: preserving all the capabilities of the previous version of the service and adding tools necessary for our own analytical tasks RAMBLER & Co.
Report "Site sections"
Without recalling the outdated version, we will start with the second part - we will talk about the three analytical capabilities of the Top 100, which allow us to collect and visualize data on the behavior of visitors on the site’s pages: Site sections, Block analytics and Visit parameters. Specifically, in this article we will talk about the report "Sections of the site."
Immediately make a reservation that the article has examples of solving research problems and technical details of setting up the meter, as well as code examples. Therefore, we expect that the article will be of interest to both managers and marketers, as well as webmasters or front-end developers. For those who want to know all the technical details, we share a link to the public documentation on setting up the Top-100 counter. If this is not enough for you, write to the Top 100 support service , answer any questions about the counter's capabilities and the operation of the interfaces.
Effectively - how much is this?
First, consider what problems the sites face and what tasks their owners can solve with the help of Top 100 behavioral reports or similar tools. A lot of articles have been written about analytics for online stores, so for a change we will consider an example of a content project for schoolchildren and parents.
If you greatly simplify, the key product performance indicators for such a project, in addition to classroom, will be the depth of viewing and the time spent on the site. The more time a visitor spends on the pages of the site and the more pages he sees, the more ads he will see and the more money the site will earn. The scheme is simple and obvious.
The owner of our site wants to get the maximum profit, and he is concerned about the following questions about user behavior on the site:
- Which sections and site headings are more popular than others?
- Which articles are worst kept by visitors? From which articles do visitors leave the site after viewing or close the tab without even reading?
- What content on the site better engages visitors and keeps them longer on the site?
- What topics are interesting to visitors, and which - not very?
In short, it is important for the site owner to understand how hosted content works and what can be done to improve KPI and increase profits, in addition to hiring a new copywriter. Now we will consider one of the tools that can help him in this.
Evaluate site traffic
The Site Sections report in the Rambler / Top-100 dashboard can be useful for owners of sites with a clear hierarchy: for example, news resources, online media, encyclopedias, electronic libraries, online stores, any catalogs or classics. It allows you to answer the question of how your site’s headings look like, which sections or pages (for example, articles or products) attract more audience attention, where visitors spend more time, what content is better than others and what pages or articles are leading. by bounce rate.
Let's return to our example with content for schoolchildren and their parents. Suppose the hierarchy of the site pages is:
- Junior classes
- Educational games
- Non-class activities
- and etc.
- Middle and high school
- School Reviews
- Cribs and Reshebnik
- High school graduation
- Olympics
- Textbooks
- School uniform
- and etc.
- Arrival
- OGE and USE
- College Choice
- University Choice
- Tutors and courses
- and etc.
- Educational materials
- 1 class
- 2 class
- 5th grade
- and etc.


To begin, let's set up data collection for the report. It is quite simple to do: in the initialization code of the Top 100 counter it is enough to add the 'chapters' parameter and pass the value of the chain for a specific page to it. The values of 'chapters' can be indicated in Cyrillic for ease of reading the report in the future.
So, for example, for the page “Admission / Choice of the University / Moscow State University” the counter code might look like this:
<!-- Top100 (Kraken) Counter --> // ... var options = { project: PROJECT_ID, chapters: ['', ' ', ' '] }; // ... <!-- END Top100 (Kraken) Counter --> And for the page “Middle and High School / Cheat sheets and reshebnik / Chemistry, Grade 8” like this:
<!-- Top100 (Kraken) Counter --> // ... var options = { project: PROJECT_ID, chapters: [' ', ' ', ', 8 '] }; // ... <!-- END Top100 (Kraken) Counter --> The Site Sections report repeats the site hierarchy and will look like this:
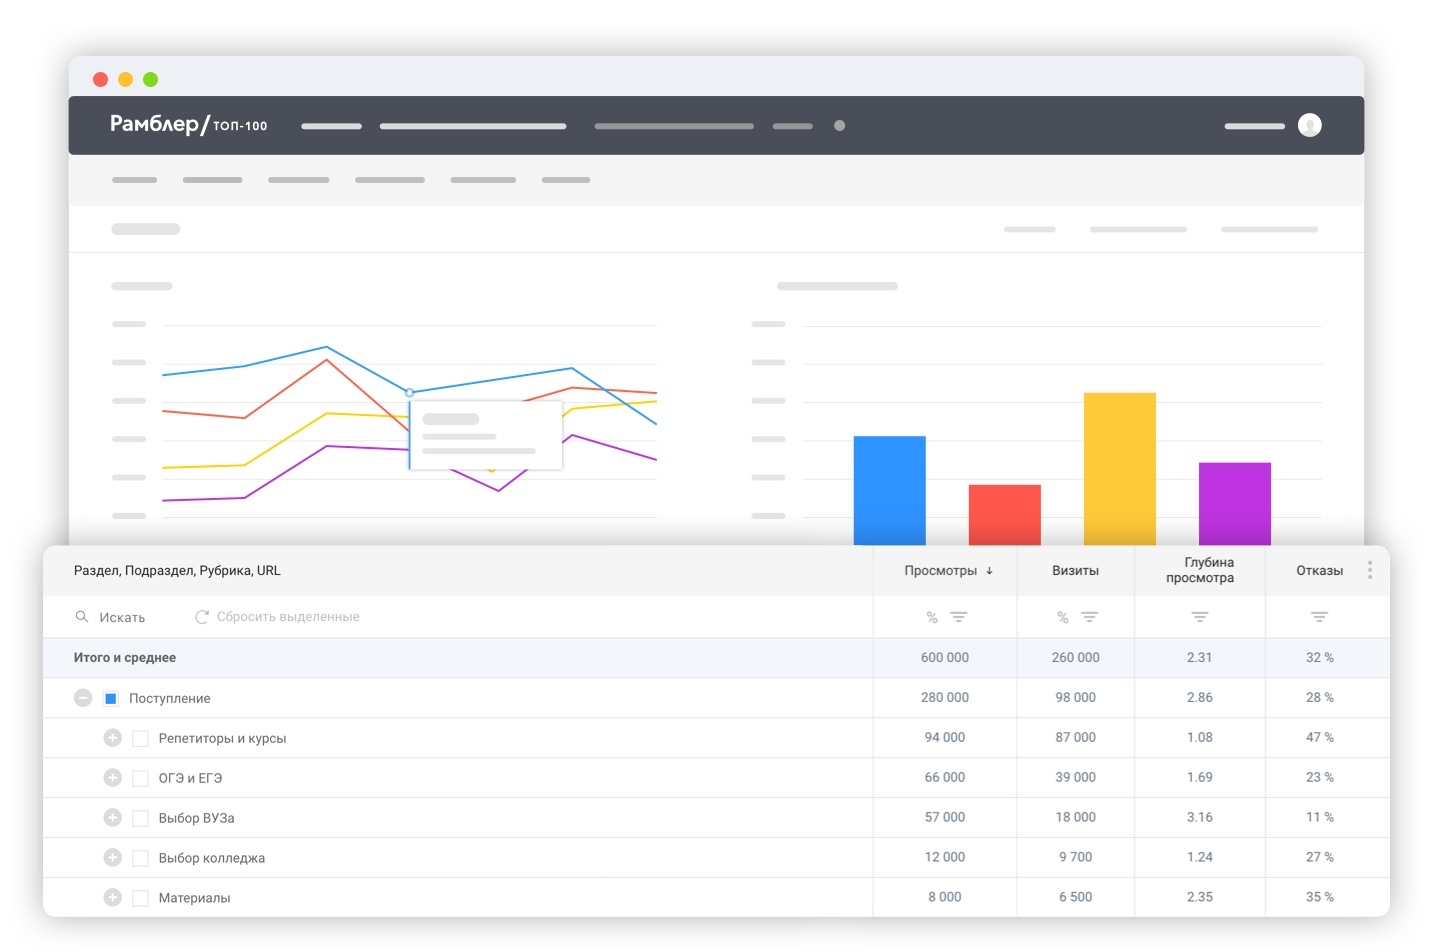
Thus, if more than one logical structure is present at the site at the same time, several hierarchies can be defined: then several trees will be present in the report. They can be any number, and the depth of each is limited to three levels. The last (fourth) level in the report is always the URL of the marked page. For example, if the mobile version of your site is on a subdomain, you will see the distribution between the desktop and mobile versions of the pages.
It is important not to forget to mark the pages of sections and headings themselves: then the values for these levels in the report will take into account all pages within the heading and the splitting page.
Now back to the questions that we wanted to get an answer earlier. What is the most popular section now? What content on the site better engages visitors and keeps them longer on the site? Which articles are least interesting to visitors? As can be seen in the example report, for the selected time period the “Admission” section is the most popular, in which the heading “Tutors and Courses” is the leader in terms of attendance. At the same time, it is clear that the depth of viewing is noticeably higher for the heading “Choice of the university”, and the pages of the heading “Tutors and courses” have a high failure rate: most visitors read one page per visit and leave the site. This may mean that those who are looking for tutors, or quickly find the content they need, or, conversely, leave disappointed.
For the site owner, this information may be the reason for the content and navigation changes. For example, you can add a block with recommendations for promoting the page of the “University Choice” column and other relevant headings with a good depth of view and an average time. This will test the hypothesis that such content will be of interest to visitors to the “Tutors and Courses” section, and they will stay on the site longer, look at more pages, are more likely to return to the site again. More ad units can be added to the most popular pages. Pages and headings with the highest bounce rate need to be reworked or even completely reconsider their need.
As can be seen from the example, the report “Site Sections” can help identify problems in the hierarchical structure of the site and formulate hypotheses about how to optimize the structure. It is enough to study the report once to understand which pages need to be “enhanced” with the help of cross-references, and which have great potential. By the way, we will talk about ways to evaluate the effectiveness of such cross-references in the next article, where we will tell about the markup of the site by Analytics of the blocks and the interpretation of the results obtained.
Source: https://habr.com/ru/post/327436/
All Articles