Where did unreliable tests go to Google
If the tests fail on the previously tested code, then this is a clear sign that some new error has appeared in the code. Previously, the tests were successful and the code was correct, now the tests fail and the code does not work correctly. The goal of a good test suite is to make this signal as clear and clearly addressed as possible.
Unreliable (flaky), that is, non-deterministic tests behave differently. They can show both positive and negative results on the same code. In other words, a test failure may or may not mean the appearance of a new problem. And an attempt to reproduce the error by restarting the test on the same version of the code may or may not lead to a successful pass of the test. We regard such tests as unreliable, and in the end they lose their value. If the initial problem is non-determinism in the working code, then ignoring the test means ignoring the bug in production.
In the continuous integration of Google runs about 4.2 million tests. Of these, about 63 thousand show an unpredictable result during the week. Although they represent less than 2% of all tests, they still bear a serious burden on our engineers.
If we want to fix unreliable tests (and avoid writing new ones), then first of all we need to understand them. We at Google collect a lot of data for our tests: runtime, test types, execution flags, and consumed resources. I studied how some of these data correlate with the reliability of the tests. I think this study can help us improve and make more stable testing methods. In the overwhelming majority of cases, the larger the test (in terms of the size of the binaries, the use of RAM, or the number of libraries), the less reliable it is. The rest of the article will discuss some of the patterns found.
')
For a previous discussion of unreliable tests, see John Mikko's article from May 2016.
We divided the tests into three groups by size: small, medium and large. Each test has a size, but the choice of label is subjective. The engineer determines the size when he initially writes the test, and the size is not always updated when the test changes. For some tests, this label no longer corresponds to reality. However, she has some predictive value. During the week, 0.5% of our small tests showed a non-deterministic property, 1.6% of average tests and 14% of large tests [1] . There is a clear decrease in reliability from small to medium tests and from medium to large tests. But it still leaves many questions open. Little can be understood, given only the size.
We collect some objective assessments: the binary size of the test and the amount of RAM used during the test [2] . For these two metrics, I grouped tests into two groups of equal size [3] and calculated the percentage of unreliable tests in each group. The numbers below are the r2 values for the best linear objective prediction [4] .
The tests considered here are mostly leak-proof tests that give a success / failure signal. Binary size and RAM usage correlated well across the entire sample of tests, and there is not much difference between them. So it's not just that big tests are more likely to be unreliable, but about a gradual decrease in reliability with an increase in the test.
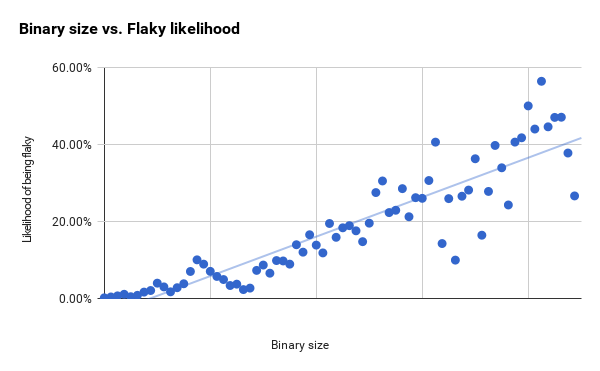
Below, I compiled graphs with these two metrics for the entire test suite. Unreliability increases with increasing binary size [5] , but we also observe an increase in the difference [6] in the linear objective prediction.
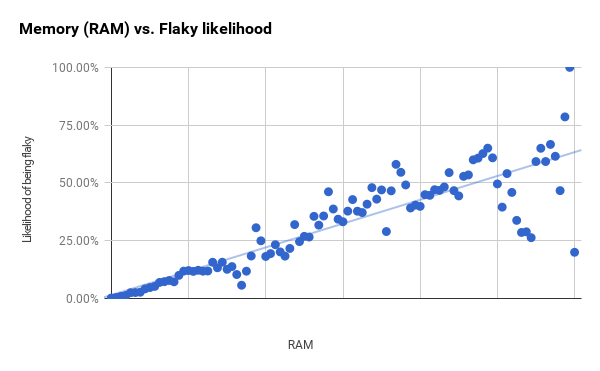
The graph of the use of RAM below is moving more clearly and begins to show large differences only between the first and second vertical lines.
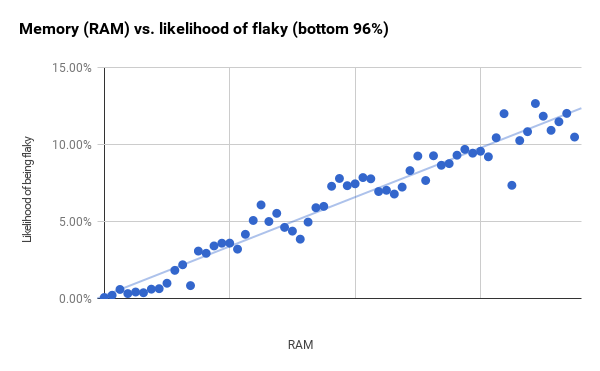
Although the sizes of the groups are constant, the number of tests in each of them is different. The points on the right of the graph with large differences correspond to groups that contain much fewer tests than the groups on the left. If you take less than 96% of the tests (which end right behind the first vertical bar) and then reduce the size of the groups, you get a much stronger correlation (r2 equals 0.94). This probably means that RAM and binary size have much more predictive power than shown in the general graphs.
Some tools blame the fact that they are the cause of unreliable tests. For example, WebDriver tests (whether written in Java, Python, or JavaScript) have the reputation of being unreliable [7] . For some of our usual test tools, I calculated the proportion of unreliable tests written with this tool. It should be noted that all of these tools are more often used to create larger tests. This is not an exhaustive list of testing tools, and it covers about a third of all tests. In the remaining tests, less known tools are used or the tool cannot be defined there.
All these tools show a percentage of unreliability above average. And given that every fifth unreliable test is written in Java WebDriver, it becomes clear why people complain about it. But correlation does not mean causality. Knowing the results from the previous section, we can assume that some other factor reduces the reliability of tests, and not just a tool.
You can combine the choice of tool and the size of the test - and see what is more important. For each tool I mentioned, I isolated the tests that use this tool and divided them into groups according to memory usage (RAM) and binary size, according to the same principle as before. Then he calculated the line of the best objective forecast and how it correlates with the data (r2). Then I calculated the prediction of the probability that the test would be unreliable in the smallest group [8] (which already covers 48% of our tests), as well as the 90th and 95th percentile of RAM usage.
This table shows the results of calculations for RAM. Correlation is stronger for all tools except the Android emulator. If you ignore the emulator, the difference in the correlation between the tools with similar use of RAM will be around 4-5%. The difference between the smallest test and the 95th percentile is 8-10%. This is one of the most useful conclusions of our research: the tools have some effect, but the use of RAM gives much greater deviations in reliability.
For tests in the Android emulator, there is practically no correlation between the binary size and unreliability. For other tools, you can see a large difference in prediction of unreliability between small and large tests for RAM consumption; up to 12 percentage points. But at the same time, when comparing tests on a binary size, the difference in the prediction of unreliability is even greater: up to 22 percentage points. This is similar to what we saw when analyzing the use of RAM, and this is another important conclusion of our study: the binary size is more important for deviations in the prediction of unreliability than the tool used.
The size of the test chosen by the developer correlates with unreliability, but Google doesn’t have enough size options for this parameter to be really useful for forecasting.
Objectively measured indicators of binary size and RAM usage correlate strongly with the reliability of the test. This is a continuous, not step function. The latter would show unexpected jumps and would mean that at these points we move from one type of test to another (for example, from unit tests to system tests or from system tests to integration tests).
Tests written with the help of certain tools often give unpredictable results. But this can mainly be explained by the larger size of these tests. The tools themselves make a small contribution to this difference in reliability.
Care should be taken when writing a large test. Think about what code you are testing and what the minimum test for this will look like. And you need to be very careful writing big tests. Without additional protective measures, there is a high probability that you will make a test with a non-deterministic result, and such a test will have to be corrected.
Unreliable (flaky), that is, non-deterministic tests behave differently. They can show both positive and negative results on the same code. In other words, a test failure may or may not mean the appearance of a new problem. And an attempt to reproduce the error by restarting the test on the same version of the code may or may not lead to a successful pass of the test. We regard such tests as unreliable, and in the end they lose their value. If the initial problem is non-determinism in the working code, then ignoring the test means ignoring the bug in production.
Unreliable tests in Google
In the continuous integration of Google runs about 4.2 million tests. Of these, about 63 thousand show an unpredictable result during the week. Although they represent less than 2% of all tests, they still bear a serious burden on our engineers.
If we want to fix unreliable tests (and avoid writing new ones), then first of all we need to understand them. We at Google collect a lot of data for our tests: runtime, test types, execution flags, and consumed resources. I studied how some of these data correlate with the reliability of the tests. I think this study can help us improve and make more stable testing methods. In the overwhelming majority of cases, the larger the test (in terms of the size of the binaries, the use of RAM, or the number of libraries), the less reliable it is. The rest of the article will discuss some of the patterns found.
')
For a previous discussion of unreliable tests, see John Mikko's article from May 2016.
Test size - big tests are less reliable.
We divided the tests into three groups by size: small, medium and large. Each test has a size, but the choice of label is subjective. The engineer determines the size when he initially writes the test, and the size is not always updated when the test changes. For some tests, this label no longer corresponds to reality. However, she has some predictive value. During the week, 0.5% of our small tests showed a non-deterministic property, 1.6% of average tests and 14% of large tests [1] . There is a clear decrease in reliability from small to medium tests and from medium to large tests. But it still leaves many questions open. Little can be understood, given only the size.
The more test, the less reliability
We collect some objective assessments: the binary size of the test and the amount of RAM used during the test [2] . For these two metrics, I grouped tests into two groups of equal size [3] and calculated the percentage of unreliable tests in each group. The numbers below are the r2 values for the best linear objective prediction [4] .
| Correlation between metric and test unreliability prediction | |
| Metrics | r2 |
| Binary size | 0.82 |
| Used RAM | 0.76 |
The tests considered here are mostly leak-proof tests that give a success / failure signal. Binary size and RAM usage correlated well across the entire sample of tests, and there is not much difference between them. So it's not just that big tests are more likely to be unreliable, but about a gradual decrease in reliability with an increase in the test.
Below, I compiled graphs with these two metrics for the entire test suite. Unreliability increases with increasing binary size [5] , but we also observe an increase in the difference [6] in the linear objective prediction.
The graph of the use of RAM below is moving more clearly and begins to show large differences only between the first and second vertical lines.
Although the sizes of the groups are constant, the number of tests in each of them is different. The points on the right of the graph with large differences correspond to groups that contain much fewer tests than the groups on the left. If you take less than 96% of the tests (which end right behind the first vertical bar) and then reduce the size of the groups, you get a much stronger correlation (r2 equals 0.94). This probably means that RAM and binary size have much more predictive power than shown in the general graphs.
Certain tools correlate with the frequency of unreliable tests.
Some tools blame the fact that they are the cause of unreliable tests. For example, WebDriver tests (whether written in Java, Python, or JavaScript) have the reputation of being unreliable [7] . For some of our usual test tools, I calculated the proportion of unreliable tests written with this tool. It should be noted that all of these tools are more often used to create larger tests. This is not an exhaustive list of testing tools, and it covers about a third of all tests. In the remaining tests, less known tools are used or the tool cannot be defined there.
| Unreliability of tests when using some of our usual test tools | ||
| Category | Share of unreliable | Share all unreliable tests |
| All tests | 1.65% | 100% |
| Java webdriver | 10.45% | 20.3% |
| Python WebDriver | 18.72% | 4.0% |
| Internal integration tool | 14.94% | 10.6% |
| Android emulator | 25.46% | 11.9% |
All these tools show a percentage of unreliability above average. And given that every fifth unreliable test is written in Java WebDriver, it becomes clear why people complain about it. But correlation does not mean causality. Knowing the results from the previous section, we can assume that some other factor reduces the reliability of tests, and not just a tool.
Size gives a better forecast than tools.
You can combine the choice of tool and the size of the test - and see what is more important. For each tool I mentioned, I isolated the tests that use this tool and divided them into groups according to memory usage (RAM) and binary size, according to the same principle as before. Then he calculated the line of the best objective forecast and how it correlates with the data (r2). Then I calculated the prediction of the probability that the test would be unreliable in the smallest group [8] (which already covers 48% of our tests), as well as the 90th and 95th percentile of RAM usage.
| Predicted probability of unreliability by RAM and tool | ||||
| Category | r2 | Smallest group (48th percentile) | 90th percentile | 95th percentile |
| All tests | 0.76 | 1.5% | 5.3% | 9.2% |
| Java webdriver | 0.70 | 2.6% | 6.8% | eleven% |
| Python WebDriver | 0.65 | −2.0% | 2.4% | 6.8% |
| Internal integration tool | 0.80 | −1.9% | 3.1% | 8.1% |
| Android emulator | 0.45 | 7.1% | 12% | 17% |
This table shows the results of calculations for RAM. Correlation is stronger for all tools except the Android emulator. If you ignore the emulator, the difference in the correlation between the tools with similar use of RAM will be around 4-5%. The difference between the smallest test and the 95th percentile is 8-10%. This is one of the most useful conclusions of our research: the tools have some effect, but the use of RAM gives much greater deviations in reliability.
| Predicted probability of unreliability by binary size and tool | ||||
| Category | r2 | Smallest group (33rd percentile) | 90th percentile | 95th percentile |
| All tests | 0.82 | −4.4% | 4.5% | 9.0% |
| Java webdriver | 0.81 | −0.7% | 14% | 21% |
| Python WebDriver | 0.61 | −0.9% | eleven% | 17% |
| Internal integration tool | 0.80 | −1.8% | ten% | 17% |
| Android emulator | 0.05 | 18% | 23% | 25% |
For tests in the Android emulator, there is practically no correlation between the binary size and unreliability. For other tools, you can see a large difference in prediction of unreliability between small and large tests for RAM consumption; up to 12 percentage points. But at the same time, when comparing tests on a binary size, the difference in the prediction of unreliability is even greater: up to 22 percentage points. This is similar to what we saw when analyzing the use of RAM, and this is another important conclusion of our study: the binary size is more important for deviations in the prediction of unreliability than the tool used.
findings
The size of the test chosen by the developer correlates with unreliability, but Google doesn’t have enough size options for this parameter to be really useful for forecasting.
Objectively measured indicators of binary size and RAM usage correlate strongly with the reliability of the test. This is a continuous, not step function. The latter would show unexpected jumps and would mean that at these points we move from one type of test to another (for example, from unit tests to system tests or from system tests to integration tests).
Tests written with the help of certain tools often give unpredictable results. But this can mainly be explained by the larger size of these tests. The tools themselves make a small contribution to this difference in reliability.
Care should be taken when writing a large test. Think about what code you are testing and what the minimum test for this will look like. And you need to be very careful writing big tests. Without additional protective measures, there is a high probability that you will make a test with a non-deterministic result, and such a test will have to be corrected.
Notes
- The test was considered unreliable if it showed at least one unreliable result during the week.
- I also took into account the number of libraries created for the test. In the 1% sample rate, the binary size (0.39%) and the use of RAM (0.34%) show stronger correlations than the number of libraries (0.27). Further I investigated only the binary size and use of RAM.
- Approximately 100 groups for each metric.
- r2 measures how closely the best prediction line matches the data. The value 1 means that the line completely coincides with the data.
- There are two interesting areas on the graphs, where the points in reality show a reverse trend towards a general upward trend. One begins about halfway to the first vertical line and continues for two data points, and the second begins right before the first vertical line, and ends immediately after it. Here, the sample size is large enough, so it is unlikely to be just random noise. Around these points are bunches of tests that are more or less unreliable than can be expected based on only the binary size. This is a prospect for future research.
- The distance between the observed point and the objective forecast line.
- Other web-testing tools are also blamed, but we most often use WebDriver.
- Some of the predicted percentages of unreliability for the smallest groups were negative. Although in reality there can be no negative part of the tests, but this is a possible result when using this type of prediction.
Source: https://habr.com/ru/post/327394/
All Articles