I want to know everything: business analysis. Part 2
→ The first part here
 The next item in business analysis is a description of business processes. At this stage, the so-called “As is” business process diagrams are usually drawn. And it is here that everyone is waiting for problems, as they say, out of the blue. The biggest problem is that there is no forest behind the trees. Just as in the description of business goals, people often get involved in describing how everything works right now. At the same time, it is rare for anyone to set out to understand, and how much do current processes generally correspond to how things should be? Everyone probably knows one of the rules of automation: " By automating the mess, we get an automated mess, and nothing more ." So, in order not to build another “skynet” that will destroy everyone, it is necessary to understand - “but how should everything function at all?”. And this is a very interesting task.
Of course, far from all business analysts are able to go ahead with business processes, as everything should happen in each specific case. But there are no secrets. To solve this problem, you just need to call the risk analyst, if there is one, well, or read a little about the relevant literature and think a little. It is not difficult, honestly.
So, it will not be far away from our excellent example of mail, and consider the “simplest” process - “the package delivery service”. For those who know the mail kitchen, I immediately warn you that what follows is a simplified example in a “refined form”, the way a business analyst or even a manager can see it. Details in the style of "binding to the existing infrastructure" and other "historical conditions" will not be here. In fact, all these details are considered at the third stage of work by a business analyst, which is not covered in this article. Moreover, at this stage we don’t need any technical details at all, and even say more, we should leave them in every possible way, otherwise we just make it difficult for us to do the task. Details and details, as well as the description of “As Is” processes, are needed, important and used precisely in terms of process analysis and subsequent proposals, recommendations and other things.
')
So, we have a goal - the delivery of values from the customer to the recipient. We have the option of achieving this goal:
As already said, we take a simplified process to show what to look for and what to do. As you can see, everything is quite simple and you can draw something right now. But, will not rush. As the saying goes " Be sure to bahn, and more than once. The whole world is in dust. But then ”(c). So, returning to this mortal world from a mist of dreams, we face the task, to describe how we (the company) can ensure the fulfillment of the need (delivery of the parcel post), and not only ensure it, but also ensure that the interested parties (the customer and the recipient ) will be satisfied. And the last remark is important, I would say, decisive. Yes, I know that there will be many objections in the style of “the purpose of a business is making money”, “companies do not care about customers” and many others that are quite reasonable. But, I repeat, the goal of a business is to satisfy a need. And how profitable this occupation is, is another, commercial issue.
We continue. We need to guarantee satisfaction of need. Just needs, excluding costs, volumes and other things. It can be said that if the interested parties took advantage of this service and were satisfied with the result, it means that we have successfully achieved the goal. That is, we just need to understand, and why can these same people be dissatisfied? There are few options: the expected events did not happen, or did not happen as expected. In our particular case, we have a bush of options with clarifying questions:
So, we already know something about our process, but how can we make all this accessible and understandable for any person, without reading “... ten” pages of text? The answer is known to all - you just need to draw. And, as usual, another "surprise" awaits us. Most of the used methodologies for graphical display of business processes recommend to display technical details on diagrams (BPMN, UML, EPC, etc.). There is nothing bad in this and at the stage of analysis and preparation of recommendations, the “As Is” and “To Be” diagrams should be exactly like this. But when we describe directly the process itself, its logic and rules, these details, like desert sand, cover any treasure. As a result, few people are able to immediately assess the correctness or inaccuracy of the processes themselves or their understanding by the business analyst.
So we smoothly approached the question of the invention of the next “bicycle”. Yes, we will not philosophize slyly, but simply apply “self-made” notation to describe the logic of a business process. Since this diagram is designed for untrained users (managers, analysts, developers), the use of any tricky notation will be rather detrimental.
I call my version of such a diagram the “Safed diagram”, from the Tajik / Persian “safed” - clear, clean, white. In essence, Safed diagrams contain consolidated and summarized information about the logic of the process, which simplifies understanding. I drew the diagrams myself in Excel, so no magic tools are required either. And a small explanation, I do not provide any textual description of the process, but why these or those particular features and details are indicated, or even explanations to the notation used. At this stage, my goal is to show how a diagrammatic diagram can be understood even without reading a textual description and without reducing the decoding to the used notation.
So, displaying the logic of the process “specifying a parcel delivery service” will look something like the figures below (I have broken the process into 3 parts so that it is convenient to consider it):
Part 1 ( larger ):
Part 2 ( larger ):
Part 3 ( larger ):
And additional schemes - movement and data sources for the process ( larger ):
As you can see, the diagrams clearly indicate who does what, where it comes from or where it records the data, who is responsible for their (data) relevance and filling. Though now make up job descriptions. Moreover, it is clear what duties can be combined. In a word, we have received our sight and clearly see what needs to happen.
In this case, the process diagram has places around the diagram itself, where we are free to add arbitrary explanations and details (in my case, I added a couple of interpretations and comments to the steps). If necessary, you can add a “second layer” for comments, and give interested parties the opportunity to contribute their questions, comments and / or comments to the individual steps of the process.
If you look at the above process diagram with a small amount of attention, then omissions and shortcomings are immediately visible. For example,
Probably, there will also be comments on the “redundancy” indication of sources / datasets that are present in the latter scheme. However, I turned them on for a reason. In the case of processes related to IT, and indeed, to control the process and data, this is the necessary information. The user of the diagram gets the opportunity to see and quickly get the details: who, what information and where it brings in this or that data set.
As a result, looking at the Safed diagrams, the manager, or another specialist, immediately sees all the information he needs on the process. Moreover, the shortcomings of the current process, its descriptions, or what the business analyst is proposing will often be noticeable. On the other hand, when changing the technical means that we or the customer uses within the framework of the process (internal electronic document management system, physical data carriers, etc.), the process diagram itself does not change. And this, from my point of view, is quite a big plus, since we describe the logic of the process, and not its implementation. Moreover, in the future, when comparing recommendations, it is always possible to assess whether the logic of the process has changed, whether all communications, interactions, alerts and checks have been implemented.
In principle, something similar can be portrayed in the framework of BPMN, EPC and UML. However, the recommendations for these notations are more focused on the description of specific implementations of processes, rather than on their logic. I hope everyone understands that the idea is to use such Safed diagrams as an addition, as a starting point for analyzing the processes of “As Is” and “To Be”, and not as a replacement for these diagrams.
Summarizing all the above, our main problems are not in the means (types of diagrams, classification of requirements, etc., etc.), but in the incomplete understanding of the tasks that face business analysis. As a result, instead of analyzing business processes (as we found out earlier - the steps necessary to minimize the risks of not achieving a business goal, and / or reduce costs to achieve it), colleagues are engaged in analyzing and documenting either workflows or job responsibilities of employees. In rare cases, complementing all this with the description of the workflow.
That's all I wanted to say. I hope someone will find something useful for themselves.
Good luck and success to all.

Sources of images:
1. Dog and “mess in the mail” - from here and from here , respectively.
2. Charts - personal creativity.
Process analysis and description
The next item in business analysis is a description of business processes. At this stage, the so-called “As is” business process diagrams are usually drawn. And it is here that everyone is waiting for problems, as they say, out of the blue. The biggest problem is that there is no forest behind the trees. Just as in the description of business goals, people often get involved in describing how everything works right now. At the same time, it is rare for anyone to set out to understand, and how much do current processes generally correspond to how things should be? Everyone probably knows one of the rules of automation: " By automating the mess, we get an automated mess, and nothing more ." So, in order not to build another “skynet” that will destroy everyone, it is necessary to understand - “but how should everything function at all?”. And this is a very interesting task.Of course, far from all business analysts are able to go ahead with business processes, as everything should happen in each specific case. But there are no secrets. To solve this problem, you just need to call the risk analyst, if there is one, well, or read a little about the relevant literature and think a little. It is not difficult, honestly.
So, it will not be far away from our excellent example of mail, and consider the “simplest” process - “the package delivery service”. For those who know the mail kitchen, I immediately warn you that what follows is a simplified example in a “refined form”, the way a business analyst or even a manager can see it. Details in the style of "binding to the existing infrastructure" and other "historical conditions" will not be here. In fact, all these details are considered at the third stage of work by a business analyst, which is not covered in this article. Moreover, at this stage we don’t need any technical details at all, and even say more, we should leave them in every possible way, otherwise we just make it difficult for us to do the task. Details and details, as well as the description of “As Is” processes, are needed, important and used precisely in terms of process analysis and subsequent proposals, recommendations and other things.
')
So, we have a goal - the delivery of values from the customer to the recipient. We have the option of achieving this goal:
- The customer arrives, hands over his packed values (and packaging is already a separate process and a business that we ignore now);
- The company ensures the delivery of parcels (packed values) to where they can be received by the recipient;
- The recipient, arriving at a pre-agreed place, receives the item.
As already said, we take a simplified process to show what to look for and what to do. As you can see, everything is quite simple and you can draw something right now. But, will not rush. As the saying goes " Be sure to bahn, and more than once. The whole world is in dust. But then ”(c). So, returning to this mortal world from a mist of dreams, we face the task, to describe how we (the company) can ensure the fulfillment of the need (delivery of the parcel post), and not only ensure it, but also ensure that the interested parties (the customer and the recipient ) will be satisfied. And the last remark is important, I would say, decisive. Yes, I know that there will be many objections in the style of “the purpose of a business is making money”, “companies do not care about customers” and many others that are quite reasonable. But, I repeat, the goal of a business is to satisfy a need. And how profitable this occupation is, is another, commercial issue.
We continue. We need to guarantee satisfaction of need. Just needs, excluding costs, volumes and other things. It can be said that if the interested parties took advantage of this service and were satisfied with the result, it means that we have successfully achieved the goal. That is, we just need to understand, and why can these same people be dissatisfied? There are few options: the expected events did not happen, or did not happen as expected. In our particular case, we have a bush of options with clarifying questions:
- The recipient did not receive the parcel
- The recipient asserts / is sure that it is this particular parcel that they did not receive (How can we verify this? Who transmits it and how, and how does it fix it?).
- The parcel was not delivered when it was expected:
- There are no agreed delivery deadlines (why were there other expectations? Was it fixed in any way?).
- The company (or its individual employees, contractors) are not able to perform the work: they are ill, there is no appropriate qualification, those are not available. funds (Who is following this, and when did this become known?)
- The company (or its individual employees, contractors) do not know anything about this parcel. (How to check this?)
- There are no agreed delivery deadlines (why were there other expectations? Was it fixed in any way?).
- The recipient asserts / is sure that it is this particular parcel that they did not receive (How can we verify this? Who transmits it and how, and how does it fix it?).
- The recipient is not happy with what he received and how. For example, the attachment was damaged. (In this case, it is not clear whether the attachments were checked or where these “requirements for careful handling” could be known to the executor / employee. Moreover, as an executor / employee, you can be sure that the requirements for investing and / or handling the shipment , meets the expectations of a particular customer?)
- The sender has refused services:
- the customer could not use the service, for example, there was a queue, or he did not receive information that the service is available - for example, the employee could not explain it, or he did not have the qualifications to provide it (Do appeals and results recorded?).
- the proposed service does not match the wishes of the customer, for example, at a price, or other conditions (How can we find out about this?).
- the customer could not use the service, for example, there was a queue, or he did not receive information that the service is available - for example, the employee could not explain it, or he did not have the qualifications to provide it (Do appeals and results recorded?).
So, we already know something about our process, but how can we make all this accessible and understandable for any person, without reading “... ten” pages of text? The answer is known to all - you just need to draw. And, as usual, another "surprise" awaits us. Most of the used methodologies for graphical display of business processes recommend to display technical details on diagrams (BPMN, UML, EPC, etc.). There is nothing bad in this and at the stage of analysis and preparation of recommendations, the “As Is” and “To Be” diagrams should be exactly like this. But when we describe directly the process itself, its logic and rules, these details, like desert sand, cover any treasure. As a result, few people are able to immediately assess the correctness or inaccuracy of the processes themselves or their understanding by the business analyst.
So we smoothly approached the question of the invention of the next “bicycle”. Yes, we will not philosophize slyly, but simply apply “self-made” notation to describe the logic of a business process. Since this diagram is designed for untrained users (managers, analysts, developers), the use of any tricky notation will be rather detrimental.
I call my version of such a diagram the “Safed diagram”, from the Tajik / Persian “safed” - clear, clean, white. In essence, Safed diagrams contain consolidated and summarized information about the logic of the process, which simplifies understanding. I drew the diagrams myself in Excel, so no magic tools are required either. And a small explanation, I do not provide any textual description of the process, but why these or those particular features and details are indicated, or even explanations to the notation used. At this stage, my goal is to show how a diagrammatic diagram can be understood even without reading a textual description and without reducing the decoding to the used notation.
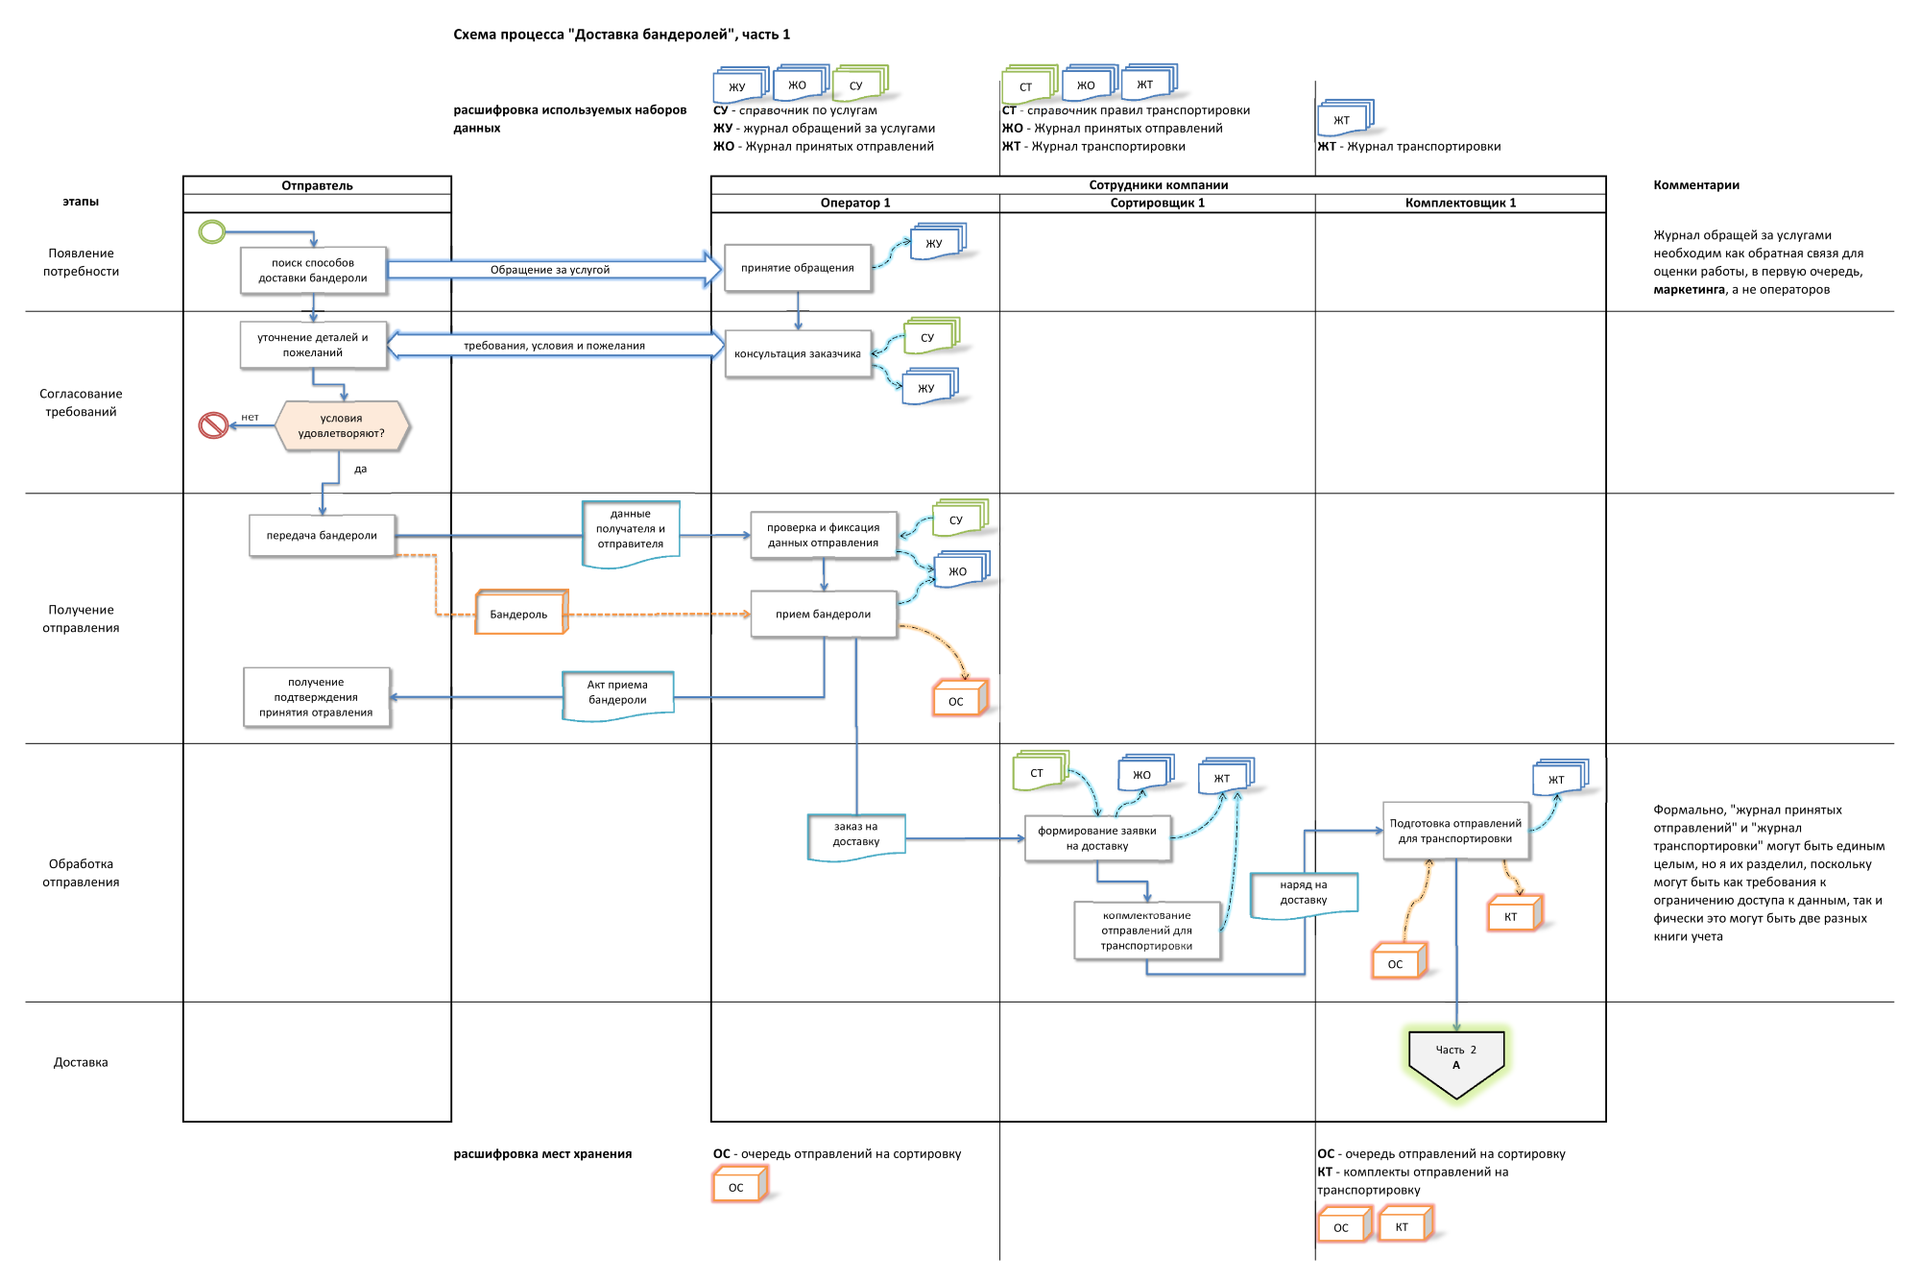
So, displaying the logic of the process “specifying a parcel delivery service” will look something like the figures below (I have broken the process into 3 parts so that it is convenient to consider it):
Part 1 ( larger ):
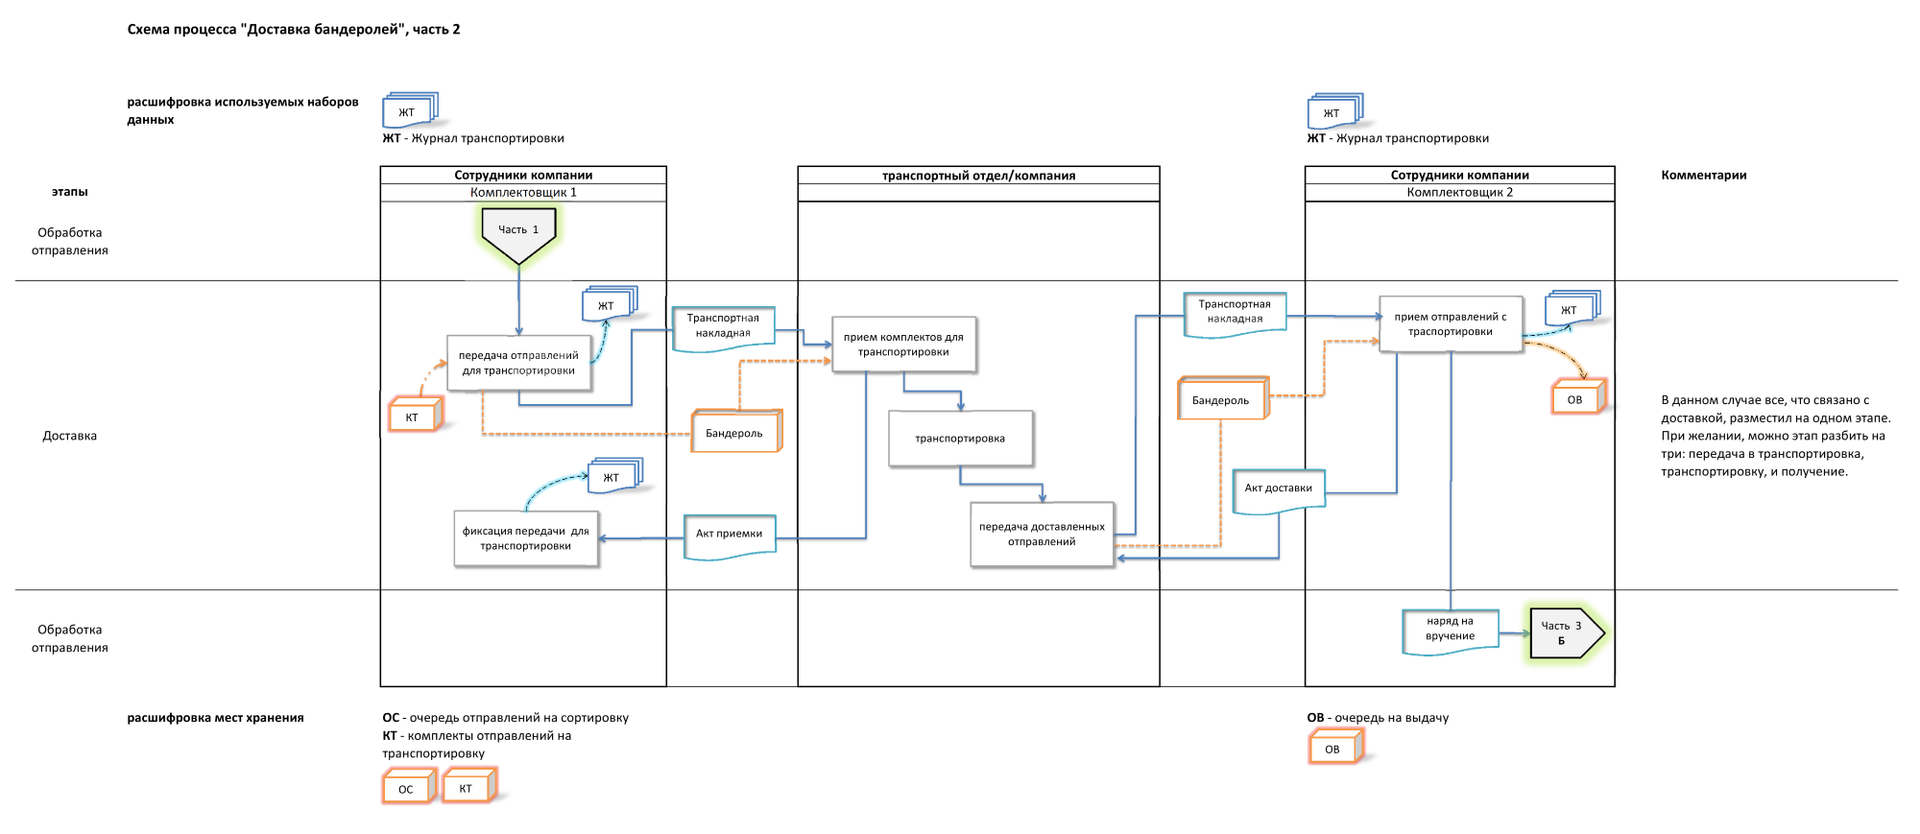
Part 2 ( larger ):
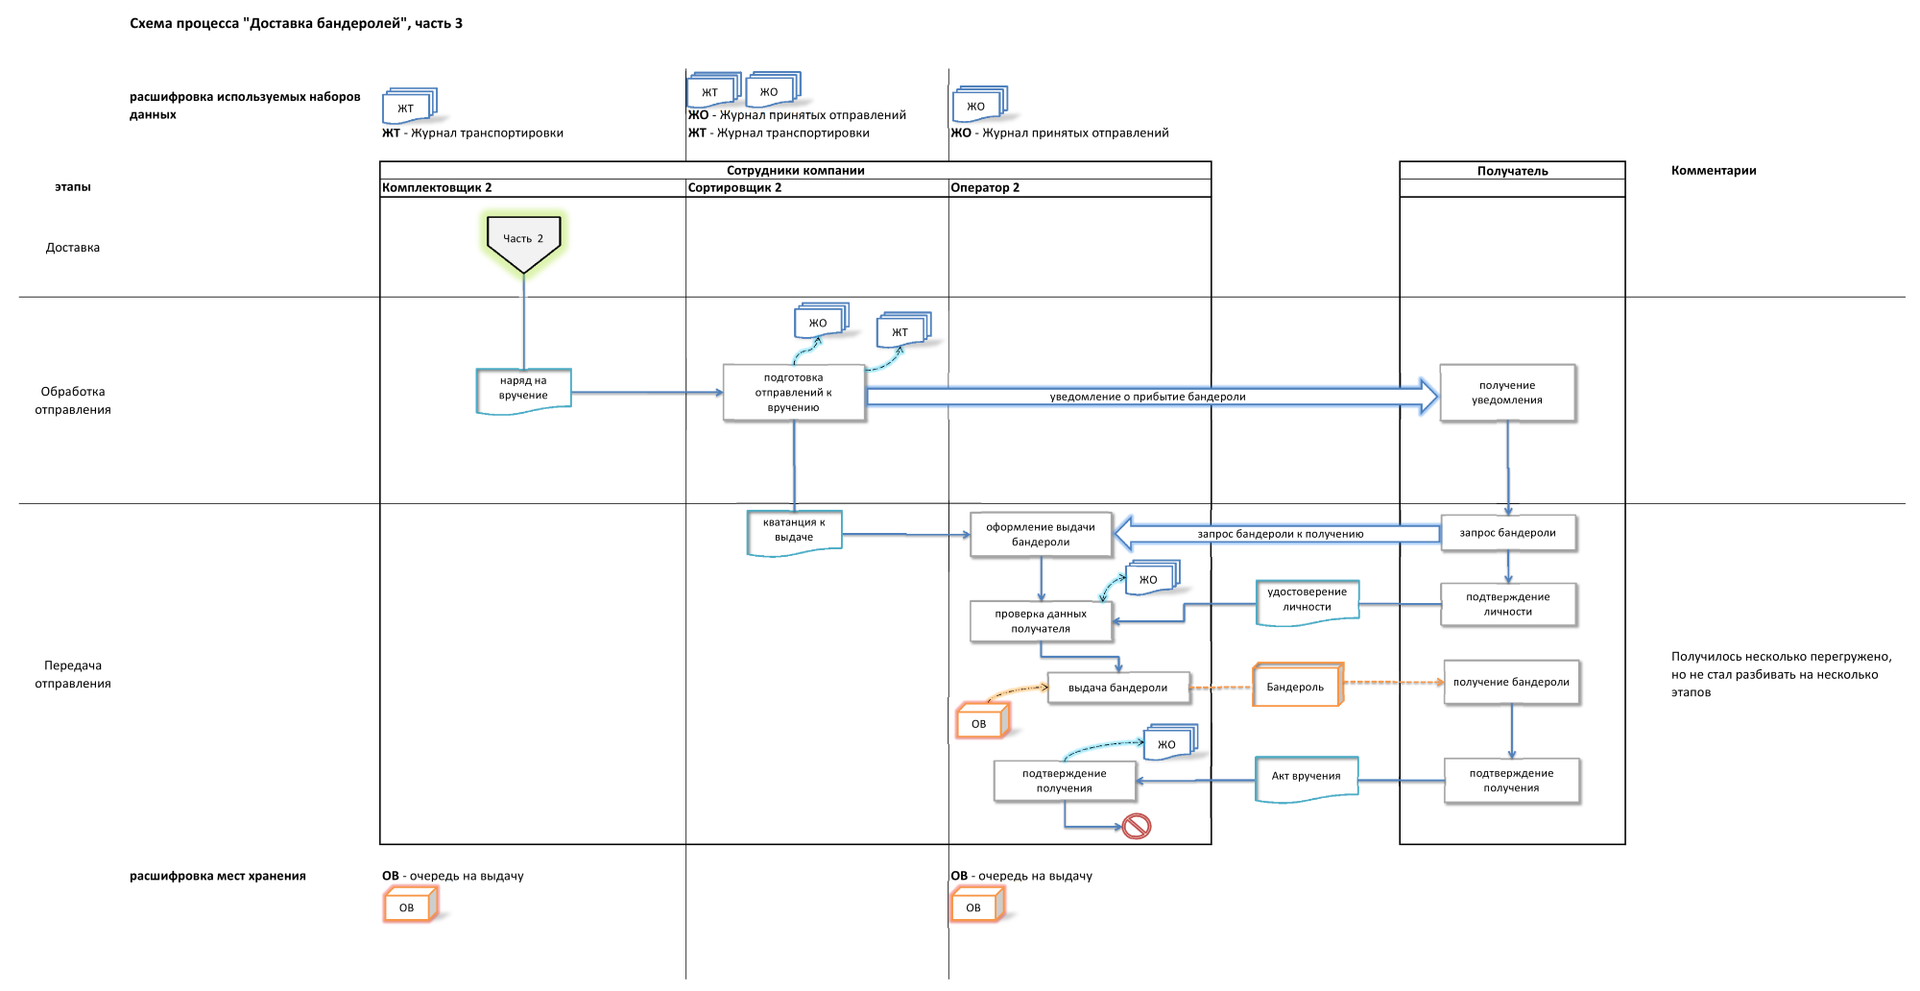
Part 3 ( larger ):
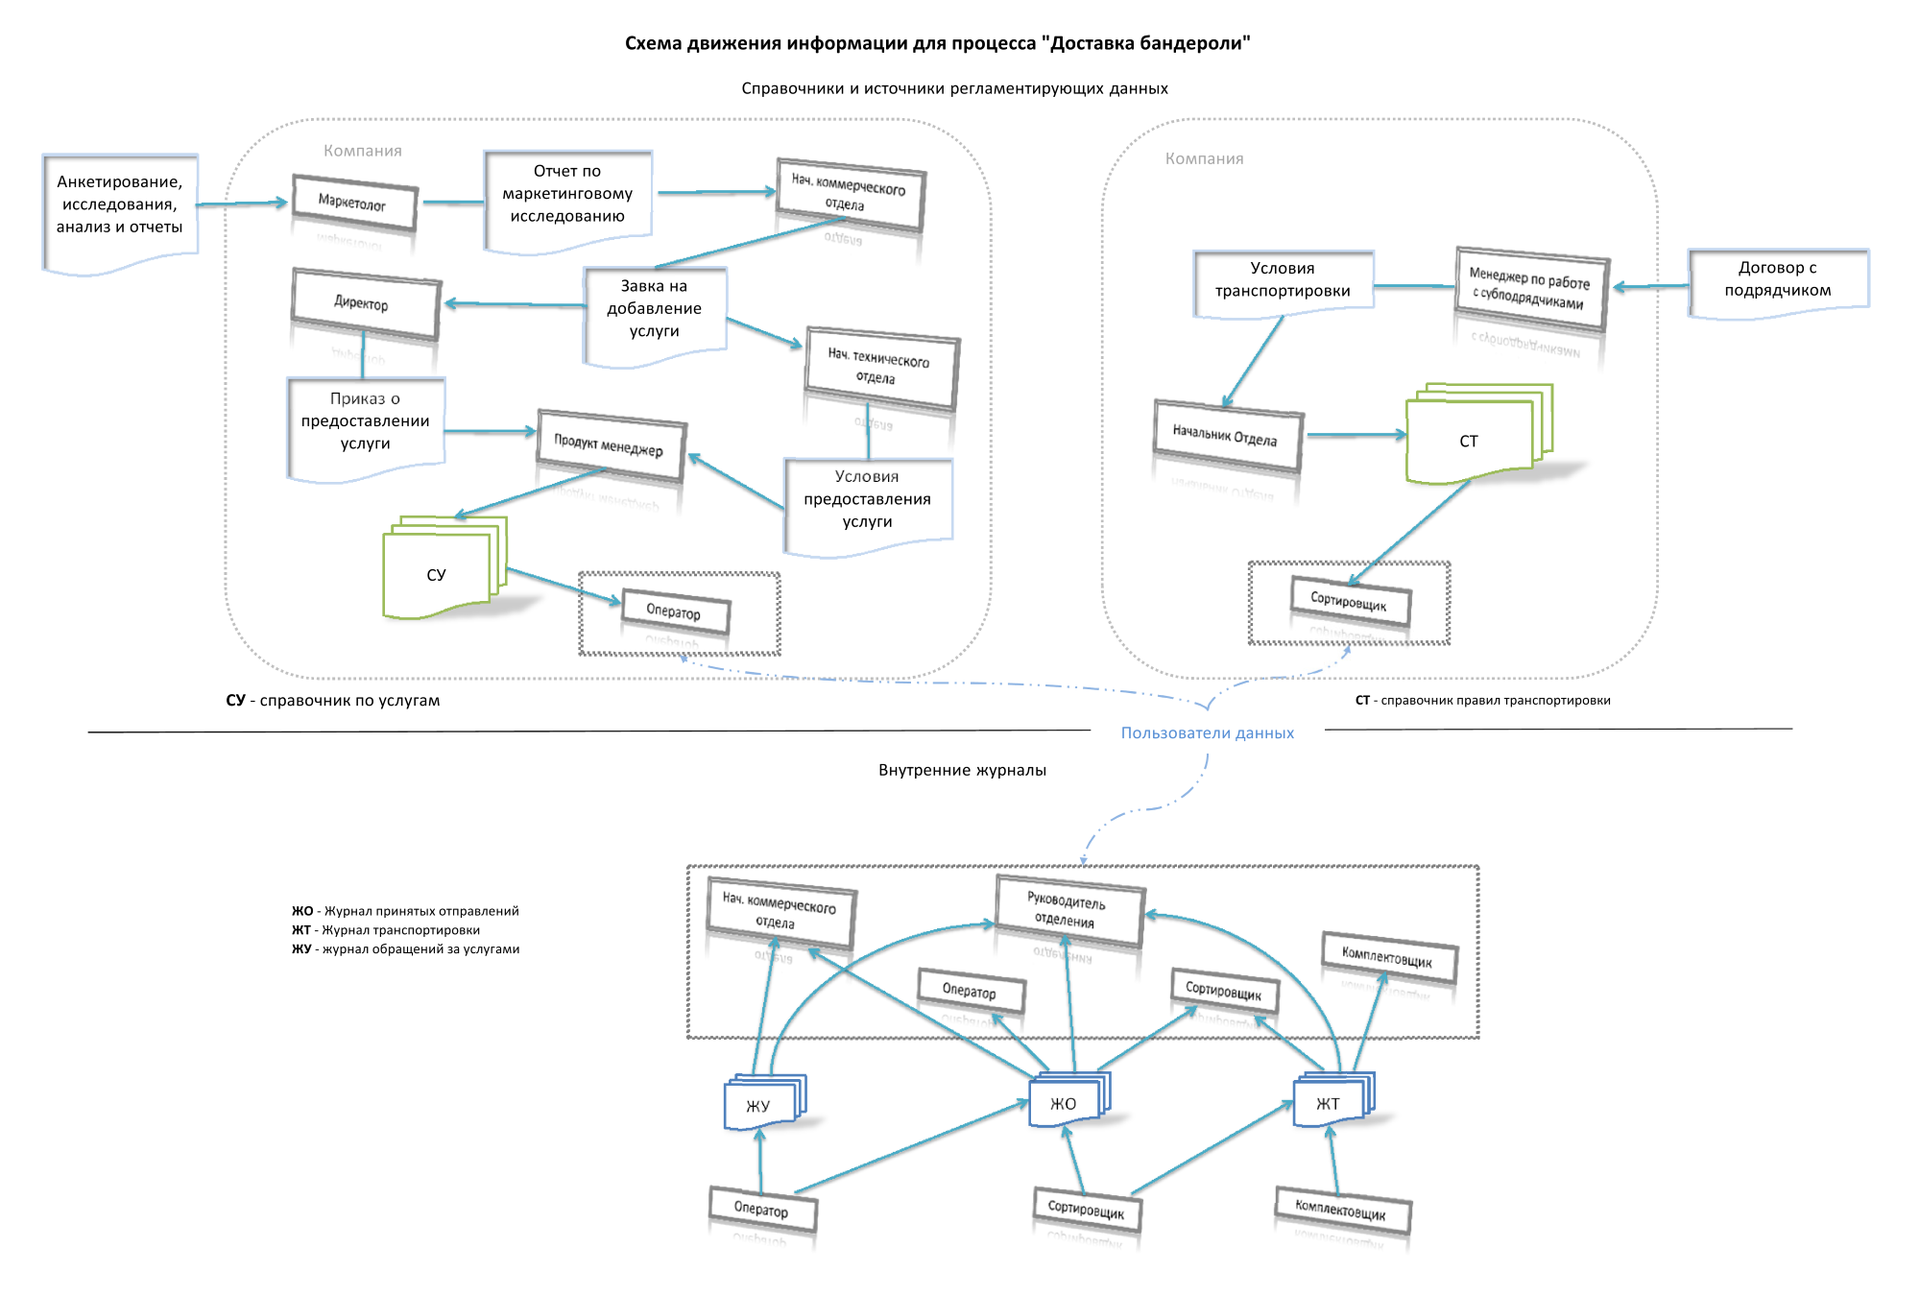
And additional schemes - movement and data sources for the process ( larger ):
As you can see, the diagrams clearly indicate who does what, where it comes from or where it records the data, who is responsible for their (data) relevance and filling. Though now make up job descriptions. Moreover, it is clear what duties can be combined. In a word, we have received our sight and clearly see what needs to happen.
In this case, the process diagram has places around the diagram itself, where we are free to add arbitrary explanations and details (in my case, I added a couple of interpretations and comments to the steps). If necessary, you can add a “second layer” for comments, and give interested parties the opportunity to contribute their questions, comments and / or comments to the individual steps of the process.
If you look at the above process diagram with a small amount of attention, then omissions and shortcomings are immediately visible. For example,
- If we consider the stage of transportation, we see that we have no control over what happens to the parcel post after transferring it to the transport department or the company. Thus, it is necessary either to additionally require monitoring of delivery from subcontractors, or on our side to monitor the “transportation log”, in case of delays or “disappearances” of shipments. In an amicable way, this nuance should be separately described and reflected in the process diagram.
- For the role / position of "Picker", no sources of regulatory data are indicated. On the one hand, all the information may be in the “delivery order” and / or in the “Transportation Journal”, on the other hand, this may be the result of the omission of the business analyst. In any case, there should be explanations, because there is a risk of incorrect actions of the employee with all the consequences.
- Similarly, as in the previous comment, when receiving shipments from transportation and further, in the final stages, not one of their employees indicated regulatory sources
Probably, there will also be comments on the “redundancy” indication of sources / datasets that are present in the latter scheme. However, I turned them on for a reason. In the case of processes related to IT, and indeed, to control the process and data, this is the necessary information. The user of the diagram gets the opportunity to see and quickly get the details: who, what information and where it brings in this or that data set.
Case study
So, a very famous company in Russia, about which everyone has heard. And again the process of introducing a system to automate sales.
Representatives of the company each time proudly stated that the company all processes are not only described, but also modeled in ARIS. This is not counting the "full Kaizen" in everything. At the same time, unfortunately, they could not provide a description of the processes, and as a result, in rush they carried out an express "business analysis", the quality of which was terrible.
And now, already at the stage of system implementation, with all sorts of plans, schemes, descriptions signed by high sides, I am preparing a customer team that will implement, maintain, operate the system at the head office and at distributors. And again miracles happen with the “recommended assortment”. This time, out of about 20 positions (one for all), about half are missing in the work information system. That is, in Axapta, the customer does not have product items that a couple of months ago were signed by the General Director, as key, for sales during the year.
We begin to understand, the Project Manager (PM) on the part of the Customer, the General, the Head of the Commercial Department, cannot clearly say where this list came from. As you understand, in the described business processes, neither the order itself, nor the way in which it is formed, is even mentioned. At the checkout, in accounting (sitting on 1C there) - these positions do not exist. The next day, the first half of the day, all the participants in the submission find reasons for the problem “to score” (a planning meeting, a meeting, a meeting, a rally, a bell, a dinner). We found some positions on our own that remotely resemble those in the order. All the same, about 5 of them do not even have remote analogues. After lunch, I put everyone on their ears, they rummaged everything they could - there is no such product and a point. Neither IT, nor an extract, nor accounting do not surrender, and are silent as guerrillas during interrogation in the Gestapo. And here, after repeated question multiple times, “but how do these data eventually appear in the system, and who is responsible for this,” one of the girls uncertainly suggests, “Why don't you ask in the NSI department?”. To talk about the fact that there was no such department in the diagram of the divisions and departments of the company, which is given in the report of the business analyst, I think there is no need.
The next day, in the morning I visit the backyard of the company, and on the second sentence, the head of the department asks “who gave you these goods? We have not been producing them for 3 years already ”? A curtain.
As a result, the project was initially launched without the functionality of “recommended products”, because inside the company they decided to figure out how to create a list, and who is responsible for what. In a company that was proud of a complete description and modeling of all business processes.
If there were, at least, a data dependency diagram, we would not lose two days to the elementary task of finding the source of information. Ideally, this situation should not happen at all.
As a result, looking at the Safed diagrams, the manager, or another specialist, immediately sees all the information he needs on the process. Moreover, the shortcomings of the current process, its descriptions, or what the business analyst is proposing will often be noticeable. On the other hand, when changing the technical means that we or the customer uses within the framework of the process (internal electronic document management system, physical data carriers, etc.), the process diagram itself does not change. And this, from my point of view, is quite a big plus, since we describe the logic of the process, and not its implementation. Moreover, in the future, when comparing recommendations, it is always possible to assess whether the logic of the process has changed, whether all communications, interactions, alerts and checks have been implemented.
In principle, something similar can be portrayed in the framework of BPMN, EPC and UML. However, the recommendations for these notations are more focused on the description of specific implementations of processes, rather than on their logic. I hope everyone understands that the idea is to use such Safed diagrams as an addition, as a starting point for analyzing the processes of “As Is” and “To Be”, and not as a replacement for these diagrams.
Summarizing all the above, our main problems are not in the means (types of diagrams, classification of requirements, etc., etc.), but in the incomplete understanding of the tasks that face business analysis. As a result, instead of analyzing business processes (as we found out earlier - the steps necessary to minimize the risks of not achieving a business goal, and / or reduce costs to achieve it), colleagues are engaged in analyzing and documenting either workflows or job responsibilities of employees. In rare cases, complementing all this with the description of the workflow.
That's all I wanted to say. I hope someone will find something useful for themselves.
Good luck and success to all.
Sources of images:
1. Dog and “mess in the mail” - from here and from here , respectively.
2. Charts - personal creativity.
Source: https://habr.com/ru/post/327370/
All Articles