Analysis of publications on Habrahabr over the past six months. Statistics, useful finds and ratings
Long time no one collected statistics about posts on Habrahabr. We at Cloud4Y decided to find out what changes have taken place over the past six months. We were interested in:
And much more…

')
On April 24, 2017, statistics was collected for all the latest publications on Habrahabr. It turned out that in the period from September 20, 2016 to April 22, 2017:
For the reliability of statistics from more than 6.5k of publications, we deleted the publication, the number of views of which does not fall in 99.7% of the area of the normal distribution of views. Such posts can spoil the statistics, greatly affecting the mean values and standard deviations in further calculations. We deleted the publications until they all fit into . A total of 7.4% of super-publications were removed.
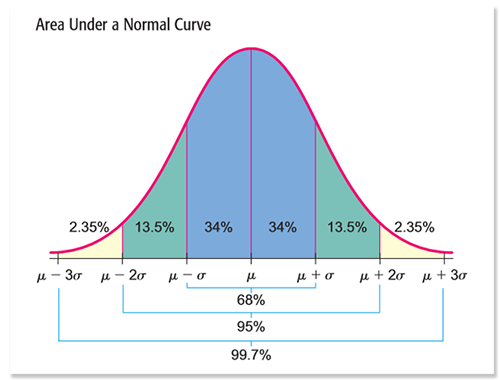
Normal Density
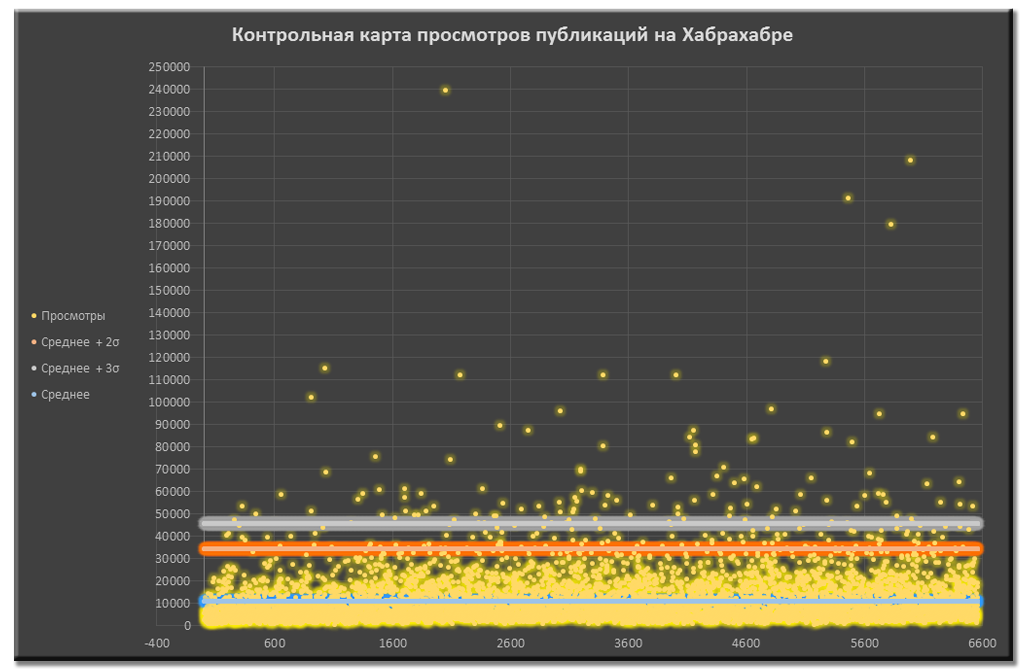 Control card views of publications before data cleansing
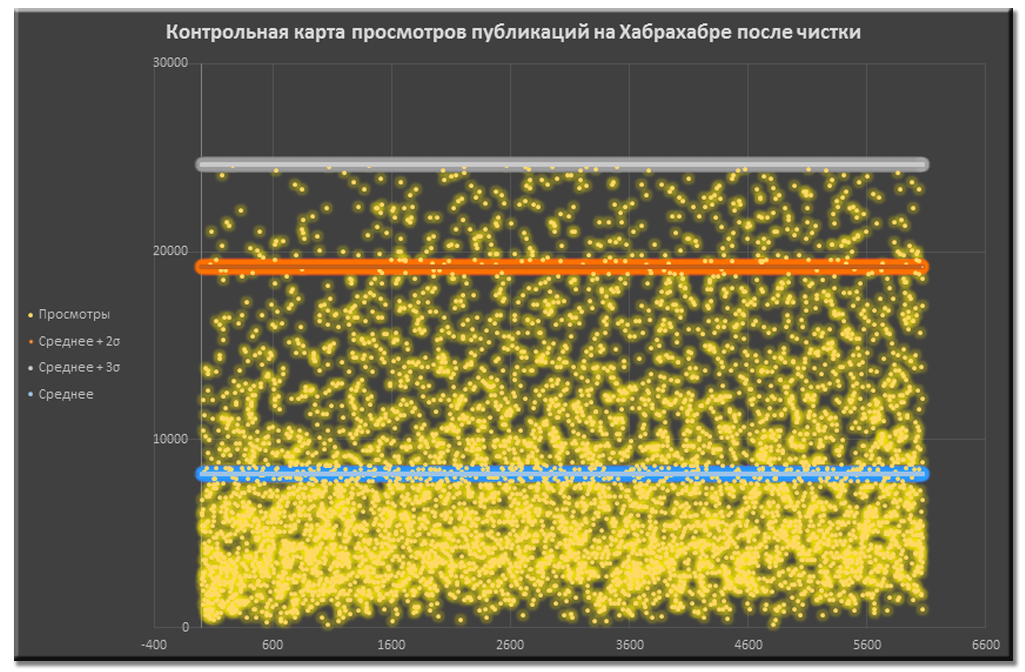 Control card views publications after data cleansing
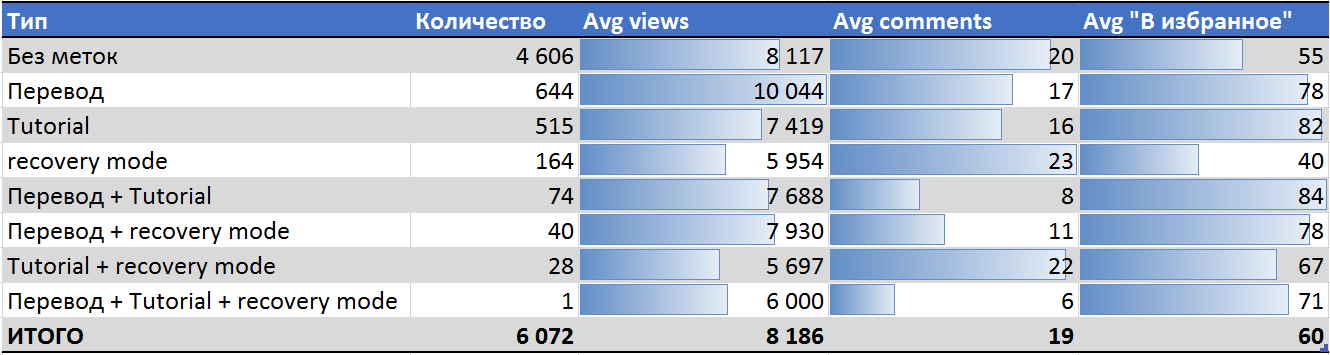
Among the cleaned data set
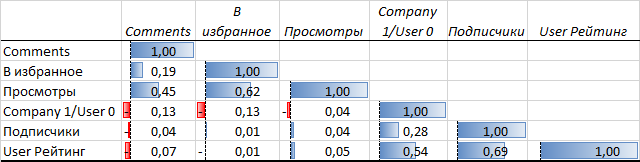
Pairwise correlation of key indicators
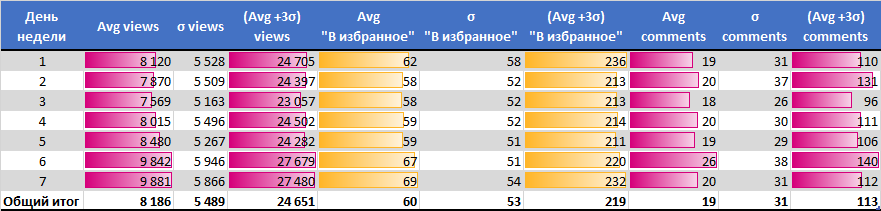
The best days of the week
Best time

The best publication time when recording the day of the week is the night from Friday to Saturday or Sunday evening.
 The image can be enlarged by clicking (opens in the current window)
According to the meaning of the law of large numbers, there is always a finite number of tests where, with any probability less than 1 given in advance, the relative frequency of occurrence of a certain event will differ as little as desired from its probability. On this property, methods for estimating probability are based on an analysis of a finite sample. Our sample for each section had more than 30 empirical test results — actual publication rates.
When publishing one particular article, the above patterns may not have a significant impact or will be neutralized by other factors. If you plan to publish a series of posts, the use of these patterns can be beneficial. In each case, the content of the article has the greatest impact on the popularity of the article.
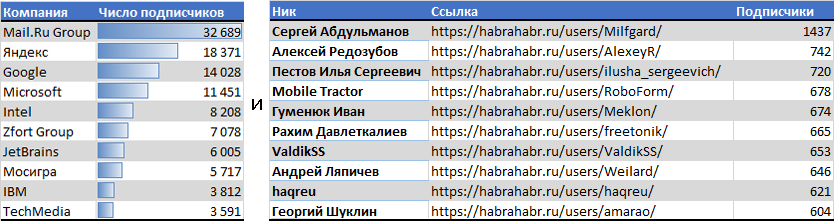
TOP10 Companies and Users with the highest number of subscribers
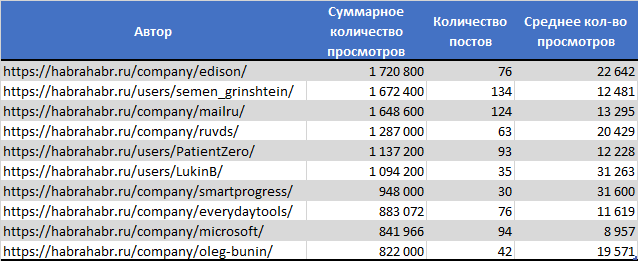
TOP10 with the most views
TOP10 with the most comments

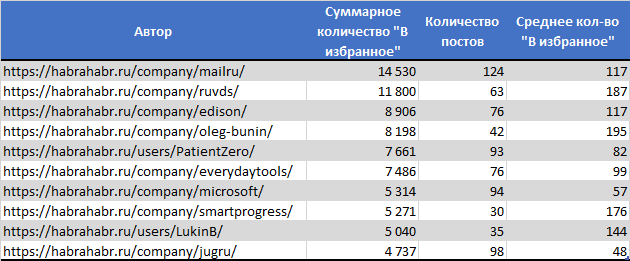
TOP10 with the highest number of favorites
If you are interested in any dependence of the indicators, leave a comment, if possible, try to calculate and publish. Write to us and we will send you a link to the Excel file with information about the publications that we have collected.
- What day of the week and time of day is best published?
- Is there a relationship between the number of subscribers and the popularity of posts?
- Which posts are more: educational materials, translations or other?
And much more…
')
What have we done?
On April 24, 2017, statistics was collected for all the latest publications on Habrahabr. It turned out that in the period from September 20, 2016 to April 22, 2017:
- Created 6550 publications, excluding "Megaposts" with the announcement in the top menu and posts published by companies that have ceased activity on Habré.
- On average, 30 posts were published per day, and more than 900 posts per month.
- About 12.5% was tagged with “Translation”, 10% marked “Tutorial” and 4% marked with “recovery mode”. About 76% of the posts did not have such marks, while some entries are marked with two or more tags.
For the reliability of statistics from more than 6.5k of publications, we deleted the publication, the number of views of which does not fall in 99.7% of the area of the normal distribution of views. Such posts can spoil the statistics, greatly affecting the mean values and standard deviations in further calculations. We deleted the publications until they all fit into . A total of 7.4% of super-publications were removed.
Normal Density
Control card views of publications before data cleansing Control card views publications after data cleansingA useful find # 1
Among the cleaned data set
- Translations gain the most views and better than the average post are added to favorites, causing less than the average number of comments.
- Learning materials are reviewed fewer times than the average article, but are best added to your favorites, especially in the case of translated Tutorial.
- For a rehabilitation post, a negative karma user is best served to translate a valid material.
A useful find # 2
- The number of subscribers does not affect the number of views viewed. For example, google with 14,000 subscribers at the time of publication scored 570 views of one of their posts in 40 days.
- In order to worst convert the number of subscribers into the number of views, you need to publish articles in parts and add part numbers to the heading. By 3 or 4 parts of the publication, the number of views, as a rule, falls to a minimum. The principle of "funnel" works. Those who have not read the first part, rarely take on the second. Among those who read article 1 of the series, only a fraction of users will read the second. Perhaps the output will be to arrange information about other articles in the series within the publication.
- Invitations and announcements, of course, will collect a small number of views. Statistics recommends integrating invitations and announcements into articles.
Pairwise correlation of key indicators
A useful find # 3
The best days of the week
- by views Saturday and Sunday (worst Wednesday).
- by the number of additions to favorites Monday and Sunday.
- by the number of comments Tuesday and Saturday.
Best time
- by number of views from 23:30 to 00:00
- by number of additions to favorites from 6:30 to 8:30
- by number of comments from 5:30 to 7:30
The best publication time when recording the day of the week is the night from Friday to Saturday or Sunday evening.
The image can be enlarged by clicking (opens in the current window)About conclusions
According to the meaning of the law of large numbers, there is always a finite number of tests where, with any probability less than 1 given in advance, the relative frequency of occurrence of a certain event will differ as little as desired from its probability. On this property, methods for estimating probability are based on an analysis of a finite sample. Our sample for each section had more than 30 empirical test results — actual publication rates.
When publishing one particular article, the above patterns may not have a significant impact or will be neutralized by other factors. If you plan to publish a series of posts, the use of these patterns can be beneficial. In each case, the content of the article has the greatest impact on the popularity of the article.
Ratings
TOP10 Companies and Users with the highest number of subscribers
TOP10 with the most views
TOP10 with the most comments
TOP10 with the highest number of favorites
- The greatest number of comments collected article "Why are we angry?"
- The most viewed article, which also has the greatest number of favorites, was “How to“ punch ”a person on the Internet: we use Google operators and logic”
- 2nd place in the number of additions to favorites was taken by the publication "The most useful techniques of working in the Linux command line"
PS
If you are interested in any dependence of the indicators, leave a comment, if possible, try to calculate and publish. Write to us and we will send you a link to the Excel file with information about the publications that we have collected.
Source: https://habr.com/ru/post/327352/
All Articles