Capacity management is another problem.
It's great when your IT brainchild is faced with a growth in revenue, users, CTR, processed documents, loan applications, number of branches and other nicely scratching things. All these things are called business drivers, which in the right situation correlate with the load on the IT infrastructure located under your service. Proper capacity planning will protect you from epic fails on Black Friday (so that it does not become really black;)) and your budget on all other days. Today we will talk not about the power management process itself, but about the technical side of the issue. I’ll tell you what reports can be used to estimate trends and build correlation matrices. Let's briefly tell what experience we have saved, and ask all the questions in the comments or a personal message. Go!

The first assessment method is time analysis. By itself, it is of several types.
1. Performance over time (PTA - Performance vs Time analysis) - shows the values of one or more performance metrics for a selected time interval. You can also visualize several metrics belonging to different systems at different scales.
')
The main objectives of this type of analysis are:
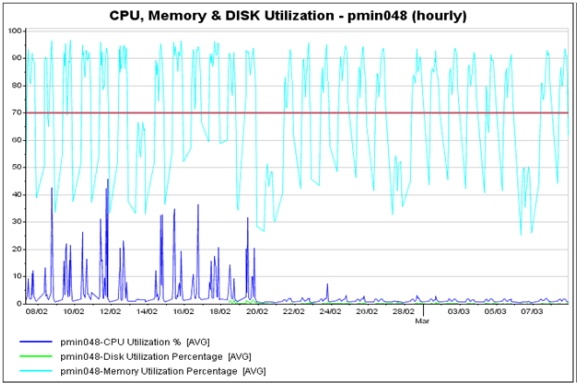
An example of a time analysis with visualization of 3 metrics - CPU, RAM and disk memory loads
2. Time load (LTA - Load vs Time analysis) - shows the behavior of one or several business metrics in the selected time interval. An example is the number of transactions over a specific period of time.
LTA main tasks:

Sample business metrics analysis
3. Configuration analysis (CA) - shows the historical configuration values of the end servers, etc. for the selected time period.
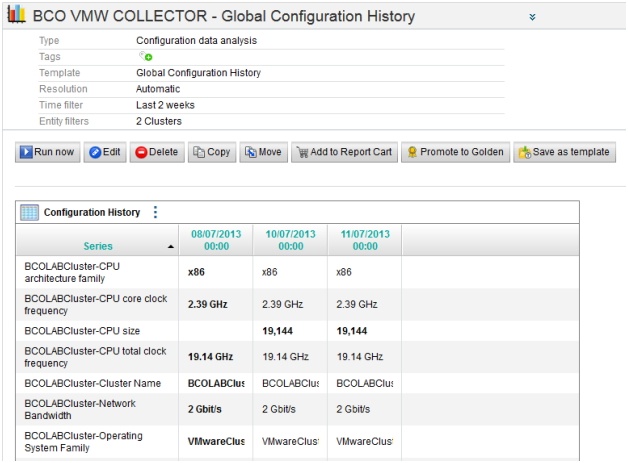
An example of a temporary analysis of hardware configurations
The second assessment method is correlation analysis.
When analyzing data, links are created between business drivers and technological resources in accordance with the correlation coefficient. The correlation coefficient is such a beast that shows the degree of interconnection of two metrics and can take values from -100% (complete inverse relationship) to + 100% (complete direct dependence). A value of 0 (and close to it) indicates no dependence between a pair of metrics.
When building a report, correlation analysis is used to build correlation maps and business metrics maps. Business metrics cards are a key component in building a report, reflecting the dependence of business indicators and the resources used. For example, in the figure below, the business metrics (the number of requests from the web client and the number of sent messages to the web client) depend on the application server resources and the DBMS on which the application is running.

Metrics dependency example
Based on this information, business metric cards are configured for subsequent performance analysis by business load.

Sample business metrics card
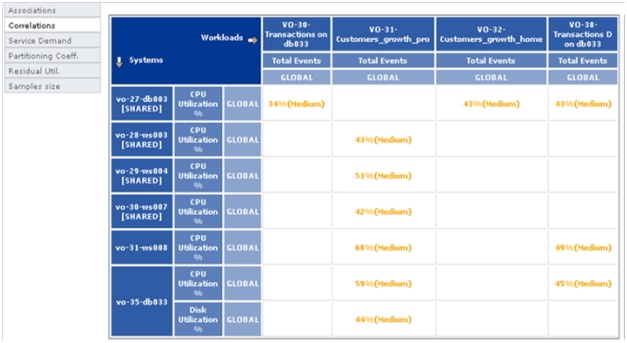
Calculation of correlation of values of performance parameters and business metrics
As a result, the degree of utilization of specific resources on specific servers by business metrics is revealed:

Resource utilization load by business metrics
The obtained data allows you to visually reflect the dependence of business metrics on the allocated resources and to determine saturation points, etc .:
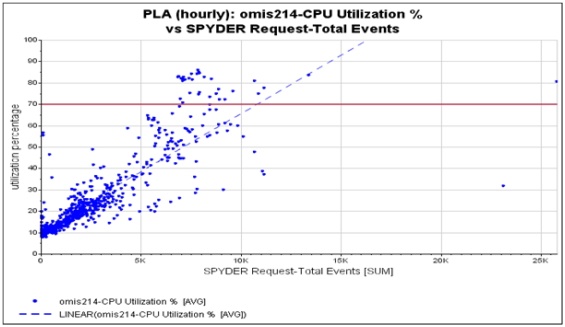
Dependence and saturation point of the total number of requests in the business system to CPU load
Also, correlation analysis is used to compare any pairs of metrics in the system. These can be either business metrics or performance metrics:
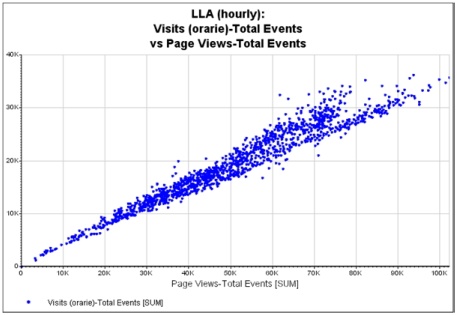
An example of comparing two business metrics (the number of visits to the site against the number of pages viewed

Performance Metrics Comparison Example
And finally, the third type of assessment - the calculation of trends.
The future behavior prediction model (trend calculation) is used to determine future values and the dynamics of changes in one or more performance indicators (or business metrics) from historical data.
The figure below shows the model of the possible use of this mechanism. The system loaded historical data on the download of the outgoing communication channel. For this parameter, a threshold value is set - 70% of the channel load from the maximum possible. Using the extrapolation mechanism, the trend of the parameter growth dynamics is automatically built up and the saturation time (reaching the threshold value) is determined - less than 1 calendar month.

An example of using trend calculation to determine saturation time
Such a tool is also used to conduct “what-if” analysis. For example, the following is a variant of the scenario for calculating the increase in total disk space. The graph in green shows the allocated volume and the point of increasing disk space (mid-March). Blue is a graph of disk space usage. Thus, the constructed trend and “what-if” analysis (disc addition) show that the saturation point will not come until the end of the year.
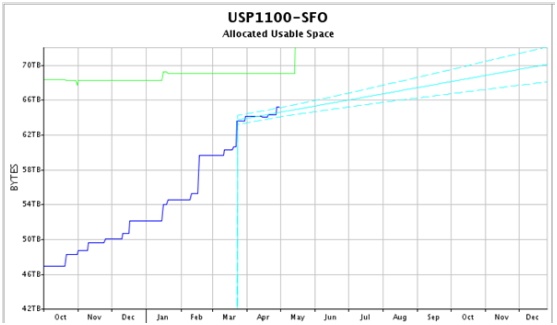
Option scenario for calculating the increase in total disk space
“What-if” analysis is also used to calculate the performance of the IT infrastructure, depending on the changing values of business metrics.
The figure below shows an example of calculating the maximum possible indicators for entering the system and the number of orders sent. The first part of the table contains business metrics (Visits, Orders Received) and their current values (30,000 visits per hour and 1,000 orders). The Target column indicates the checked values of the parameters (120 000 and 5 000). As a result, you can calculate the maximum load on the infrastructure (61 500 and 2 400 respectively), and you can also see the point of failure - CPU performance (red dot on the table below).
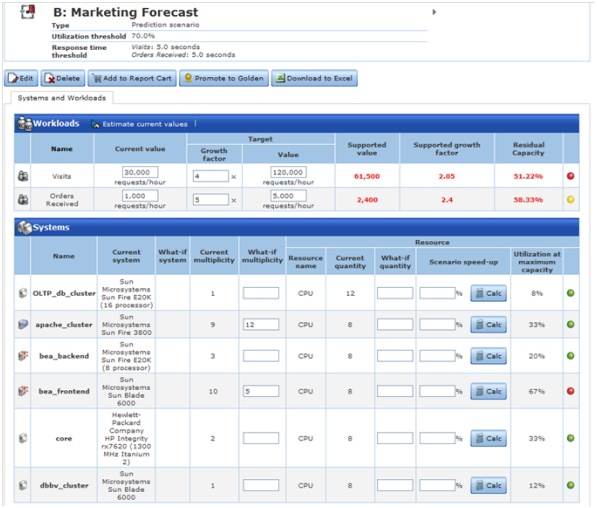
An example of calculating the maximum possible indicators of visits to the system and the number of orders sent
Thus, it is possible to determine the maximum capacity of the infrastructure, determine the bottlenecks and make a timely decision on the modernization.
Please contact us with questions in the comments. And if the task requires a slightly more thoughtful approach, our consulting - he , like the May holidays - will always please you.
At the end of the post there are a couple of polls, it will be great if you can spend a couple of tens of seconds on them. Thank!
The author of the article: Anton Kasimov , architect of control systems, Jet Infosystems.

The first assessment method is time analysis. By itself, it is of several types.
1. Performance over time (PTA - Performance vs Time analysis) - shows the values of one or more performance metrics for a selected time interval. You can also visualize several metrics belonging to different systems at different scales.
')
The main objectives of this type of analysis are:
- identifying the most critical resources for later use in a “what-if” analysis;
- creating threshold (baseline) performance levels for systems based on historical data for:
- checking or changing time intervals to be used in further analysis,
- trend analysis (linear, moving averages),
- detection of typical behavior (daily, weekly, monthly);
- determination of peak loads;
- definitions of repetitive bursts and their values.

An example of a time analysis with visualization of 3 metrics - CPU, RAM and disk memory loads
2. Time load (LTA - Load vs Time analysis) - shows the behavior of one or several business metrics in the selected time interval. An example is the number of transactions over a specific period of time.
LTA main tasks:
- analyze and select business metrics based on the following criteria:
- significance of applications
- dependence between business metrics;
- checking or changing time intervals to be used in further analysis;
- trend analysis (linear, moving averages);
- detection of typical behavior (daily, weekly, monthly), possible load peaks when performing periodic tasks;
- definition of repeating bursts and their values;
- determining business metrics thresholds for calculating averages and variance.

Sample business metrics analysis
3. Configuration analysis (CA) - shows the historical configuration values of the end servers, etc. for the selected time period.

An example of a temporary analysis of hardware configurations
The second assessment method is correlation analysis.
When analyzing data, links are created between business drivers and technological resources in accordance with the correlation coefficient. The correlation coefficient is such a beast that shows the degree of interconnection of two metrics and can take values from -100% (complete inverse relationship) to + 100% (complete direct dependence). A value of 0 (and close to it) indicates no dependence between a pair of metrics.
When building a report, correlation analysis is used to build correlation maps and business metrics maps. Business metrics cards are a key component in building a report, reflecting the dependence of business indicators and the resources used. For example, in the figure below, the business metrics (the number of requests from the web client and the number of sent messages to the web client) depend on the application server resources and the DBMS on which the application is running.

Metrics dependency example
Based on this information, business metric cards are configured for subsequent performance analysis by business load.

Sample business metrics card

Calculation of correlation of values of performance parameters and business metrics
As a result, the degree of utilization of specific resources on specific servers by business metrics is revealed:

Resource utilization load by business metrics
The obtained data allows you to visually reflect the dependence of business metrics on the allocated resources and to determine saturation points, etc .:

Dependence and saturation point of the total number of requests in the business system to CPU load
Also, correlation analysis is used to compare any pairs of metrics in the system. These can be either business metrics or performance metrics:

An example of comparing two business metrics (the number of visits to the site against the number of pages viewed

Performance Metrics Comparison Example
And finally, the third type of assessment - the calculation of trends.
The future behavior prediction model (trend calculation) is used to determine future values and the dynamics of changes in one or more performance indicators (or business metrics) from historical data.
The figure below shows the model of the possible use of this mechanism. The system loaded historical data on the download of the outgoing communication channel. For this parameter, a threshold value is set - 70% of the channel load from the maximum possible. Using the extrapolation mechanism, the trend of the parameter growth dynamics is automatically built up and the saturation time (reaching the threshold value) is determined - less than 1 calendar month.

An example of using trend calculation to determine saturation time
Such a tool is also used to conduct “what-if” analysis. For example, the following is a variant of the scenario for calculating the increase in total disk space. The graph in green shows the allocated volume and the point of increasing disk space (mid-March). Blue is a graph of disk space usage. Thus, the constructed trend and “what-if” analysis (disc addition) show that the saturation point will not come until the end of the year.

Option scenario for calculating the increase in total disk space
“What-if” analysis is also used to calculate the performance of the IT infrastructure, depending on the changing values of business metrics.
The figure below shows an example of calculating the maximum possible indicators for entering the system and the number of orders sent. The first part of the table contains business metrics (Visits, Orders Received) and their current values (30,000 visits per hour and 1,000 orders). The Target column indicates the checked values of the parameters (120 000 and 5 000). As a result, you can calculate the maximum load on the infrastructure (61 500 and 2 400 respectively), and you can also see the point of failure - CPU performance (red dot on the table below).

An example of calculating the maximum possible indicators of visits to the system and the number of orders sent
Thus, it is possible to determine the maximum capacity of the infrastructure, determine the bottlenecks and make a timely decision on the modernization.
Please contact us with questions in the comments. And if the task requires a slightly more thoughtful approach, our consulting - he , like the May holidays - will always please you.
At the end of the post there are a couple of polls, it will be great if you can spend a couple of tens of seconds on them. Thank!
The author of the article: Anton Kasimov , architect of control systems, Jet Infosystems.
Source: https://habr.com/ru/post/327282/
All Articles