Web analytics. How the numbers lie to us

About 15 years ago I began my journey in the development of websites and online advertising. The main argument in the negotiations with the client was that "everything can be counted on the Internet." It was meant, of course, unlike TV, radio, banner advertising and other non-Internet channels.
At that time, everything seemed clear and transparent. So it, in fact, was. Over time, technology began to change our world faster and faster. Applications, mobile sites, advertising systems, web analytics tools ...
As a result, it became so complicated that for me now the main criterion for evaluating any information was reliability.
I suggest you get acquainted with how the numbers confuse us. And how to correctly interpret the data we receive in J.Metrica, Google Analytics, other analytics services, blogs.
Naturally, for the correct understanding of the article you need to know the most basic terms - conversion, bounce rate and so on. There are things that are obvious, but I'm sure, and you will learn something new.
Briefly about the content:
- The study of statistics in the development of site structure
- Top 10, damn it
- Using only one statistics collection system
- Examination of indicators separately, not in aggregate
- Use of Google Analytics and Yandex. Metrics as sole sources of marketing data
- "Dark Traffic"
- Mismatch of data by Ya.Metriki and Ya.Direkt
- Notorious conversion
- The smaller the absolute value, the more important the meaning.
- What else is worth remembering
Errors in the development of the site structure
Before you create the structure of the site, many webmasters are not only studying competitors, but also exactly how they are looking for information about the services and products of the company in Yandex and Google. And also for what phrases you need to advertise in search engines.
In RuNet, this usually happens with the help of the Yandex.Wordstat service. And here is just the first dirty trick. Initially, this tool was created for planning advertising campaigns in Yandex.Direct. Therefore, it is necessary to use it to develop the site structure with some reservations.
For example, we create a website for a construction Moscow company and estimate the demand for projects of houses up to 200 sq. M. (one of the pages). It seems to be a good picture:

But if we turn to help with the service, it becomes clear that the figure of 750 impressions is the sum of all the impressions of the phrases containing in various forms “a house project of 200 sq m”. Those. and "projects of foam concrete blocks of 200 sq m" and "projects of houses with an attic of 200 sq m" and all that is shown in the picture.
To find out the exact number of requests for this phrase per month, the construction should be different:
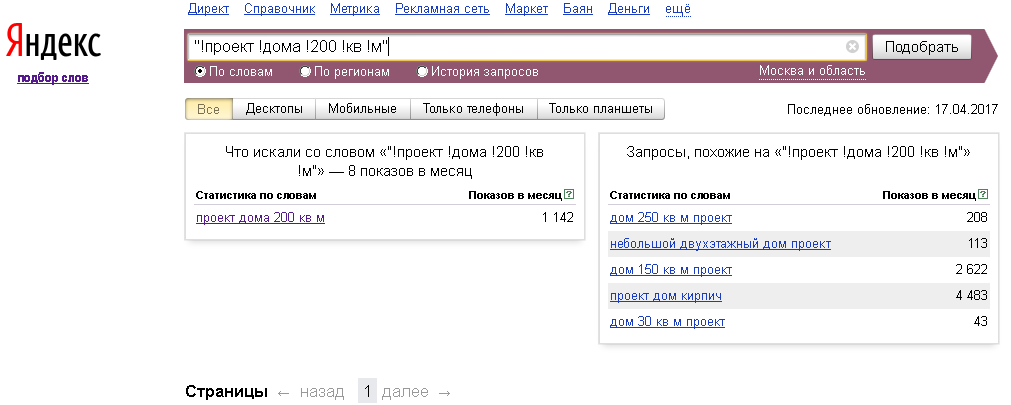
As we can see, the data is radically different - only 8 impressions for exact matching the phrase. At the same time, it is necessary to take into account that statistics are spoiled by SEO services that remove positions, and in many topics there is also seasonality.
Another point that should not be missed - you should see what the phrase under study is in the search results. It happens that there instead of the expected commercial issuance of links to articles and reference resources. Those. non-profit sites.
Top 10, damn it
There is a feeling that a good half of entrepreneurs got stuck in the early 2000s and still requires a position from Internet marketers, rather than achieving real and business-related goals. They do not even suspect that the very "top 10" is long gone.
The issuance of search engines now, depending on the formulation of queries, search history and other factors, forms the final picture in completely different ways.
It contains:
- advertising;
- map services;
- video;
- Pictures;
- links to social networks
- responsive and regular websites
Algorithms have become complex, and in many phrases the user receives individual search results.
For example, Crypt technology in Yandex: yandex.ru/company/technologies/crypta . At the request of Babylon, an amateur TV series will receive a link to a movie page, a student to a Wikipedia article, and a Moscow housewife to a shopping center website. Yes, the search engines have already collected all the information about you.
In addition, it is clear that in the above-mentioned variety of responses to a user's request, the concept of the first to tenth place for sites simply lost its meaning.

Using only one statistics collection system
I strongly recommend installing both Ya.Metriku and Google Analytics on your website. The point is not only that both systems complement each other with tools.
You can get data that varies greatly in one and in another statistics system. On some client sites, I saw a difference of 15-20%.
The question is who to trust? The main reason is that Metrics and Analytics operate on slightly different data and calculate the same indicators in different ways. And it happens that there is a direct error (for example, the counter is set incorrectly).
Installing two systems for collecting statistics at once and the big difference between the data will allow you to understand in time that data collection is distorted.
What are the main reasons for the difference in data:
- Many analysts are advised to set at the top of the page code, and the Metric - before the closing body. This leads to the fact that part of the data does not fall into the Metric, because The page has not yet loaded, and the user has already left. Analytics will count the visitor.
- Settings for time zones and time zones. And here and there they must be the same.
- Different filter settings to protect against robots and their visits.
- Accounting for statistics from multiple sites. For example, in the Metric settings there are mirrors, but not in the Analytics.
- Information about authorized users. In Yandex and Google it will be completely different sets of numbers.
What to do? First, deal with the settings and terminology (what is a failure for Yandex, and what is for Google) and learn not absolute data, but dynamics. A sharp rise or fall in metrics in both web analytics systems will signal that something is wrong with the site or advertising campaigns.
Examination of indicators separately, not in aggregate
 All the main indicators - the general dynamics of attendance, failures, depth of views, time, geography, target actions - can not be considered separately. And there are no "hospital averages." All individually.
For example, you have a one-page website. Naturally, for him the depth of views will in most cases be equal to 1.
On the other hand, the navigation on the site can be very confusing, with the result that the visitor will turn gray until he finds the necessary information, but everything will be fine with refusals and duration of visits.
Is it possible to answer unequivocally the question: if attendance has increased, is it good? Not. In one case, this will be the result of an effective advertising campaign, when, with an increase in the number of visits, you received additional orders. In the other, the gray traffic was “poured in” by an unscrupulous performer, when, along with an increase in the number of visitors, refusals, depth of views and performance of targeted actions dramatically changed.
Therefore, you need to consider the numbers in conjunction. And be sure to selectively study the visitor's behavior on the site with the help of a web-visor, a map of clicks and scrolling pages. Have user metrics improved with increased traffic? Has the number of orders and calls increased? How has the behavior of visitors on each of the sources? What changes should be made in the advertising campaigns and the site on the basis of the analysis?
Using Google Analytics and Yandex. Metrics as sole sources of marketing data
Classical marketing is based on strategies: direct marketing, advertising, personal sales, trade marketing and PR.
Web analytics systems shifted the focus from strategies to channels: direct traffic, organic, social networks, websites, contextual and display advertising.
This is due to the fact that both Metric and Analytics only track online. There is no data on radio or TV advertising in web analytics systems. All this is displayed in them as "direct visits".
Another big disadvantage is that we study only direct metrics. Only the source of the traffic, not its cause. What does it mean? And the fact that it is impossible to determine in Google Analytics or Yandex Metrics, which specifically influenced the result of marketing activity.
What to do? At least minimally learn classic marketing.
"Dark Traffic"
 This is the type of traffic where its origin remains unknown. Such sources do not transmit data about themselves and are recorded in statistics as Direct (direct visits).
Examples of sources of "dark traffic":
- transitions from HTTPS sites to sites without HTTPS
- from mobile apps (same facebook)
- from files - text documents, PDF files, presentations that contain links to sites
This is especially bad for companies that work with content marketing and a large number of distribution channels. Statistics do not reflect the real state of things and it is not clear which channels should be developed and which ones should not.
Therefore, if the number of direct hits on your website is more than 50% of the traffic (with noticeable traffic), I advise you to refer to this article .
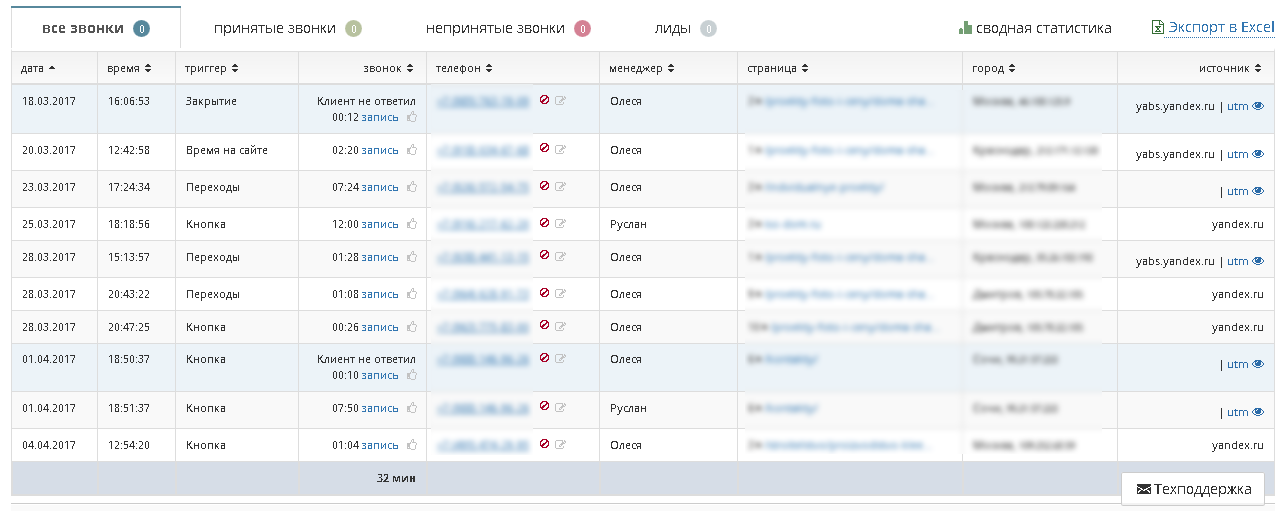
Mismatch of data by Ya.Metriki and Ya.Direkt
Ya.Direct counts clicks on ads (if they were not filtered as "clicking"). Ya.Metrika registers sessions (visits) for which all reports are based. The session is terminated after 30 minutes of inactivity of the user on the site. Each subsequent visit to the site is another visit.
A single visit can get a few clicks on the ad, or a click can not register at all by the Metric (for example, the page was closed before the counter was loaded). Therefore, the number of clicks recorded in Ya.Direct and the number of visits displayed in Ya.Metrika reports may differ.
There are a number of other reasons why the Metrics and Ya.Direct data may differ:
- incorrect installation of the counter code;
- blocking ads in the user's browser or proxy server of the company (in this case, the counter loading can also be blocked);
- "Technical" problems - the remoteness of the server serving the counter call, the workload of the ISP channel, the speed of the site itself.
This means that Ya.Metriki is not enough for studying contextual advertising statistics.
Seasonality and Deferred Demand
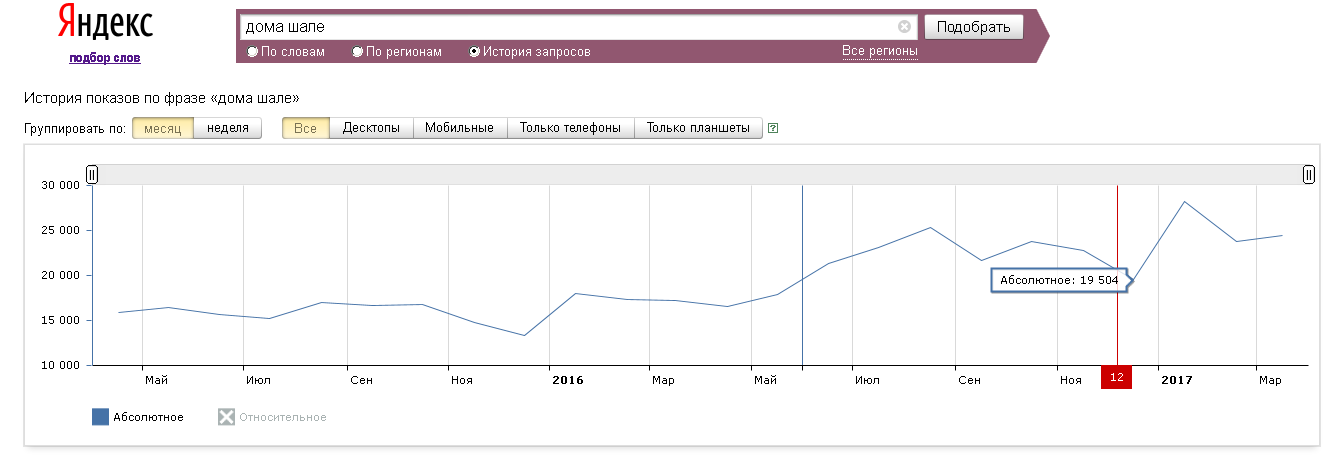
Some analysts study statistical data in isolation from reality, forgetting that business has seasonality and there is a pending demand.
For example, it may happen that the information on the offer is sought in March, and the purchase itself is made in June. At the same time, an entrepreneur will have a panic in June (“we have a season, but there are no calls!”), Although the decision to purchase by the customer was made in the spring at the peak of demand for information.
Therefore, it is worth exploring the global demand and data of the site itself for a longer period - at least six months, when there is enough material to analyze. And at least minimally “feel” the market and business processes within the client’s company.
Notorious conversion
Talk about increasing conversion does not lead today only lazy. The problem is that it only makes sense with really big numbers on the counters, because as a rule, we are talking about an increase of 0.5% -5%.
What is the use of spending time and money on increasing conversion for a site that has just a hundred orders per month? For example, the increase in conversion by 2% with the number of orders in 50 - this is only 1 order more. I understand that ordering an order is different, but in this case it is worth thinking about where it is better to invest time and money - in increasing conversion or in an increase in the absolute number of sales.
The smaller the absolute value, the more important the meaning.
At large (and not so) conferences they talk a lot about conversion, studying large amounts of data, in-depth analytics of advertising channels and traffic. Almost half of my clients are small businesses.
For them, in theory, every order, call and letter from the site are of great value. And to study only the numbers on the counters is the lot of large companies that do not have the opportunity to pay attention to each client. As the number of leads grows, the value of each of them decreases. That is why the bare numbers are studied, not the meaning.
For those who are on the verge of survival, it is much more important to study the content of each contact - listen to calls, read letters and communicate directly with the client. To understand why chose a competitor. The call took place, but the deal - no. People themselves say what the reason. But only a small part of entrepreneurs use this information. Admit how many of you do this? I hardly have to force customers to record at least the number of contacts (yes, almost half of my clients have neither CRM nor ip-telephony).
What else is worth remembering
There are no ideal sites, and the development of web pages, like other software, is an iterative process. They did, attracted the audience, moderated feedback and interaction, made changes.
Do not trust 100% of the services and programs you use for analytics. Check selectively the data yourself (manually) that they offer, and look for alternative measurement methods for comparison. Services are made by ordinary people who are prone to make mistakes.
Check data entered into sites and code blocks. For example, some engines cut styles and java-scripts, which can lead to the fact that the counter code of Ya.Metriki will not work, and you will lose time or get biased data.
Always look at the date of the research you are reading about, otherwise you will deceive yourself again and you will follow the stupid recommendations in the blogs of 2007, the creators of which have long retired.
If you are an analyst, always adjust the duplication of data from forms, call-tracking services and any kind of feedback to yourself. Otherwise, over time, it may happen that at some point the mail of the online store stopped working, the call balance is zero balance, and the phone with sms alerts about orders from the online store is blocked.
')
Source: https://habr.com/ru/post/327204/
All Articles