Ways to debug JS on client
In relation to the development of create-react-app (CRA) in the browser and in the IDE WebStorm. If you know of any other debugging methods, please share your knowledge.
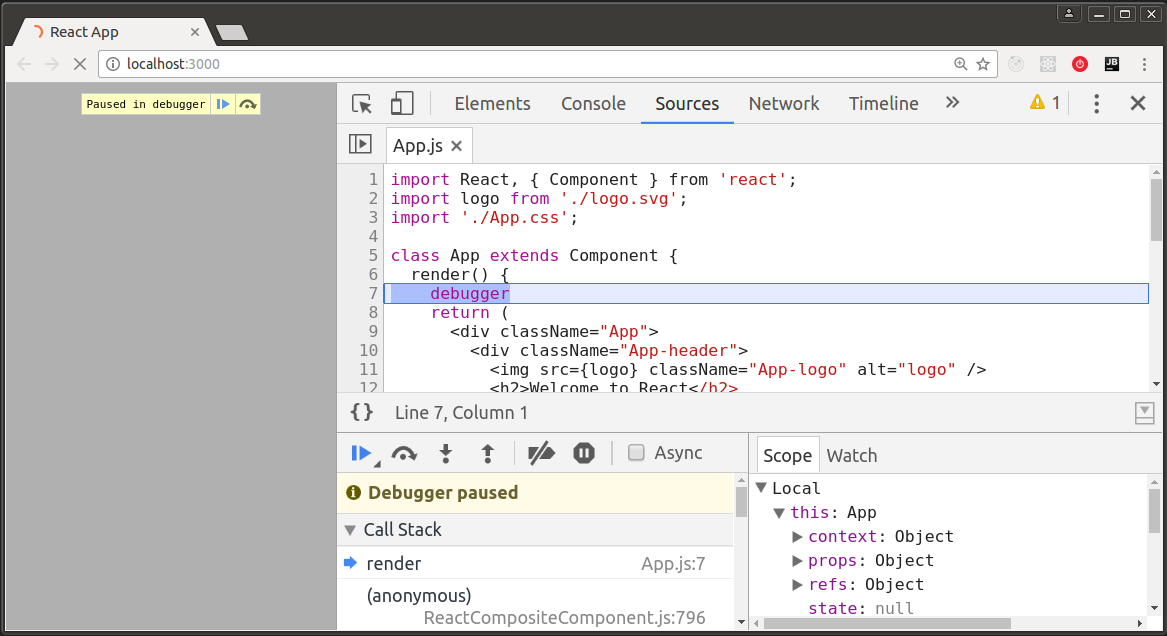
Debugging inside Chrome
After launching the application in the browser, press [F12] to open Chrome DevTools, then switch to the Sources tab, press [Ctrl + P], enter the name of the required file in the search bar.

Thanks to the Source Map, we see the original JSX. Then you can mark the desired line of code as a breakpoint, then reload the page by [F5], and get what you want - a debugging tool.

In order not to look for the file in the browser, you can insert the magic word debugger directly in the source code, the execution will be interrupted in the right place.
Sometimes you want to debug in the old fashioned way, using console.log (). You can get the value of a variable inside JSX right at the point of its application.
<img src={console.log('logo', logo) || logo} /> How it works: console.log () will return undefined and the code will be executed further by the condition "||", and in the browser console we will see the desired value, for example: "/static/media/logo.5d5d9eef.svg".
UPDATE (thanks, faiwer ) - still in the piggy bank:
(() => { debugger })() || // anything Debugging inside the IDE WebStorm
The latest version 2017.1 is used. First you need to set up the environment. Install the Chrome extension - JetBrains IDE Support. Then add the Run / Debug configuration.

Run CRA in the usual way by running in the terminal:
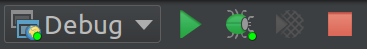
$ yarn start Select the Debug configuration and click the button with the bug icon (in the upper right corner of the IDE):
A browser opens with the warning "JetBrains IDE Support Debugs This Browser." (It is noted that if you now open Chrome DevTools by [F12], then debugging in WebStorm will end - no need to do this). Next, you can mark the necessary line of code as a breakpoint, then reload the browser page by [F5], and get what you want - a debugging tool inside WebStorm.

Debugging tests requires additional configuration, because this code does not run in the browser. Install globally packages:
$ npm install -g babel-cli babel-preset-es2015 Then add another Run / Debug configuration.
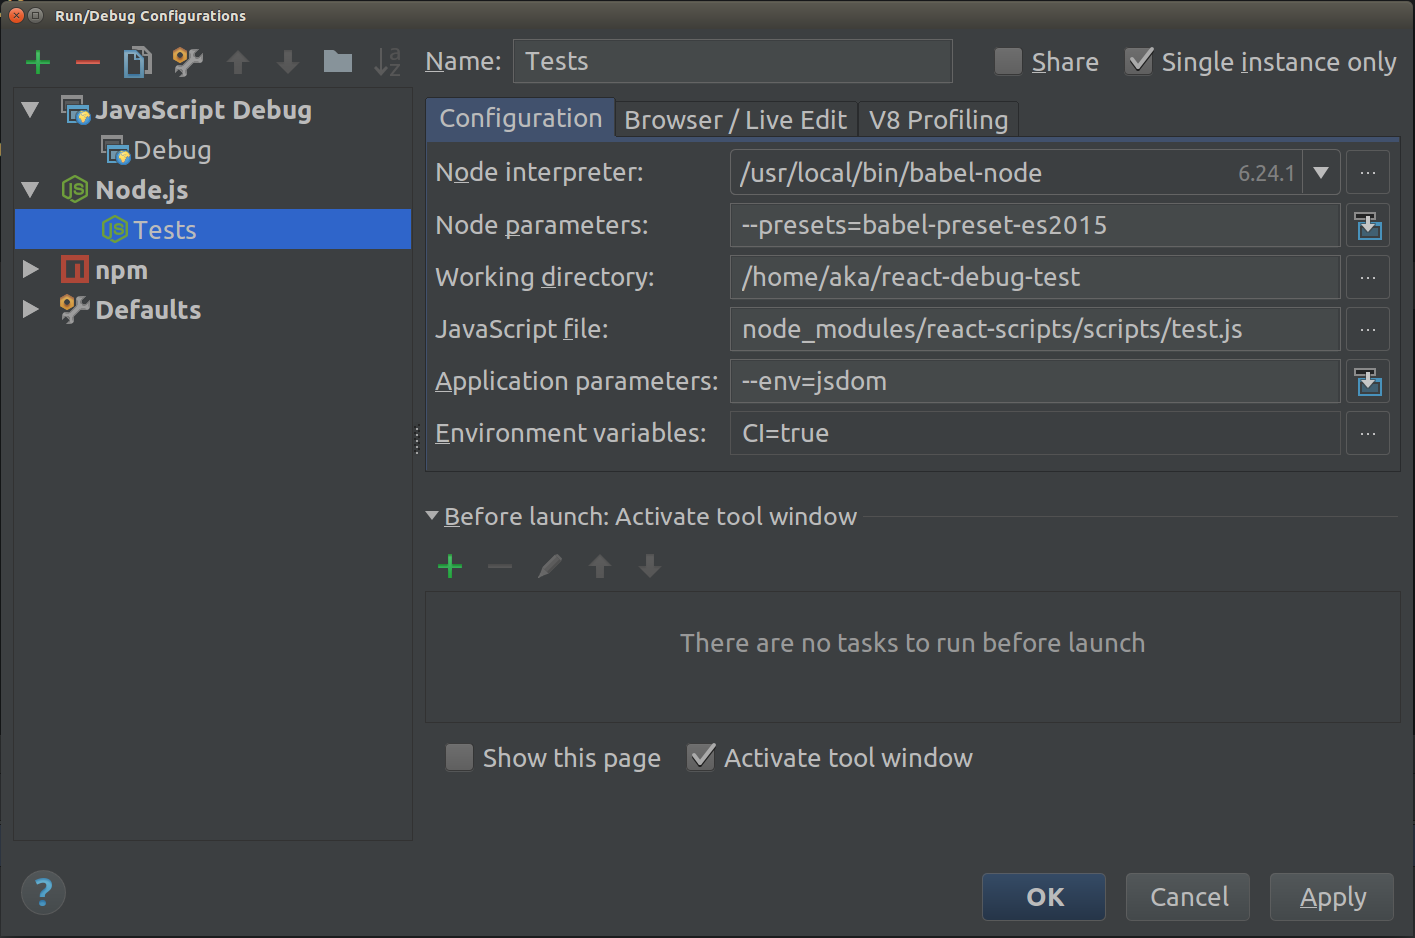
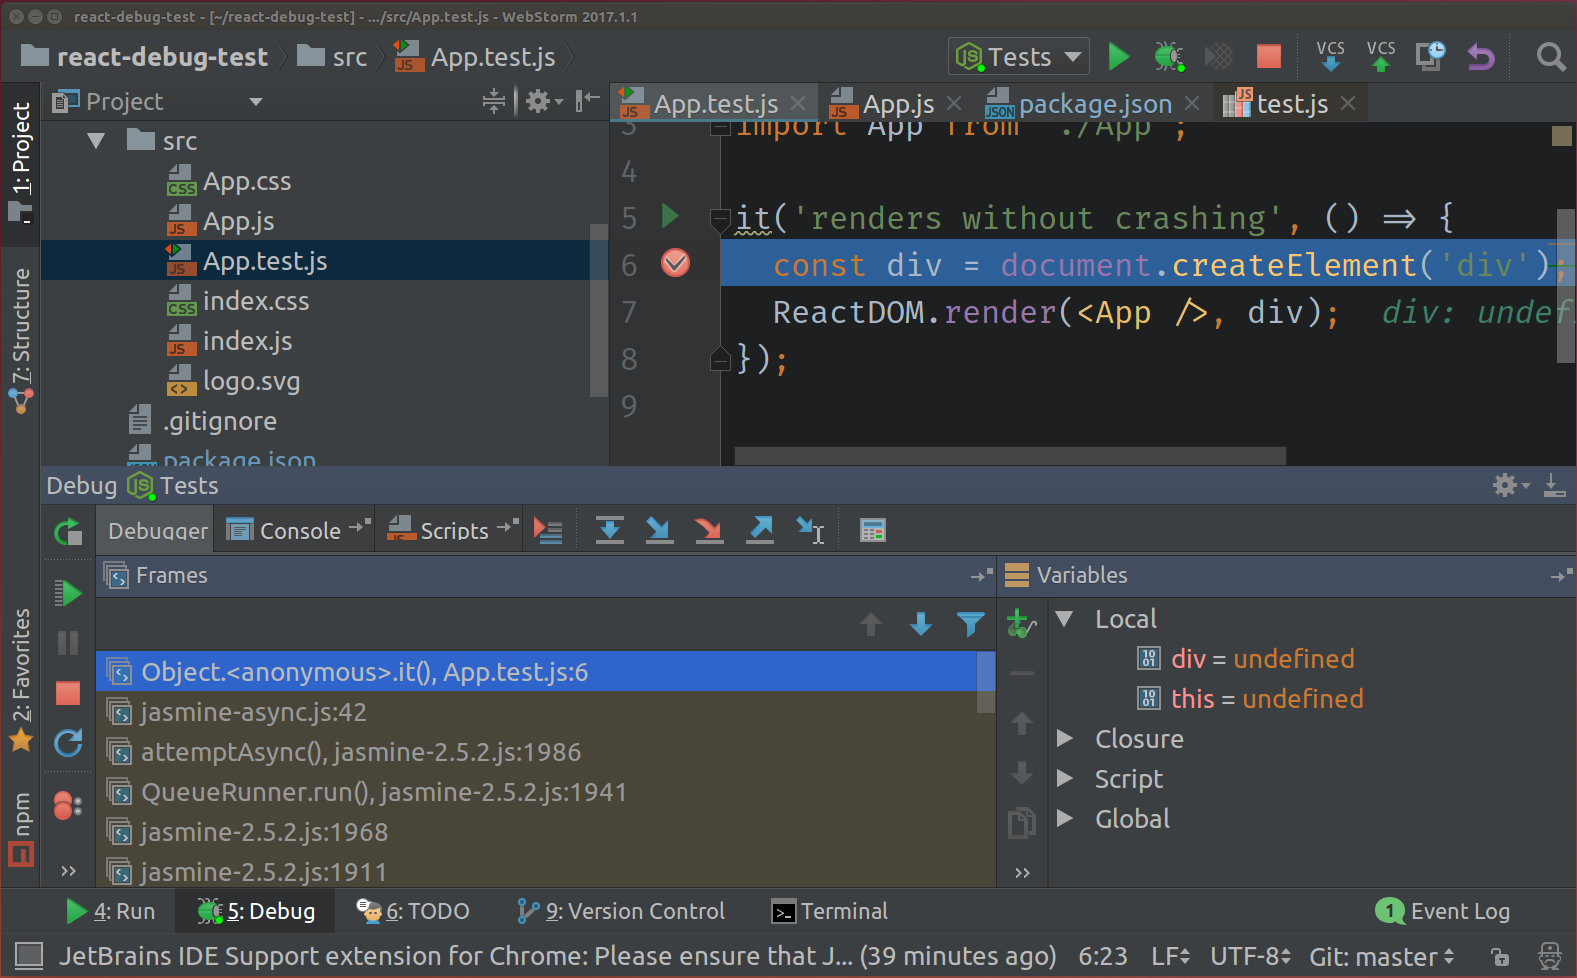
Select the Tests configuration and click the button with the bug icon:

Hurray, debugging tests are available to us.
UPDATE How to configure CRA debugging inside VSCode . I did not think that someday I would say this, but this product from Microsoft is beautiful.
')
Source: https://habr.com/ru/post/327190/
All Articles