How we built the cloud processing infrastructure for cross-product analytics

We at Skyeng pay a lot of attention to data analysis. It allows us to properly plan work and allocate resources between different tasks. Today, analyst developer Gleb Sologub will tell you how he collected for us an infrastructure for collecting and analyzing data throughout our zoo of services and applications, having done so in the annual budget of 12 thousand dollars.
Skyeng has its own ecosystem, including a web platform where school students take interactive lessons with teachers, do homework and take tests, as well as several mobile applications for iOS and Android and browser extensions that help train various English language skills.
“We are fast and flexible,” one of the founders of the company Khariton Matveyev likes to repeat, so all these products have independent development teams that use their favorite technology stacks, which means they produce separate sets of databases. Each of these teams has its own manager, he is the product, who again himself chooses the tools for product analytics , be it Google Analytics, Amplitude or something completely exotic.
This approach works great, as long as each measures only its own KPI. When there are questions from the series: “How much faster and better learn English, who, apart from lessons with a teacher, independently learn words in an application?”, There is a need for cross-product analytics, which requires a special infrastructure for collecting and co-processing data from various sources.
Skyeng hired me to quickly build such an infrastructure on ready-to-use paid services within a budget of $ 12K for the next year, then to replace them with their developments as it becomes economically justified.
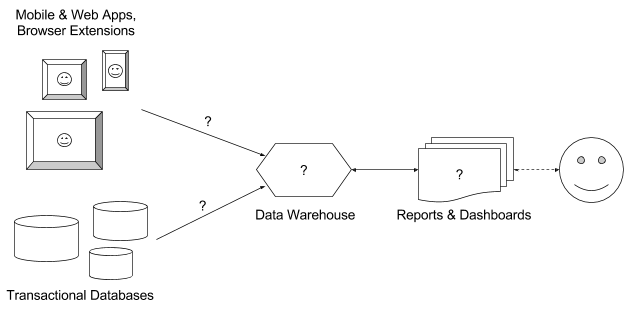
I needed to build an infrastructure for collecting arbitrary events from all products, combining them with necessary data from various databases in a single repository, analyzing and visualizing this data in the form of reports and deshbords; that is, solve 4 questions in the picture above. How did I solve this puzzle?
What to choose data storage?
The central question is where, in fact, to put the data. The main criteria in the case of Skyeng were three:
- speed of execution of analytical queries;
- solution cost;
- complexity of integration with analytics systems and data collection services.
The speed requirements did not allow the use of traditional string relational databases, and the possible integration complexity forced us to abandon all types of Hadoop as a Service and such uncommon variants like ClickHouse and Azure SQL Data Warehouse.
Large companies for such tasks recruit a team of data-engineers and collect a pack of Hadoop clusters or allocate a budget for loading data into Vertica to collect their data storage there , but the bar for the money immediately cut off such options.
Smaller companies use Redshift or BigQuery for such tasks; by and large, between them and had to choose. In my opinion, it makes no sense to compare these services in terms of speed - they are both fairly fast, except for different borderline cases. Both have a developed ecosystem and integration with a variety of services.
As for the price, at first glance it may seem that BigQuery is much cheaper. In the minimal configuration, 1 Redshift cluster gives 160GB of space and costs exactly $ 180 per month, and BigQuery has a flexible price tag - only $ 0.02 per 1GB per month. However, the cost of Redshift does not depend on the number and load of analytical queries, while in BigQuery, requests are charged separately for $ 5 per 1TB of processed data - it would seem to be inexpensive.
But let's look at how data size is calculated in BigQuery , and remember that this is a column base, and that to get even one field from one line, you need to pull out the entire column. Let's take some simplest question: for example, we need to calculate by dates the number of users who opened a specific page of the Vimbox platform, it would be such a typical query to BigQuery:
select date(timestamp) as period, count(distinct user_id) as user_count from [vimbox.pages] where path = '/showcase' group by period; Here we get data from two columns: user_id of type integer and path of type string. If the label contains, say, 100 million lines, then the cost of such a request will be a few cents. If you have, for example, 100 reports with similar requests, each of which is recalculated 2 times a day, then your monthly bill will be measured in hundreds of dollars.
You can, of course, use different tricks to minimize the number of processed data. For example, you can put everything in a partitioned table and retrieve in all reports only data for a short period. But then it turns out that instead of inspiring, BigQuery discourages you from using this big and even not very big data of yours. Instead of trying to do all sorts of requests in search of insights, you all think how to limit them - this is a sad story.
In general, I stopped at Redshift, keeping in mind that if there is some more optimal configuration with BigQuery, then you can use it.
How to choose an event collection service?
Let me remind you that the basic elements of product analytics are events. Showing a page on a website or screen in an application, pressing a button, successful authorization, a system error, the purchase of a product are all different events.
In traditional web analytics, it is customary to set counters to track events that show all pages on a site. Services such as Mixpanel and Heap are able to automatically track all clicks as well (GA has a special autotrack plugin for this). This approach is called retroactive analytics, because all events are collected in advance, just in case, and are used in reports only as needed. Heap and Segment can automatically track screen switching of mobile applications, but this is of little use, because screens, unlike web pages, usually get not very meaningful names like Table7, SEStart or UIAlertController.
Naturally, all these services also have an API for sending arbitrarily specified events. And the product approach to analytics lies precisely in the fact that there is no sense in collecting all the events in a row , and first of all you need to learn to consciously track a small number of key actions , which include, for example, the first steps of newcomers in the process of onboarding, registration, activation and basic actions of regular users.
Me and my colleagues at Skyeng like this approach, but when you have 10 different products, write a specification for sending events for each development team and come up with a way to verify that all events are sent correctly becomes a real headache. Therefore, I really wanted to choose one service that can collect events from all platforms (Web, iOS, Android) and via HTTP (for browser extensions and server) and does this, if not automatically, then at least in some uniform way.
In addition, we needed a service that can not only collect events, but also store them in the data warehouse. The possibility of raw event export in one form or another is in all services. Even in the free version of GA, there seems to be a tricky way to upload single events through the usual Reporting API . But regularly and smoothly get the raw logs, process them, remove the necessary fields and put them in a structured form into the repository - the task itself is not easy, I also wanted to push it to the server and shoulders of third-party developers.
I tried and compared several cross-platform services for compliance with our requirements, I got this sign:
| Web | iOS | Android | HTTP | Retroactive event collection | Service to upload data to the repository | Cost per year | |
|---|---|---|---|---|---|---|---|
| Mixpanel | + | + | + | + | with restrictions | - | ~ $ 50K |
| Amplitude | + | + | + | + | - | + | ~ $ 50K |
| Heap | + | + | - | + | + | + | $ 31K |
| Localytics | + | + | + | + | - | + | $ 15.5K |
| Facebook Analytics | + | + | + | - | - | - | is free |
| devtodev | + | + | + | + | - | - | $ 0.9K |
| Amazon Mobile Analytics | + | + | + | + | - | with restrictions | ~ $ 0.1K |
| Segment | + | + | + | + | with restrictions | + | $ 3.6K |
| mParticle | + | + | + | + | - | + | $ 36K |
The cost for the year in this tablet is calculated on the condition of monthly tracking of 30 thousand active users, 600 thousand sessions and 100 million events, as well as the services of uploading data to the repository, if any. These numbers are consistent with the annual plan for the growth of Skyeng.
The specificity of the school is that the core of active users is not yet very large (about 12 thousand students in February 2017), but it grows 3 times a year from a year, and in each of the school’s products they spend several hours a week, Now daily committing millions of various actions. Therefore, unlike other sites and applications, where there are much more users, and LTV is much less, it is more advantageous for us to use services with a payment model that depends on the number of users.
The first 7 services from the table are full-fledged analytical platforms with various visualization tools, report building, marketing communication, etc., and the last 2 specialize in gathering events from various sources, enriching them with data from various CRM and marketing services and sending them to data store.
Of all 7 options, only 4 fit into the budget, and of these, only Segment and Amazon Mobile Analytics provided the ability to automatically upload events to the data warehouse. However, the Amazon solution has a rather ridiculous limitation - each time a new property is added to an event, an automatic export scheme must be re-created, which leads to the loss of all already exported data in Redshift . Normally, only automatic uploading of events to S3 works, but in order to stuff them into Redshift from there, again, you need to program the data pipeline yourself, and this is a separate job with a separate salary.
As a result, I chose Segment. He has an SDK and API for collecting events for all the platforms we need, and he can automatically upload all data to BigQuery and Redshift. Retroactively, it can only collect some events in mobile applications , but it has a well thought-out system for recording events in the repository and a well- developed approach to collecting events , and also has a debugger in which it is convenient to watch incoming events in real time.
Particularly successful in the case of Skyeng is that Segment takes money not for the number of collected events, but for the number of unique users per month.
How to choose a data download service from databases?
In addition to collecting events directly from the products, we also need to upload data from their bases, while Skyeng has a whole zoo - different instances of different versions of MySQL and PostgreSQL, both on cloud and on their own servers. There are solutions that do both: for example, Treasure Data and Alooma ; However, their cost is extremely opaque and definitely does not fit into the allocated budget ($ 30K per year for Alooma or $ 60K for Treasure Data per year, provided 100 million events from applications and 100 million lines from databases are sent monthly).
Once again, I’ll clarify that the options to write your ETL solution, even on the basis of existing frameworks like Luigi or Airflow , and programming the pipelines were dropped immediately, as they require at least one more pair of programmer’s hands and a corresponding increase in the payroll.
From automatic services, I knew only FlyData , Fivetran , Xplenty and Stitch , and I chose just the cheapest of them - Stitch gives a free trial for a month, during which you can download all historical data and set up an incremental replication of new data (up to 100 million rows per month for $ 500).
Unlike Xplenty, which is essentially a full-fledged ETL service with support for various data transformations, Stitch has a rather primitive interface and allows you to simply tick which tables and fields (or all) of which you want to replicate, with what frequency and in a way.
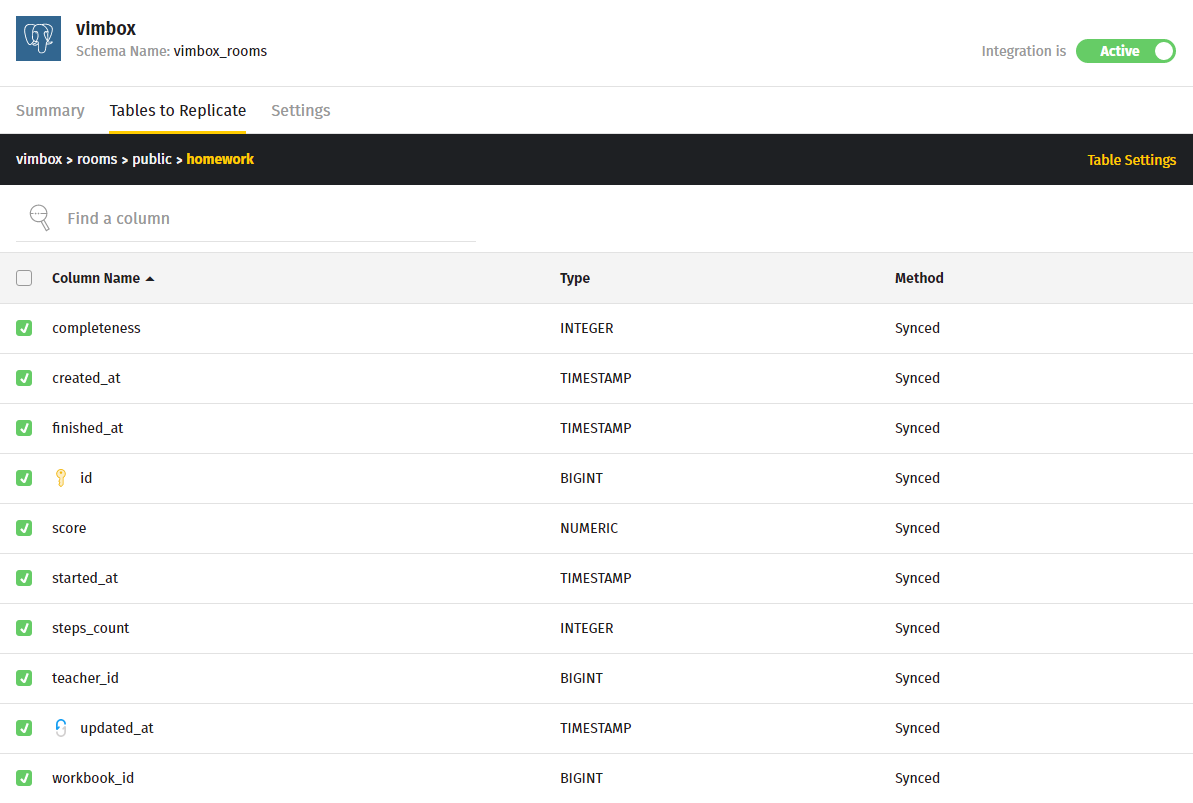
Stitch supports full rewriting and incremental replication on a key, which can be, for example, a primary key if the rows in the source table are only added but not changed, or, for example, updated_at, if this field stores the date of the last change to the row. If it is necessary to transform data before being transferred to the storage, you need to create a view with the necessary data directly in the source database and replicate this view in the same way .
I must say that such a simple solution is sufficient in most cases.
Stitch supports various storages, it performs data type conversions depending on the storage (for example, json and enum translates to varchar in the case of Redshift), and also monitors the structure of the source database and changes in the tables — new columns are picked up automatically. They also have an intelligent support service that has helped me solve many different questions many times right in the chat window.
In terms of money, this is still the first candidate for a replacement in the chosen architecture, because with an increase in the number of replicated tables, it will very quickly become advantageous to simply start a separate ETL developer.
What choose analytics system?
After all the data got into the repository, the question arises how to analyze and visualize them. Planck for the money again played a decisive role - I had to immediately discard the excellent and very expensive tools for visual BI analytics like Looker and Chartio , and also too expensive SQL-only solutions like Periscope Data .
The choice was between Mode , Redash and Plotly . All of these services allow you to connect to various data sources, make SQL queries to them and visualize them in various ways, build reports and deshbords and give them access to other users.
Mode also allows you to do post-processing of data using python-libraries, connect various libraries for custom visualization, make reports with parameters, and also stores the history of query changes in its repository. At a higher subscription level, the function of saving select queries as definitions is available.
Redash allows you to make reports with two types of parameters: just filters that affect the display of the query results already received, and parameters that will be inserted into the query itself.
In Redash, you can reuse already written pieces of SQL-code, saving them as snippets. Unlike other options, Redash has a great feature for auto-querying requests on a schedule, and another alert mechanism in Slack or in the mail, the trigger for which is the change of the specified value in the query results. At higher subscription levels in both Redash and Mode, it is possible to administer access to reports for user groups.
Plotly was originally just an open source JavaScript library for visualization, and now it has the most sophisticated data visualization tools and APIs for several other languages, including Python, R, and Julia. The function of creating dashboards appeared in it relatively recently. Unlike Redash and Mode, Plotly has a simpler access control system - you can only share a schedule or a dashboard by reference or in public access.
For money, the balance is: Plotly cost depends on the number of analysts, $ 0.4K per person per year, viewing ready-made reports does not require a subscription. The cheapest plan for Mode includes 10 accounts and 5 thousand SQL queries and costs $ 3K per year. The minimum cost of Redash without restriction on the number of users viewing reports is $ 1.2K per year, and with delimitation of access rights at the report level, $ 5.4K per year, but at the same time you can raise it for free on your server.
This feature of Redash attracted the most, since the task was intended to gradually replace the most costly services with its own developments. Given the fact that I already had a great experience with him, I chose him.
Result

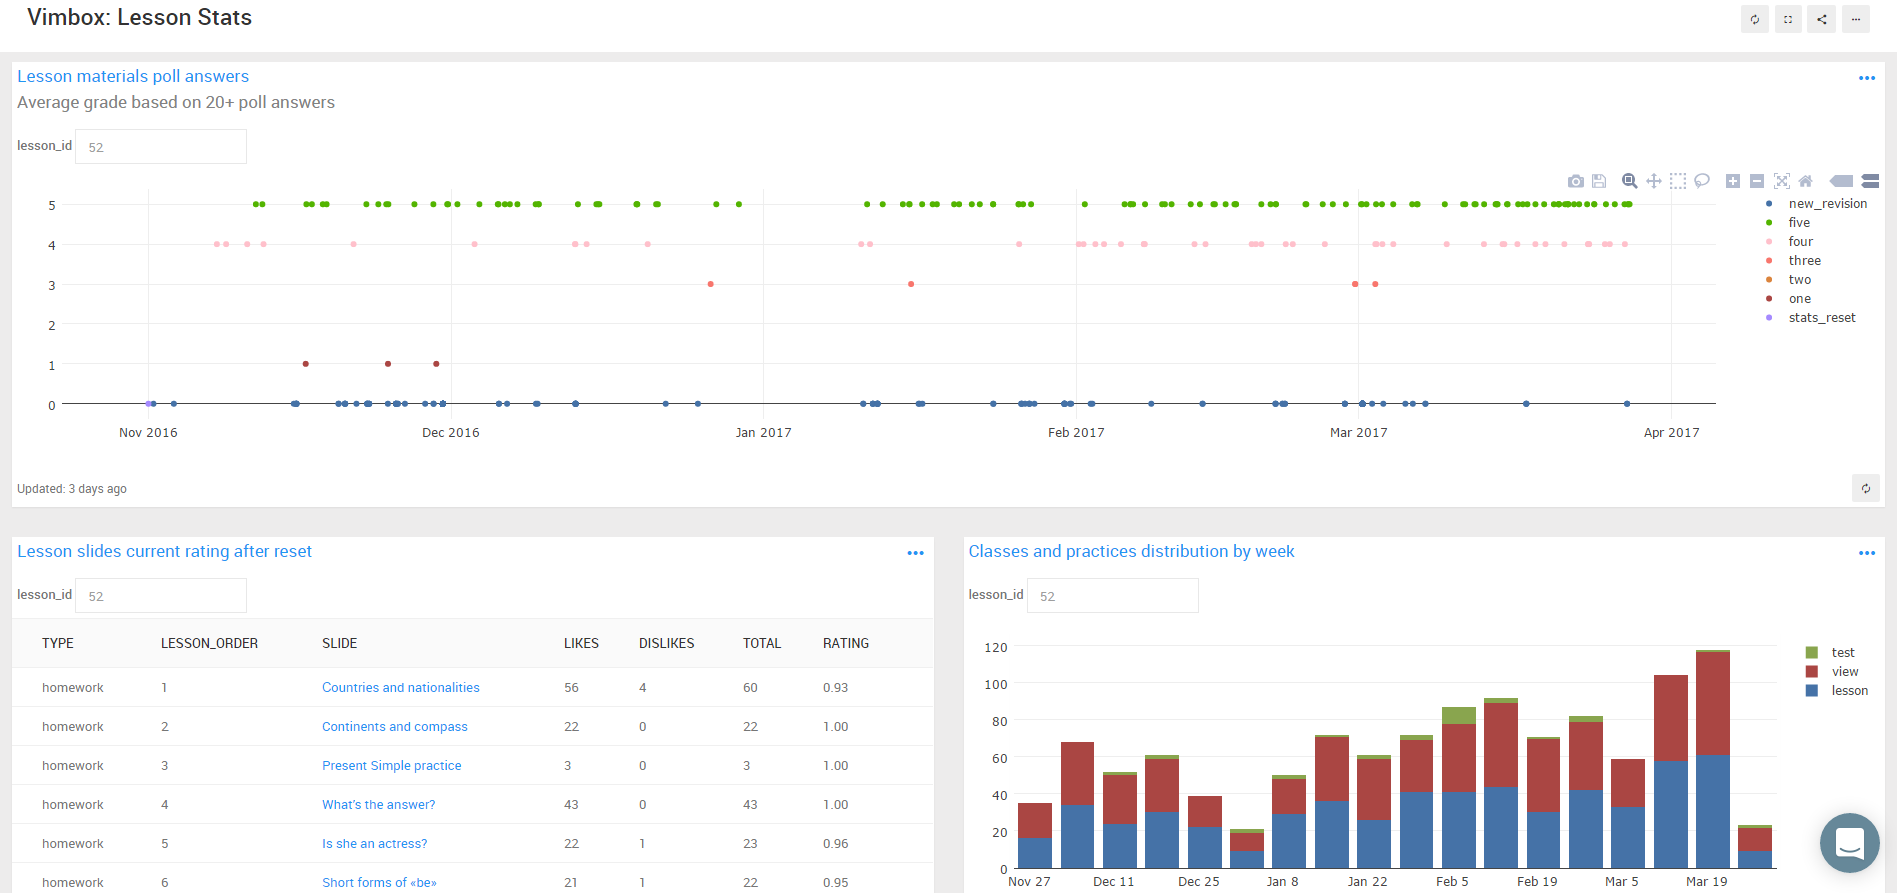
For 4 months I managed to collect all this infrastructure, plug in data from all products and their bases and build about 90 reports and deshbords on various KPIs and metrics, spending only about $ 2K (taking into account the 3 months free trial of Redshift, progressive monthly rate the payment of Stitch and Segment, and the fact that we are still placed in a not very expensive Redash plan).
In particular, it was possible for each product to calculate the proportion of active students at the school who use it:

It may seem like a simple task, but in fact it was necessary to collect together the data from these products (for example, training events from the Words application) and the data on classes from the school base.
The built infrastructure easily scales horizontally as the amount of processed data increases, and the used service stack can be modified and supplemented from different sides by other elements like Amazon Machine Learning as a machine learning service or various CRM and marketing platforms as separate data sources.
All companies that have long wanted to build their cloud analytics infrastructure, but are afraid to fly into a pretty penny, I advise you to stop being afraid and start doing it, now it has become much easier and cheaper than it was a couple of years ago.
PS Right on the eve of this publication, I discovered another low-cost service, Holistics , which can be used to create reports and replicate data from the database, but I have not yet had time to test it.
PPS It would be cool to add a vacancy from Gleb here, but he has already successfully closed it. Therefore, just to remind: we have a lot of interesting work for interesting people. Join now!
')
Source: https://habr.com/ru/post/327088/
All Articles