Investigation of the position of the eyes in more than 1,000,000 persons: the rule of the golden section or the rule of thirds?
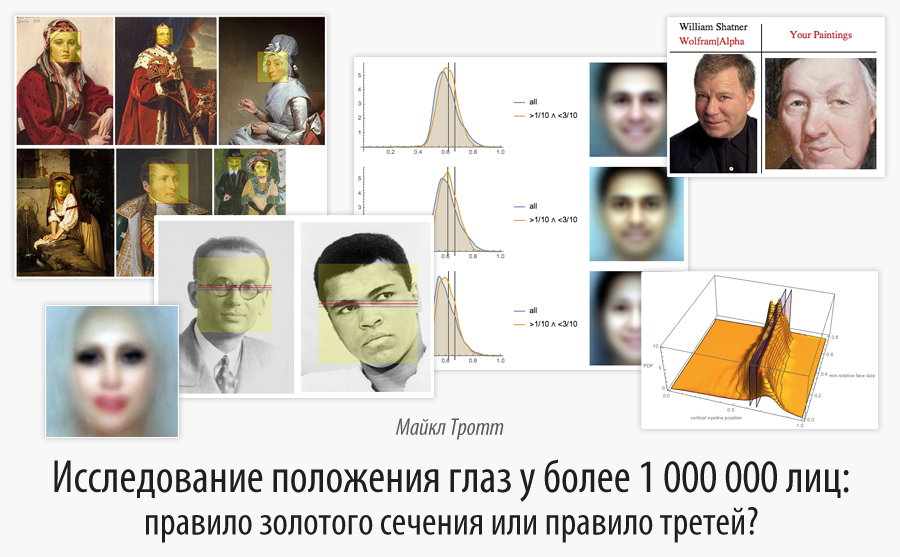
Translation of Michael Trott's post " Profiling the Eyes: ϕaithful or ROTen? Or Both? ".
The code given in the article can be downloaded here .
I express my deep gratitude to Polina Sologub for assistance in translating and preparing the publication.
Content
- The study of the manifestation of the golden section in the position of human faces in paintings and photographs
- The eye line level in old paintings is more ROT than φaithful
- The height of the eye line in modern paintings
- The height of the eye line in the work of professional photographers
- Eye line height in selfie
- Photos from LinkedIn profiles
- Persons on the covers of the weekly magazines of the last three decades
- Comic covers
- Daily newspapers and fashion magazines
- Celebrities from the film industry
- Cinema: eye line in motion
- Conclusions
')
The study of the manifestation of the golden section in the position of human faces in paintings and photographs
There is a huge amount of literature devoted to the golden section in nature, in physiology and psychology, as well as in works of art (see this article on the golden section , and these are: about the golden section in art , in nature and in the human body , and more about the structure of the creative process in science and art ). In recent years, skepticism about the prevalence of the golden proportion in these areas is growing. Earlier studies have been revised. See, for example, studies of the Greek temples of Fotakis , Markovsky , Foster , Holland and Benjafild , and Svobodovaya and others - on human physiology.
In my post " Proportions in art. Is there something better than the golden section? Research over 1,000,000 old and modern paintings " ( translated into Habré ) I analyzed the proportions of over a million old and new paintings. On the wave of psychological experiments of the second half of the nineteenth century (for example, Fechner, 1870s), it would be logical to expect the appearance of many paintings with a ratio of height to width equal to the golden ratio. However, the analysis of a large number of paintings did not confirm this hypothesis.
Although we did not find the prevalence of the golden section in the external dimensions of the paintings, perhaps a more detailed search will make it possible to detect signs of the golden section.
Today we will analyze the collection of paintings, photographs and covers of magazines, which depict human faces. We will also analyze faces in several selected films.
Literature on the history of art and aesthetics of photography traditionally offers division of the canvas into thirds horizontally and vertically. When depicting human faces, two rules are often mentioned:
- rule of thirds : the eye line should pass at the level of 2/3 (≈0.67) from the bottom of the image (paintings, photos, etc.).
- the rule of the golden section : the eye line should pass at the level of 1 / (golden section) (≈0.62) from the bottom of the image.
The third rule is abbreviated ROT (rule of thirds). In 1998, Frascari and Girardini (in the spirit of Adolf Zeising - the father of the so-called golden numbering) introduced the term " φaithful " (the Greek symbol ϕ is used to denote the golden section) to denote unlimited faith in the primacy of the golden section. Some consider the third rule to be an approximation of the golden section rule. There are numerous discussions about the relationship between these two rules . To read about using the rule of the third until the 18th century, see Nafisi ). See also the current history of using this rule . The rule of the third in painting and photography - see Amirshahi et al.
Since we cannot determine which rule is more common, let's look at some data.
The eye line level in old paintings is more ROT than φaithful
Let's start with the pictures. As in my previous study, we will use several different data sources. We are interested in four collections of paintings: from Wikimedia, the Smithsonian Museum, the British Your Paintings and Saatchi.
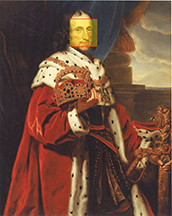
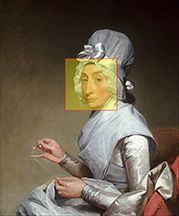
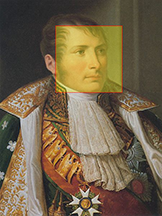
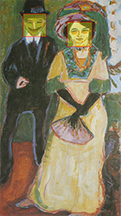
If we want to analyze the location of persons in the pictures, you must first determine their location. For this we need the FindFaces function. Although it is usually used for photographs, it is well established for paintings. Here are some randomly selected photos from Wikimedia. To get started, images are imported and faces are highlighted with a yellow translucent rectangle. We see a different amount of horizontal space around the face, while the vertical expansion is quite uniform from the chin to the hairline.


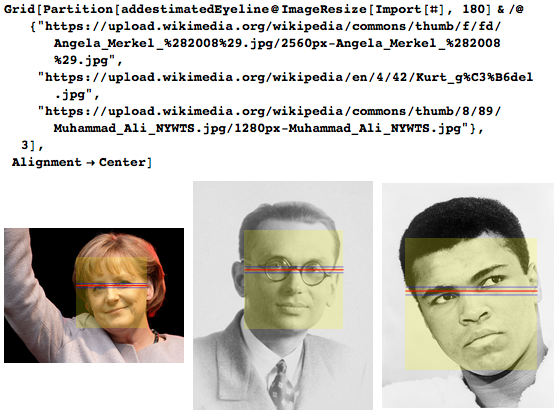
A more detailed examination shows that the eye line is approximately at 60% of the height of the face (note that this is approximately 1 / ϕ ). To demonstrate the correctness of the 60% rule for several randomly selected images from Wikipedia, we showed the final eye line in red and held two lines 5% higher and lower.

Regardless of gender and hairstyle, 60% is a good approximation for the eye line. Of course, not all of the faces in the photos are arranged exactly. If the head is tilted, the eyes will not be on the horizontal line. But, in general, the 60% rule works well.
In general, we see that the eye line is located approximately at the same level within a few percent of the vertical height of the face of the rectangle. The error of the obtained estimate of the height of the eye line in most cases is about ≤2%. This is not enough to distinguish the golden proportion from the rule of thirds (in the interval [0.1] the distance between 1 / ϕ and 2/3 is about 5%).
Let's start with images of paintings from Wikimedia .
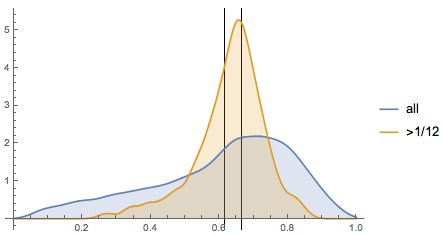
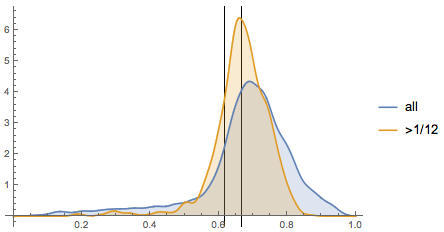
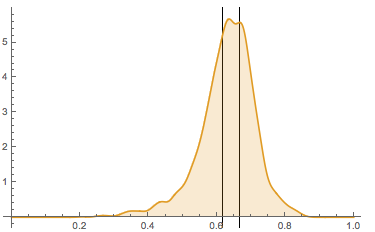
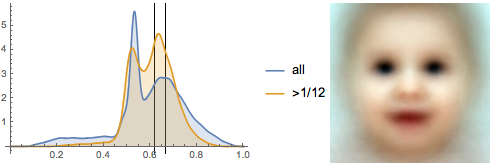
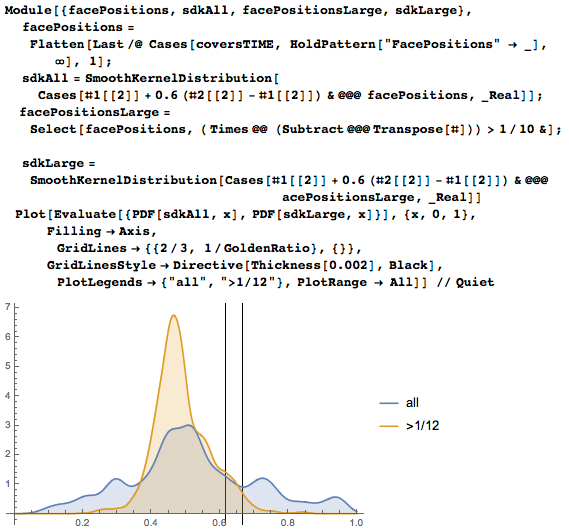
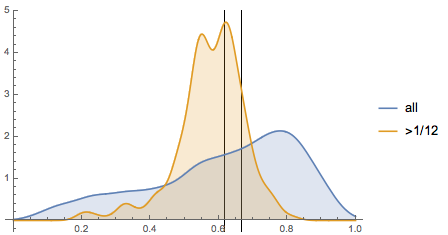
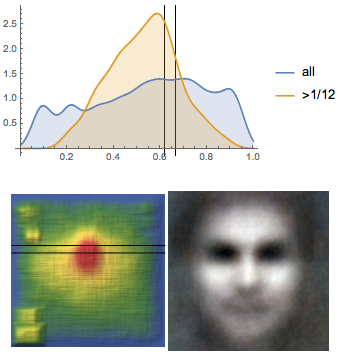
Using a coefficient of 0.6 for the height of the eye line, we obtain the following distribution of identified individuals. On 8,000 images, about 12,000 faces were found. The blue curve shows statistics for all individuals, and the orange curve refers to the individuals who, together with the rectangles surrounding them, occupy more than 1/12 of the total area of the picture (we will call these faces large). We see a clear maximum at the level of 2/3, which corresponds to the rule of thirds (the two black vertical lines are the height of the eye line for the rule of third and the golden ratio).
Since the images we analyze may be cropped, errors may appear in our data. The analysis in the previous recording showed that these effects are averaged, so errors appear in less than 1% of cases for 10,000 pictures.
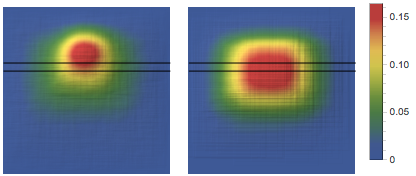
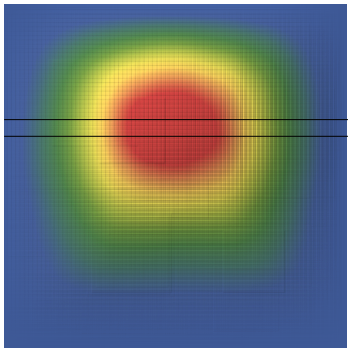
Here are two "heat maps": one for all persons, and the other - only for large ones. Now we place rectangles with faces on each other, and the color will indicate the proportion of all faces in a given position. It is seen that human faces appear in the left and right halves of the image with the same frequency. To enable comparison of the location of faces in paintings with different aspect ratios, the width and height of all the paintings were recalculated so that they fit into the square. The center of each face falls perfectly within the range [2/3, 1 / ϕ] (the Wolfram Language code for creating the graph and the heat map are given below).
Below is a short animation showing how a peak is formed on the distribution of faces when more and more pictures overlap each other.
Repeat image analysis from Wikimedia based on a sample of 4000 portraits from the collection <a href = " npg.si.edu/portraits/search?edan_fq [1] =! Set_name% 3A" Catalog + of + American + Portraits "& edan_q = portrait & edan_local = 1 & edan_fq [] = online_visual_material% 3Atrue & op = Search "target =" _ blank "> The Smithsonian Museum gives a similar result. This time the curve shows a more clearly localized peak, because we have chosen portraits from the very beginning.
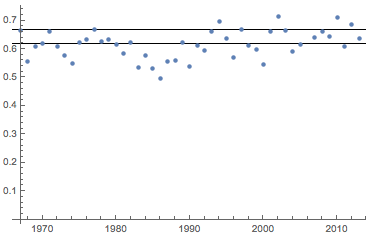
The British site Your Paintings has a much larger collection of paintings. On 58,000 paintings, we found a total of 76,000 faces.
The mean value and standard deviation for all heights of the eye line is 0.64 ± 0.19, and the median is 0.69.
Our results show that larger faces are on average lower. Even with very small relative face sizes, the eye line is between 1 / ϕ and 2/3.

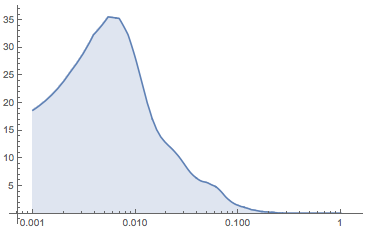
The last image also requires the creation of a graph of the relative size of the faces in the picture. The average area of the rectangle denoting the face zone is 3.9% of the total area of the picture (standard deviation is 5.5%).
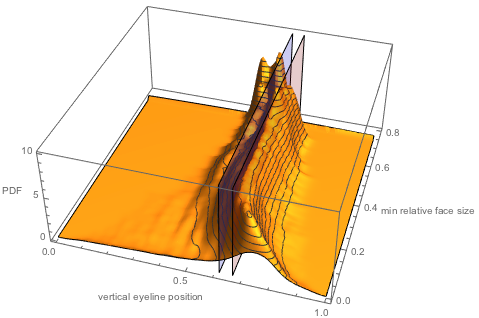
Here is the corresponding cumulative distribution of all options for the location of the eye line for individuals larger than a given relative size. Two planes in the yz plane are 1 / ϕ and 2/3.
How does the aspect of interest change over time? For example, here is the distribution of the heights of the eye line for all the paintings of the nineteenth and twentieth centuries from our data set (there is also an opinion that the rule of the third was already observed in the stone age drawings ).

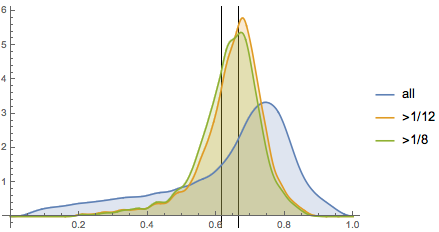
We have repeated the analysis with the paintings, which depict only one person. Now we see a wider maximum, which covers a range from 1 / ϕ to 2/3.
If you look at the segmented, rather than smoothed, data in the global maximum area, we see two well-defined maximums: one corresponding to the third rule, and the other corresponding to the golden section.

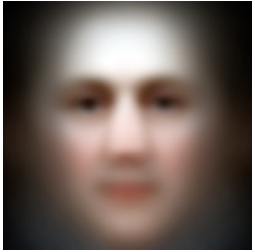
Now that we have done all the work related to the search for individuals, we can, for example, combine them. As a result, we get an averaged face obtained from 11,000 faces depicted in British paintings of the nineteenth century. Combined images of tens of thousands of faces also give us some confidence in the reliability and quality of the face extraction process.
Who are the famous people living people like people from the paintings of the 19th century? Using the Classify [ "NotablePerson", ...] function will allow us to find some unexpected similarities. The findSimilarNotablePerson function uses the shortened URL of the page from Your Paintings site as an argument, and then imports the picture, extracts the face, and finally finds the most similar known person from the embedded database.

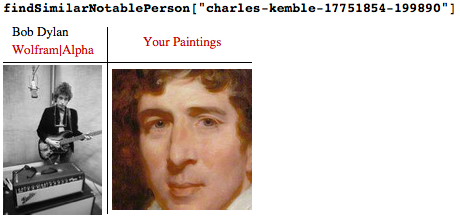


Here a few more similar pairs are shown (see the attached document for viewing different pairs of images).

Eye line height in contemporary paintings
Now let's look at some more modern paintings. We found more than 15,000 modern portraits in Saatchi . Persons in modern portraits often look rather abstract, but with the help of the FindFaces function, you can still find a number of them. Here are some examples.


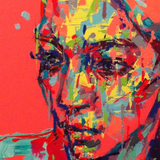


And here is a collage of 144 randomly selected faces from modern paintings. Human faces can be recognized at a distance, but due to stylistic differences, deviations become less noticeable.

If we reconnect all faces again, we will get a completely normal human face. This generalized face has more feminine features (for example, a smoother chin line and full lips) compared to nineteenth century paintings. If you look at the collage above, it is surprising that the generalized face looks quite normal.

If we add not only all the color values, but also random positive and negative weights, we get much more modern-looking average faces.

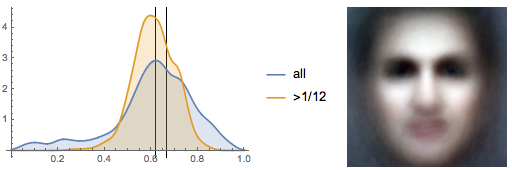
Now let us touch on the main question of this article: how are the faces located on these modern portraits? It turns out that they follow the rule of the golden proportion, and not the rule of thirds. 30% more pictures have an eye line at the level of 1 / φ ± 1% compared to 2/3 ± 1%.

The mean value and standard deviation for all heights of the eye line is 0.60 ± 0.16, and the median is 0.62.
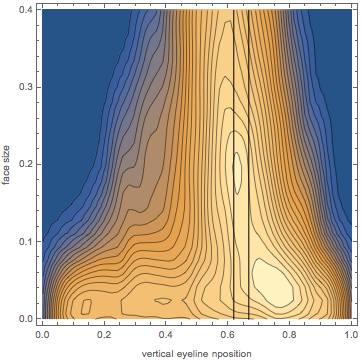
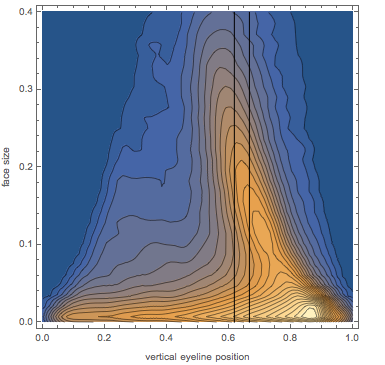
And if we build a graph of the height of the eye line depending on the size of the face, we will see a spot, meaning the location of the eye line at a height of 2/3 with a corresponding face area of 20% of the total area of the picture.
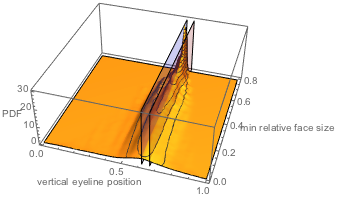
And here is the corresponding 3D graphics, which quite clearly demonstrates the height of the eye line at the 1 / ϕ level for relatively large individuals.
In order to confirm that modern paintings tend to have the eye line at a level consistent with the golden section rule, it is necessary to verify the data obtained with other data. The website Fine Art America offers thousands of portraits of modern celebrities. There are about 5,000 of these images (approximately equally politicians, actors, musicians and athletes). And again, we clearly see on the graph a maximum corresponding to 1 / ϕ, and not 2/3.
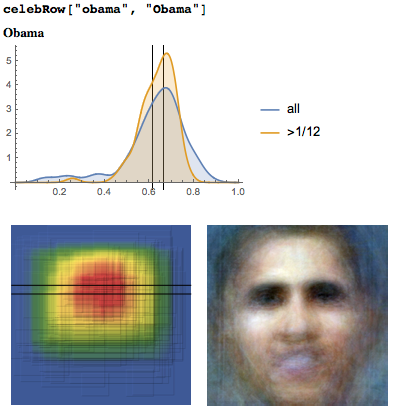
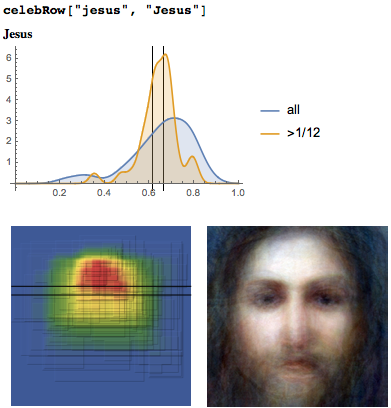
For individual celebrities, the distribution may be different. Here is a small code snippet that uses some of the functions defined in the previous section to analyze individual portraits.

Here are some examples (we used about 150 portraits of one person.)
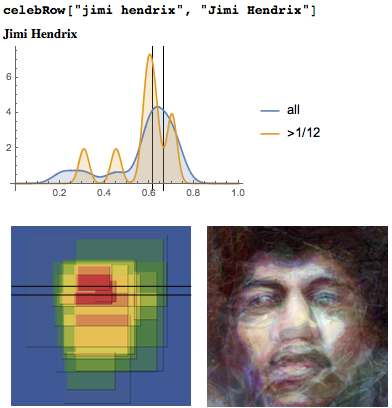
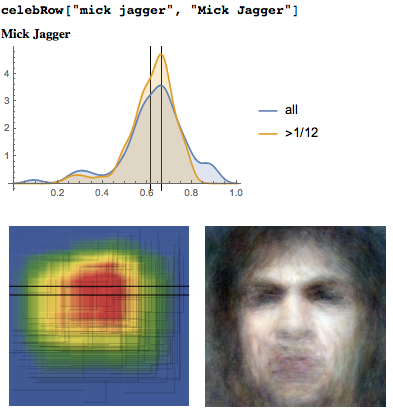
Suddenly, Jimi Hendrix’s face is almost entirely consistent with the golden section rule, and Mick Jagger’s face is closer to rule of thirds. The faces of Obama and Jesus obey the rule of thirds in its classic form.
The height of the eye line in the work of professional photographers
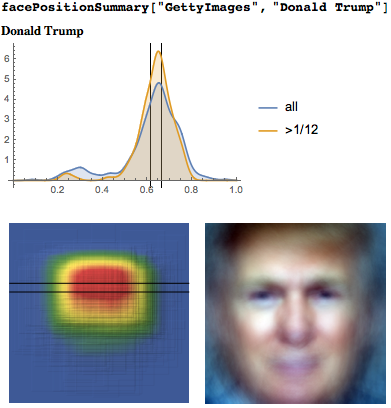
Now let's look at a set of photos and determine the position of the faces on them. Let's start with professional portrait photos. Getty Image collection contains the best photos. Unlike the paintings, the maximum for large faces is much closer to 2/3 (ROT) than to 1 / ϕ for 200,000 randomly selected portraits.

And again we build the distribution of the height of the line of eyes / relative face size. For very large relative sizes of the face, the most common height of the eye line falls even below 1 / ϕ.
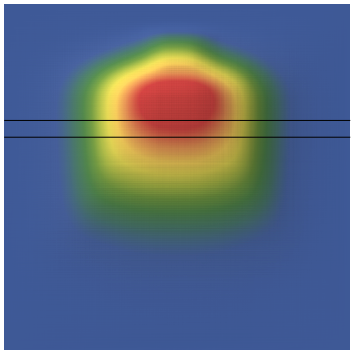
And here is the corresponding heat map, created by overlaying 300,000 people.
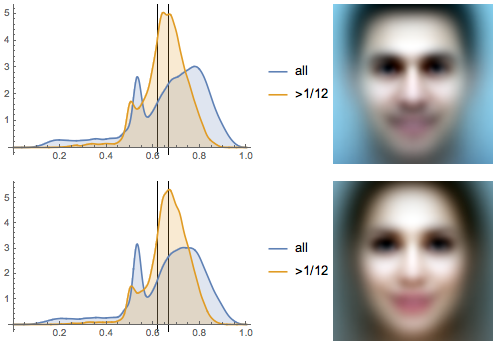
What about other photos that are less aesthetically pleasing than Getty Images? There are a lot of photos on the Shutterstock website. We see that in this case the maximum of the graph of the height of the eye line falls on the value of 2/3 (that is, it is again about the rule of third). This time we present the results for portraits tagged with the same tags.
Below you can see the distribution of the height of the eye line and the overlap of 100,000 male and female portraits (the relatively narrow peak in the double peak structure was due to photographs that do not show the entire face).
If you further narrow down the choice of photos (for example, impose 10,000 portraits tagged with a nerd or beard tag), the result will again shift towards the rule of thirds.

The following shows the results of the analysis of photos with tags of happiness and sadness .
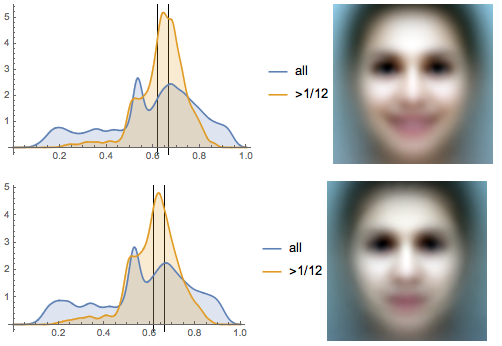
All photos tagged with each of the six types of tags (man, woman, nerd, beard, happiness, sadness) demonstrate remarkable stability in the position of the maximum of the eye line. It is always in the interval [1 / φ, 2/3] with a tendency to 2/3 (rule of thirds).
What about children? The two peaks are now even more pronounced, with the first peak being even more than the second, due to the fact that the set of children's photos are simply the face of a child, taken in close-up.
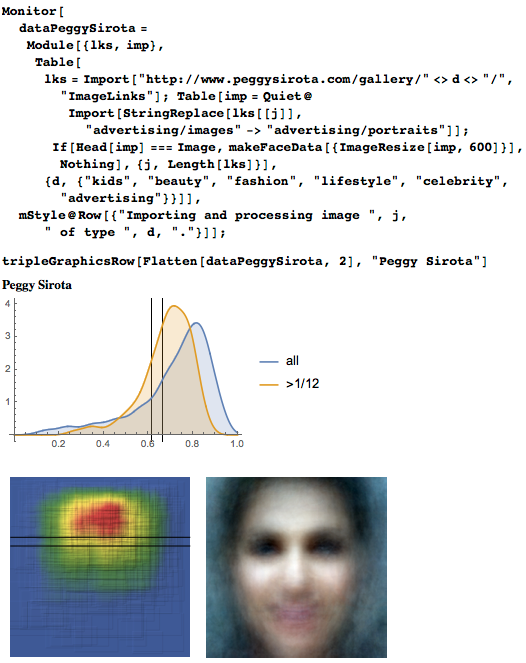
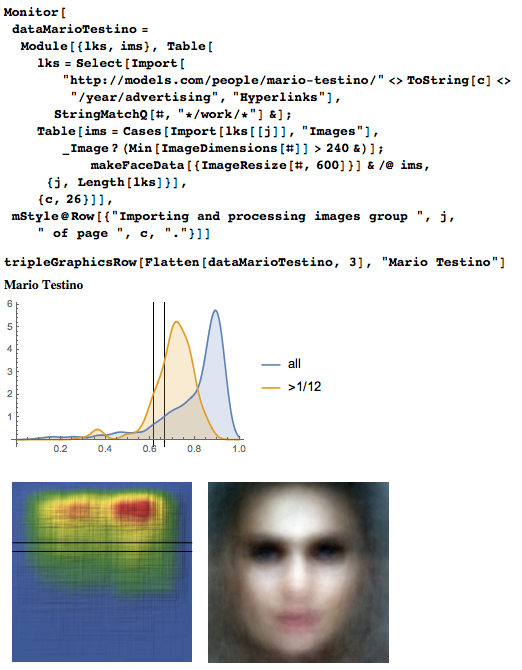
Next we look at the height of the eye line in the works of two professional photographers: Peggy the Orphans and Mario Testino . Since both photographers often shoot models, the whole body will be shown in the photo, which will shift the indicator we are interested in well above 2/3 (we will return to this phenomenon later).
Eye line height in selfie
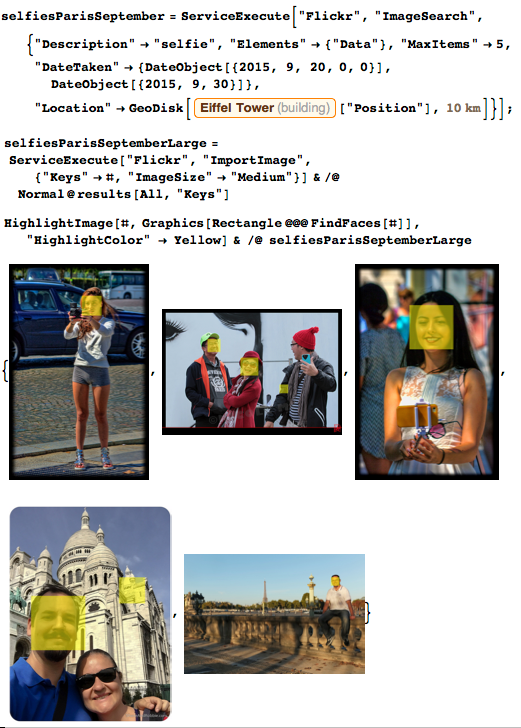
After analyzing professional photos, we must, of course, also take a look at the top of modern amateur photography - selfies (to read about the history of selfies - see Salz ; for a detailed study of increasing the popularity of selfies by three orders of magnitude in the last three years, see Souz et al .). With the help of "Flickr" we can immediately upload the selfie samples. Here are five selfies made last week in the Eiffel Tower area. However, not all images marked as selfies are close-up faces.
More than 100,000 selfies are added to Instagram every day (you can see them here ), this is the perfect source of selfies. Here is the eye height distribution for 100,000 selfies.

Unlike professional photos, we see that the maximum distribution of the height of the eye line is clearly higher than 2/3 for photos in which the face occupies more than 1/12 of the area of the photo. So the next time you take a selfie, place your face a little lower in the frame to better obey the rules of ROT and ϕ (systematic deviations of the selfie from aesthetic photographic principles have already been considered by Bruno and others ).
The height of the eye line in the selfie changes significantly less compared to professional photos.

And, again, the corresponding heat map.
The maximum total area of a face on a selfie is related to the length of a human hand or a telescopic selfie stick limited by one meter. So selfies with small facial images are more rare than similar photos or pictures.

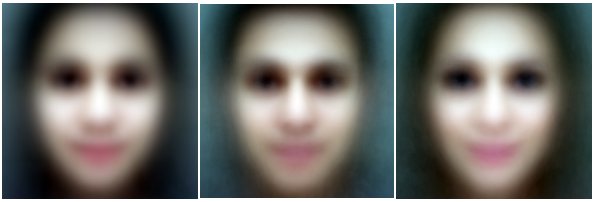
What does an average face look like with selfie photos? The left image is the average version of all persons, the average is all male faces, and the right image is the average version of female faces (the gender was determined heuristically by comparing male and female names with user names). The average selfie resembles a woman's face, because women take selfies much more often. This was also discovered in a recent study by Manovich et al .
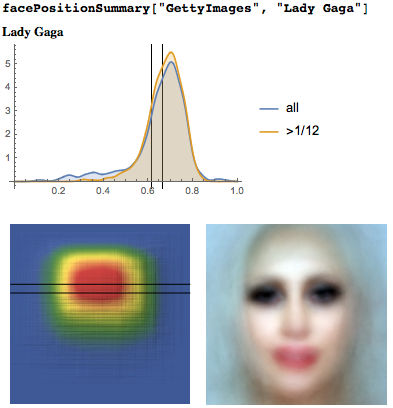
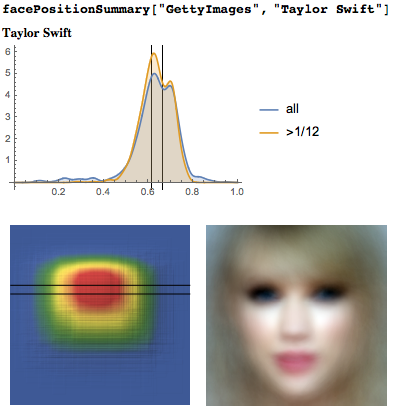
Perhaps the relative height of the line of the eyes depends on the particular person depicted in the portrait. We provide the full code below if the reader wants to experiment with data that is not covered here. Now let's measure the height of the eye line on images from the Getty site, marked with tags, which will be specified in the positionSummary function .


Now we can get in just a minute the average height of the line of eyes of people whose names are widely known (each result is based on an analysis of 600 portrait shots): Lady Gaga, Taylor Swift, Brad Pitt and Donald Trump. , . , , 1/ϕ.

. .
LinkedIn . — . 25000 25000 , . LinkedIn , , 1/12 , , . , 10% 30% .
10000 - LinkedIn.

, 1/ϕ — , . 1/ϕ. - , 30% . LinkedIn 20% , , .
. , , «» . , «» .
LinkedIn, . : , . 2500 , :

.
1/ϕ , - . : , - . -. — LinkedIn Wolfram; 1/ϕ.

, . .

:

LinkedIn, , 2/3. .
Persons on the covers of the weekly magazines of the last three decades
After analyzing faces on amateur and professional photographs, the next area for research will be magazine covers: photographs for them were taken carefully and selected. TIME magazine even has its own special site for 4,800 covers , under which the magazine has been published for more than 90 years (for a quick look at all the covers, see the cover analysis (Manovich) ).
You just need to download the cover, and then find and extract the face.

Here are two summary distributions for eye line heights:
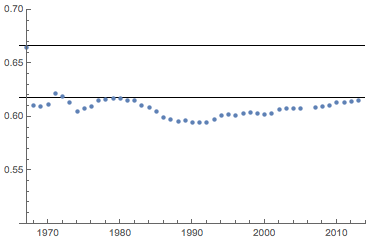
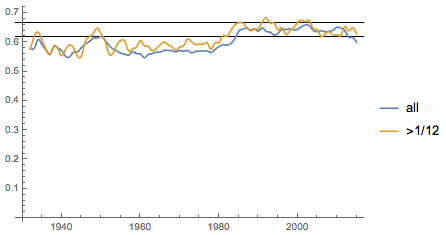
The maximum is at a height of less than 1/2. This is mainly due to the fact that the title of the magazine is placed at the top of the cover. In new editions, the name of the magazine and the images overlap in part. The following graph shows the average height of the eye line over time (by year). Since the 1980s there is a tendency to higher eye line positions on the cover.

If we calculate the height of the eye line from all issues over the past twenty-five years, we will see a completely different distribution with a bimodal structure. One of the peaks is almost exactly at 1 / ϕ.

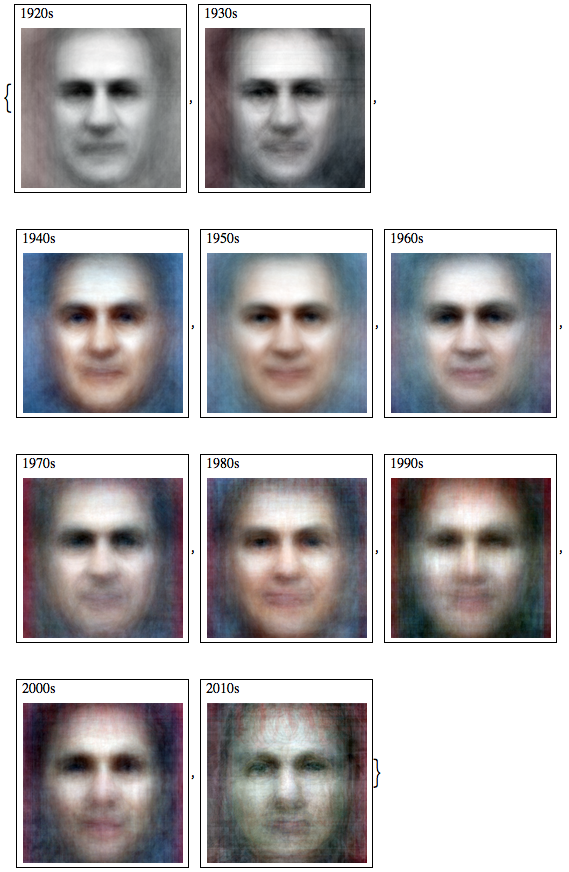
But the average faces for decades. We also see that the covers of the first two decades of the magazine’s release were black and white.
As a second example, we now look at the German journal SPIEGEL . Again, you just need to load all the covers, detect faces and extract data about the eye line.
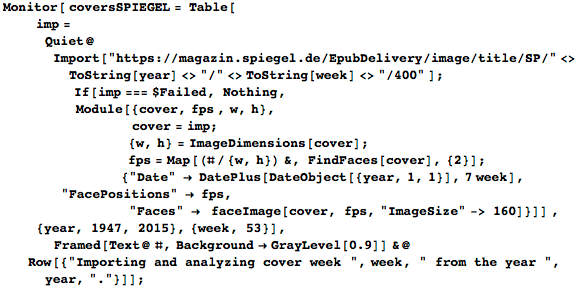
And again, because the title of the magazine is placed at the top of the cover, the eye line is at a relatively low level (≈0.56).

The heat map of the location of the faces clearly demonstrates this.

Taking into account the fact that the name of the magazine “SPIEGEL” , as a rule, occupies about 13% of the height of the cover, and that there are gaps in its lower part, the renormalized peak of the height of the eye line turns out to be almost exactly 1 / ϕ.
As a third example, we chose the less politicized magazine Rolling Stone . They also have a collection of covers until 2013. The distribution of the height of the eye line is again bimodal, with a peak of 1 / ϕ. So the faces on the Rolling Stone covers are consistent with the golden section rule.
If you look at the length of time, you can see certain patterns in the change in the midline of the eyes in each of the eight-year periods.
The cumulative average height of the eye line is close to 1 / ϕ, and the average height up to 2013 deviates from 1 / ϕ by only 0.4%.
Here are the averaged faces over the decades.

Comic covers
Comic covers are another interesting source of images for analysis. The Comic Book Database has a large collection of comic book covers. For now, we’ll confine ourselves to Marvel Comics and DC Comics with their 72,000 covers. Since comics are not photos, face recognition is now becoming more difficult. But even in such conditions, we successfully recognized about 90 thousand faces.
Then everything is as usual (eye line height, heat map, average face) for Marvel Comics.
And the same for DC Comics.

All three features demonstrate remarkable consistency between the two comic book publishers.
Daily newspapers and fashion magazines
The height of the eye line can be explored in many other image collections. Now you can write a small search function that will start its work from a given site and will extract images and links to pages with a large number of images (this is a simple implementation; for optimization, you can, for example, set up a parallel search).

For example, here are the average data for all images (with a size larger than 200 pixels) from the website of The New York Times newspaper dated February 8, 2016. The peak of the graph is between 2/3 and 1 / ϕ.

Here is the data for the weekly German newspaper: Die Zeit . At this time, the maximum graphics for large face images is at the level of 2/3.

Here are data on 1000 images from CNN .

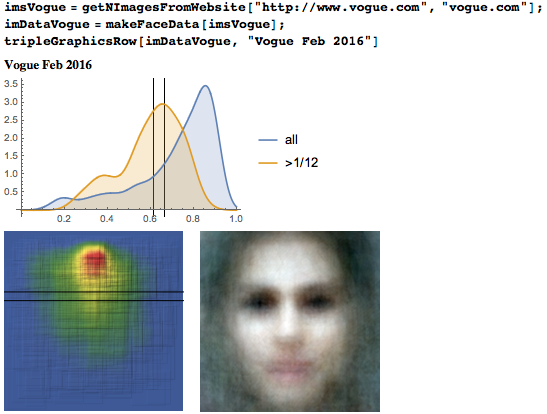
The height of the eye line in fashion magazines gives a completely different distribution. Here are the results for 1000 images from Vogue magazine . Since the site contains photos of stylishly dressed models in full growth, the head turns out to be small, and the eye line is very high. As a result, we get a high narrow peak of the blue curve.
GQ Magazine's cover photo analysis also shows a 2/3 peak line height for close-ups.

The maximum for the line of eyes of people on the cover of People magazine is again at the level of 2/3 for large surfaces.

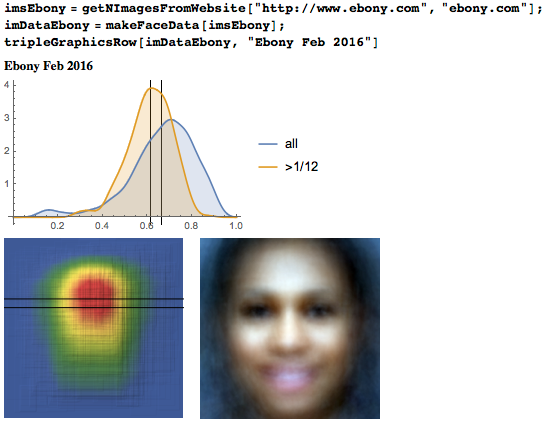
But the results for the magazine Ebony . This time, the peak on the eye height chart for close-ups is at 1 / ϕ.
If we take a bodybuilding magazine, then, as in the case of images from Vogue, we will see a very high eye line - again because, due to the specifics of the magazine, people are often depicted full-length. The average face is very different from the previous averages.

After analyzing the data from the magazine Allure , we get a face with smoother features with a maximum higher than 2/3.

A person is ready from the magazine Gothic Beauty basically meet the rule of the golden section.

20/20 magazine specializes in glasses. It is rather expected that the average face also appears with dark glasses, and the height of the eyes is more than 2/3.

Celebrities from the film industry
Another good source for analysis is movie posters. 35,000 posters posted on Movie Posters

More interesting is how the average graph changes over time. Until the 1980s, the height of the eye line was toward the center of the poster. After that, the average position of the eye line was increasingly in the interval [1 / φ, 2/3].
The shift of the average height of the eye line on movie posters is even more clearly visible on the corresponding heat maps.

Here is the average face from all posters over the past five years.

Cinema: eye line in motion
We completed the last note with graphs of proportions in the cinema, and now we will also end with the analysis of some films. The Internet Archive has a collection of 20,000 films available for download. We will look at the locations of the faces of two well-known classics: Buster Keaton from General 1926 and Fritz Lang from Metropolis 1927. Let's start with the General . The average value for all persons (excluding their size) is 2/3, and for those shot with more close-ups - below.

It is interesting to see how the height of the eye line changes over time in a single film. Here is a slightly different heat map, which just shows the change in the height of the eye line. The colors indicate the number of frames containing detected faces.

Since the main character in the film moves a lot, the heat map of the location of the face is more structured compared to the heat map of photos and pictures.

The Fritz Lang metropolis , which was released just a year later than General , was shot in a completely different style. Even quickly scrolling through the movie, you can see that the faces appear much higher in the frame. This impression is confirmed by the actual data on the position of the eye line.

The graph, based on all data on the eye line, shows that close-up faces appear particularly high in the frame.

Now let's combine the results we obtained with the results of the analysis of the ninth series of the ninth season of The Big Bang Theory, called Platonic Transposition . Most individuals appear at a level above 2/3.

However, the peak of the graph showing the position of the eye line for close-ups is close to 2/3.

But the schedule, created on the basis of the episode of the series The Man in High Castle . The peak of the graph, reflecting the height of the eye line, is closer to 1 / ϕ than to 2/3.

Finally, the third and final example of the series - the eighth episode of the sixth season of the Walking Dead . For close-ups, we see a pronounced bimodal distribution along the height of the eye line with two maxima at 1 / φ and 2/3.

findings
In the second part of our study of the golden section in art, we considered the height of the eye line and the position of the faces. Using the FindFaces function and rules for determining the height of the eye line, we performed calculations with more than a million faces.
The maxima of the distribution of the heights of the eye line for photographs and paintings are mostly in the range from 0.6 to 0.67. For ancient paintings and modern photographs, the peaks are approximately 2/3, which corresponds to the rule of thirds. Interestingly, modern art portraits show the peak of the height of the eye line on a 1 / ϕ chart for close-ups (“large” faces - occupying> 1/12 of the total area). The peak of the graph, indicating the position of the eye line for selfies, is about 0.7 (higher than for painting and many professional photos). People on the cover of magazines that we have analyzed (especially over the past few decades) tend to match the golden ratio. Photos from various newspaper sites - as well. In the case of profile photos from LinkedIn, clear gender differences were found between the positions of the height of the eye line: the faces of the men turned out to be more in line with the golden section rule. Analysis of the films show that people, especially small ones, are at a height significantly higher than 2/3. But the analysis of modern serials shows that the height of the line of eyes of the characters meets the rule of thirds, the golden ratio, and sometimes both of them.
Source: https://habr.com/ru/post/327078/
All Articles