Analysis of communication from the Tor network to the infrastructure using the ELK stack
ElasticSeach is a fairly flexible platform, and the data obtained in it can be processed in many ways, even outside the ELK stack. For this, more than a dozen different APIs are provided. But for many tasks there will be enough Kibana capabilities.
One of these I would like to share with the community. For me, like any beaver, it is important to see and understand the communication of my infrastructure with the outside world. One of the most interesting is communication with the onion network (Tor).

Of course, ELK is not limited to the stack; it is just a tool for storing and processing information. The effectiveness of a product based on it is determined by the data that needs to be taken somewhere. In my case, this is raw Netflow data taken directly from a network device, without pre-processing by a smarter collector. This approach has its pros and cons, but not about that.
')
For example, at the output we get approximately the following information:
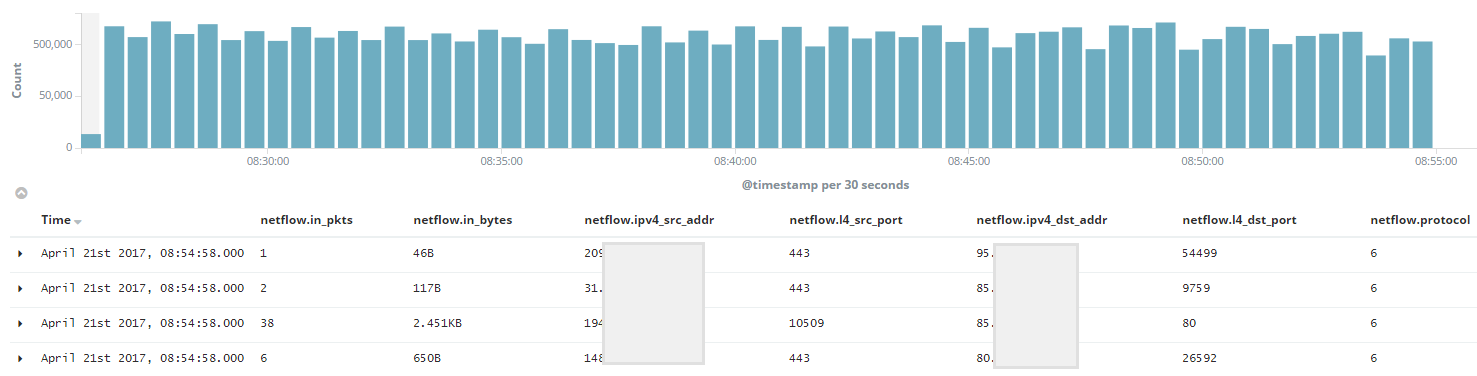
I would like to note that in this example only the most interesting fields are displayed, most of the information obtained through Netflow is omitted. One of the main advantages, in my opinion, is that it is possible to operate with data on the amount of traffic in the stream.
Already at this stage I would like to make a reservation that there is one nuance in the question of communication with the Tor network. Unfortunately, you and I have the ability to identify only traffic from the Tor network, but not To it. The torprojects.org community provides only a list of Exit nodes, and I met several topics on the fact that the list of Entry nodes cannot be uniquely identified.
The network contains lists that supposedly describe the incoming Tor nodes, but unfortunately this information does not have any reliability. In turn, the trusted list of Exit nodes is available at this link: https://check.torproject.org/exit-addresses . As a result, we work only with traffic from Tor.
Now how to use this information inside ELK. To extract traffic from the Tor network from the entire data stream, you can create a filter that will be built according to the following scenario:
If necessary, after the 'AND' add clarification filter. To test the filter's performance, you can manually create a construction (Exit of nodes with 'OR' in the middle) using bash and just check with the clipboard whether the search functions correctly:
The list is large, so the default ElasticSearch configuration can be cursed that we use too many boolean operators, so we increase the limit in /etc/elastcisearch/elasticsearch.yml with the following configuration and reboot the daemon:
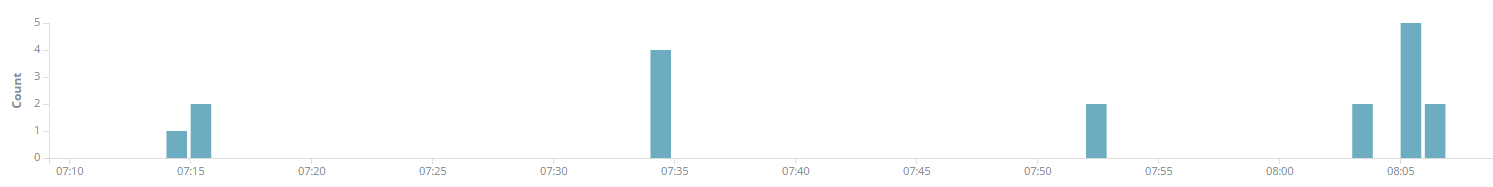
The strength of ElasticSearch is that it quickly filters the requested information, so we get the result pretty quickly. Save as Search in Kibana and use. In theory, we have achieved the task - communication from onion networks in front of your eyes.
Most likely, within an hour these are read streams, but each of which is interesting:
The problem is that the list of Exit nodes is not constant, so it is advisable to update it with some regularity. The manual method is not suitable. In theory, you can find the correct form of a POST request for the Kibana interface, which contains the value of the Search filter and its identifier. Thus, by generating a Web request, update the list. But there is a more convenient option.
Kibana stores all information about objects in the same ElasticSearch cluster, in the '.kibana' system index. There you can find a document that describes the previously created Search query, containing a list of Exit nodes:
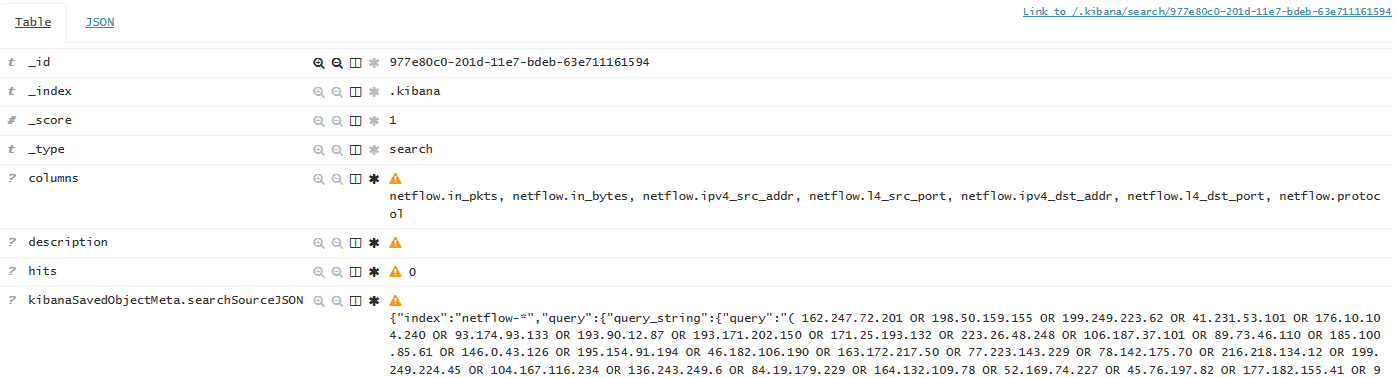
So, you just need to update the 'query' field of this particular document in accordance with the information check.torproject.org/exit-adresses. For this, I’ve put a Python script, the current version of which can be found here . For review, under the spoiler provide the latest version at the moment:
The script gets a list of Exit nodes and generates a 'query' on its base for the Search object. To update the document, it was necessary to call the curl-owned OS, because the Python API, with completely identical requests, caused a serialization error in ElasticSearch, which never came to be resolved. 'curl' in turn uses the query.json file, the path to which needs to be specified in the script. In general, we correct the code in accordance with the README prescription, then we drop the script in the server crontab and get a dynamically updated serch that can be used further.
The first thing that can be seen is, of course, multiple scans. You are constantly scanned from Tor, well, in general, as well as from everywhere. Listen to and on the fourth level of OSI, and web applications, and everything else. Therefore, I would advise analyzing network information that is not collected before the firewall, but after. Firstly, everything that has not passed inside is swept aside, and secondly, you will see already translated addresses of internal nodes.
The second is that the main volume of data is completely valid requests for services on your network. Today, it is normal to anonymize your use of the network; therefore, communication from Tor primarily contains connections to your most popular servers. Perhaps, of course, some organizations (which users need more than their users) have a desire to chop up this communication in the bud. Such cases really are. I hold the opinion that we have no right to limit this sphere of development of the Internet community, and we must learn to understand this traffic.
We don’t need to pay special attention to both previous groups, learn to recognize them, and skip past them. However, this is not all. Correct analysis can promptly reveal interesting facts.
Check the traffic for C & C (command & control) already subject to the attacker nodes on your network, whether it is a machine in a botnet or a targeted attack.
In principle, both of the following communications should be analyzed for C & C:
Both services are still actively used in the wild to tunnel traffic, even in the case of targeted Advanced Persistent Threat attacks. One of the clearest examples of lately will be, for example, the action of the Cobalt grouping in the case of an attack on the Taiwan First Bank ( link ).
I also advise you to pay attention to non-standard Web requests. It will be more difficult to filter here, but I would advise a couple of clues.
The lion's share of the same C & C today goes through the Web, because in one form or another this traffic is allowed in any organization. For this reason, in principle, any TCP 80 and 443, which is connected with a WEB server from your network, is interesting.
Additionally, pay attention to requests addressed to less popular Web servers. And especially if there are those that are based on open source frameworks, especially if the amount of traffic exceeds the standard. For even greater transparency, you can bring the logs of such servers or WAF to a separate ElasticSearch index and look in the parallel visualization window which HTTP fields and values directly contain the requests themselves.
Not to be unfounded, I will try to show how to optimize such data analysis in the ELK stack. I’ll dwell, for example, on an attempt to quickly identify ICMP or DNS tunneling attempts based on the data collected.
Any information is perceived better in graphical form, so let's try to create ICMP communication visualization that exceeds the rate of traffic. We determine the rate by observing active traffic on the network, so that ordinary ICMP operations would not pop up, but attempts to flood the script or transmit the output of the command in ICMP packets could well be caught. I stopped at values greater than 2KB per stream. To get this traffic from the previous search, create a new one, at the end adding the following pattern:
Next, select Visualize> Pie Chart. The newly selected Search is selected as a data source.

As a parameter for determining the angle of the sector, specify the sum of the parameter 'netflow.in_bytes'.
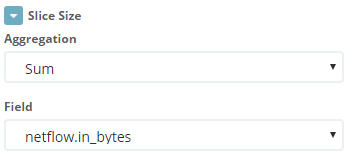
We specify that the pie should be divided into sectors according to the IP address of the destination.
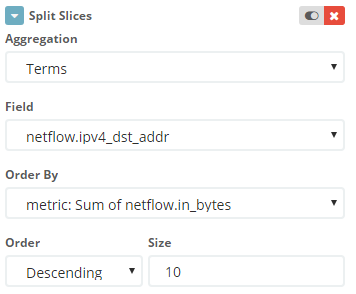
Since in the case of the Tor network, the source address does not say anything (the same communication can be carried out with several addresses), the connection is identified by the address on your network. But for the convenience of identifying the flow, I also created the second level of the pie, where the node address in the Tor network is indicated.
I want to note one nuance - under the mentioned parameters, Search will fall into the usual ping, which was conducted for a long time and collected the number of packages in one direction 25+.
You can perform another optimization - manually in Kibana create a field that will display the number of bytes per packet in one particular Netflow stream. To do this, in the Scripted Fields section, create a unit that performs the following task in the painless language:
By adding this field to Search, you can immediately filter out standard-size packets when viewing information. Unfortunately, it is impossible to filter streams by this field, Kibana reports this when creating a field:
However, in the Dashboard, you can directly place information from Search and match the data to the side of the visualization.
The result is:
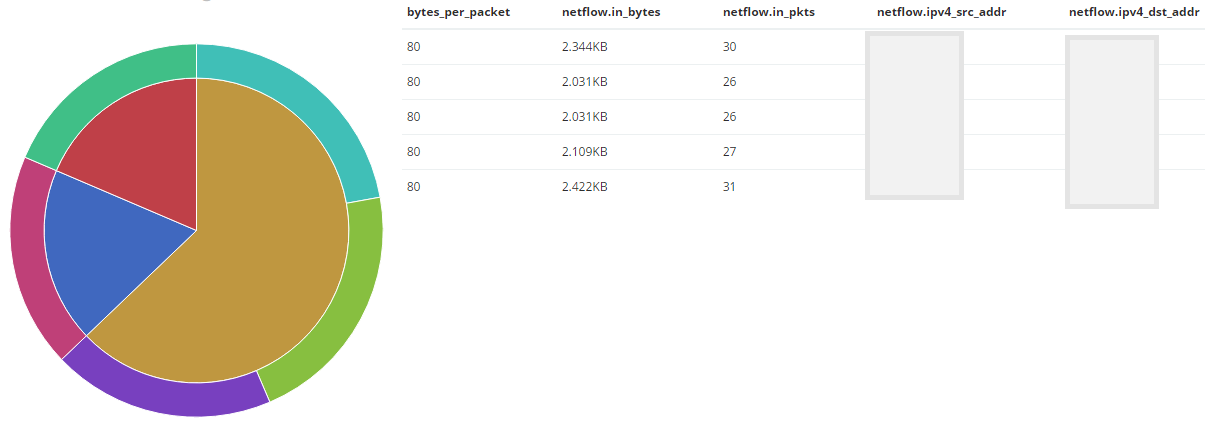
The wider the sector, the more data received the IP address. Also, in this example, it is immediately obvious that all ICMP streams have a standard packet size.
A similar analysis is also suitable for DNS communication, where I stopped on streams larger than 1KB. We correct Search, supplemented by the following request and perform the same manipulations:
Most likely, specific examples in your network can fall into the examples offered by me - monitoring or DNS servers, of course we are filtering them away. As a result, we have a clear picture that displays the deviations of current services. In general, such an analysis of these services should be carried out not only to the traffic that comes from Tor, so this approach can be applied to all the information received by ElasticSearch.
Of course, the list of possible analysis of this information does not pretend to be complete. This is just a superficial example, which it is desirable to further develop. Please, if the reader can describe the methods of analyzing such information - share it, and the community will be interested to me.
Also, most likely, any of these tips can be broken down (in terms of utility) by arguments that do not occur to me. In that case, I would very much like to hear these arguments.
Of course, you will not see all this if a potential attacker who wants to anonymize his behavior uses the VPN-Tor-VPN svyazku or more sophisticated fraud. Therefore, using similar methods it is better to analyze all the traffic of your infrastructure in general. But viewing this information is already very interesting.
Thank you for reading! Hope it was interesting / helpful.
PS Responsibly modify the article in accordance with the amendments of the reader. Please provide notes on the quality of the text in your personal mail, leave comments for discussion directly on the topic of the article.
One of these I would like to share with the community. For me, like any beaver, it is important to see and understand the communication of my infrastructure with the outside world. One of the most interesting is communication with the onion network (Tor).
Of course, ELK is not limited to the stack; it is just a tool for storing and processing information. The effectiveness of a product based on it is determined by the data that needs to be taken somewhere. In my case, this is raw Netflow data taken directly from a network device, without pre-processing by a smarter collector. This approach has its pros and cons, but not about that.
')
For example, at the output we get approximately the following information:
I would like to note that in this example only the most interesting fields are displayed, most of the information obtained through Netflow is omitted. One of the main advantages, in my opinion, is that it is possible to operate with data on the amount of traffic in the stream.
Create a filter
Already at this stage I would like to make a reservation that there is one nuance in the question of communication with the Tor network. Unfortunately, you and I have the ability to identify only traffic from the Tor network, but not To it. The torprojects.org community provides only a list of Exit nodes, and I met several topics on the fact that the list of Entry nodes cannot be uniquely identified.
The network contains lists that supposedly describe the incoming Tor nodes, but unfortunately this information does not have any reliability. In turn, the trusted list of Exit nodes is available at this link: https://check.torproject.org/exit-addresses . As a result, we work only with traffic from Tor.
Now how to use this information inside ELK. To extract traffic from the Tor network from the entire data stream, you can create a filter that will be built according to the following scenario:
( '1st.Exit.Node.IP' OR '2nd.Exit.Node.IP' OR .... 'Last.Exit.Node.IP' ) AND my_regex If necessary, after the 'AND' add clarification filter. To test the filter's performance, you can manually create a construction (Exit of nodes with 'OR' in the middle) using bash and just check with the clipboard whether the search functions correctly:
curl -XGET https://check.torproject.org/exit-addresses | egrep -o '[0-9]{1,3}\.[0-9]{1,3}\.[0-9]{1,3}\.[0-9]{1,3}' | sed -e ':a' -e 'N' -e '$!ba' -e 's/\n/ OR /g' The list is large, so the default ElasticSearch configuration can be cursed that we use too many boolean operators, so we increase the limit in /etc/elastcisearch/elasticsearch.yml with the following configuration and reboot the daemon:
indices.query.bool.max_clause_count: 2048 The strength of ElasticSearch is that it quickly filters the requested information, so we get the result pretty quickly. Save as Search in Kibana and use. In theory, we have achieved the task - communication from onion networks in front of your eyes.
Most likely, within an hour these are read streams, but each of which is interesting:
We update the filter
The problem is that the list of Exit nodes is not constant, so it is advisable to update it with some regularity. The manual method is not suitable. In theory, you can find the correct form of a POST request for the Kibana interface, which contains the value of the Search filter and its identifier. Thus, by generating a Web request, update the list. But there is a more convenient option.
Kibana stores all information about objects in the same ElasticSearch cluster, in the '.kibana' system index. There you can find a document that describes the previously created Search query, containing a list of Exit nodes:
So, you just need to update the 'query' field of this particular document in accordance with the information check.torproject.org/exit-adresses. For this, I’ve put a Python script, the current version of which can be found here . For review, under the spoiler provide the latest version at the moment:
script
#!/usr/bin/env python # ----- README STARTS -------- # # If anyone wants to use this script in their environment # be sure to replace YOUR_SEARCH_ID with actual search ID # within the curl command URL at line 70. # # Also 'post_body' variable at line 63 should be tuned according # to your query, as it is build assuming there's some specific static # expressions from the beginning and the of query.json file. # See: https://github.com/dtrizna/my_ELK_scripts/blob/master/TOR_SEARCH/query.json # # Additionaly set correct path to query.json file # at lines 65 and 70, replacing <PATH/TO/> entries. # # ----- README ENDS ---------- import re import requests import subprocess # ------------------------- # GET THE LIST WITH TOR EXIT NODES FROM TORPROJECT WEB PAGE nodes_raw = requests.get('https://check.torproject.org/exit-addresses') nodes_raw_list = nodes_raw.text.split() # ------------------------- # FILTER FROM WHOLE PAGE ONLY IP ADRESSES regex = re.compile(r'\d{1,3}\.\d{1,3}\.\d{1,3}\.\d{1,3}') nodes = filter(regex.search, nodes_raw_list) # ------------------------- # IP ADRESSES ARE IN UNICODE FORMAT, ENCODE THEM TO STRING search_query = '' i = 0 while i < len(nodes): try: nodes[i] = nodes[i].encode('ascii') except UnicodeEncodeError as err: print "Error due to IP adress encoding from Unicode to ASCII." print "UnicodeEncodeError says: {}".format(err) i = i + 1 # ------------------------- # CREATE KIBANA SEARCH QUERY search_query = " OR ".join(nodes) # ------------------------- # UPDATE FILE, THAT WILL BE USED AS BODY IN UPDATE COMMAND # (CAN'T USE DIRECTLY, ES RETURNS ERROR, WORKS ONLY THROUGH FILE USING CURL) with open('query.json', 'r') as file: data = file.readlines() # 'data' is list, every element describes line in file called in above cycle # As there's only one line(it must be onelined, for ES to accept it), # data[0] represents all the future POST body request. # It has fixed values from the beginning and the end of line. # Although middle part may vary depending on request to tor website above. post_body = data[0][:127] + search_query + data[0][-258:] with open('<PATH/TO/>query.json', 'w') as file: file.writelines(post_body) # ------------------------- # FINALY MAKE THE UPDATE REQUEST TO ELASTICSEARCH AND SEE REPLY call = subprocess.Popen("curl -XPOST http://localhost:9200/.kibana/search/YOUR_SEARCH_ID/_update?pretty=true -d@<PATH/TO/>query.json", shell=True, stdout=subprocess.PIPE, stderr=subprocess.PIPE) (result, error) = call.communicate() print('Result is:\n {}\n'.format(result)) print("Error is: (if there's connection statistics - it's OK!)\n {}".format(error)) The script gets a list of Exit nodes and generates a 'query' on its base for the Search object. To update the document, it was necessary to call the curl-owned OS, because the Python API, with completely identical requests, caused a serialization error in ElasticSearch, which never came to be resolved. 'curl' in turn uses the query.json file, the path to which needs to be specified in the script. In general, we correct the code in accordance with the README prescription, then we drop the script in the server crontab and get a dynamically updated serch that can be used further.
We analyze the traffic itself
The first thing that can be seen is, of course, multiple scans. You are constantly scanned from Tor, well, in general, as well as from everywhere. Listen to and on the fourth level of OSI, and web applications, and everything else. Therefore, I would advise analyzing network information that is not collected before the firewall, but after. Firstly, everything that has not passed inside is swept aside, and secondly, you will see already translated addresses of internal nodes.
The second is that the main volume of data is completely valid requests for services on your network. Today, it is normal to anonymize your use of the network; therefore, communication from Tor primarily contains connections to your most popular servers. Perhaps, of course, some organizations (which users need more than their users) have a desire to chop up this communication in the bud. Such cases really are. I hold the opinion that we have no right to limit this sphere of development of the Internet community, and we must learn to understand this traffic.
We don’t need to pay special attention to both previous groups, learn to recognize them, and skip past them. However, this is not all. Correct analysis can promptly reveal interesting facts.
Check the traffic for C & C (command & control) already subject to the attacker nodes on your network, whether it is a machine in a botnet or a targeted attack.
In principle, both of the following communications should be analyzed for C & C:
- ICMP packets larger than ping by default;
- DNS communication with the same symptom - non-standard large packets;
Both services are still actively used in the wild to tunnel traffic, even in the case of targeted Advanced Persistent Threat attacks. One of the clearest examples of lately will be, for example, the action of the Cobalt grouping in the case of an attack on the Taiwan First Bank ( link ).
I also advise you to pay attention to non-standard Web requests. It will be more difficult to filter here, but I would advise a couple of clues.
The lion's share of the same C & C today goes through the Web, because in one form or another this traffic is allowed in any organization. For this reason, in principle, any TCP 80 and 443, which is connected with a WEB server from your network, is interesting.
Additionally, pay attention to requests addressed to less popular Web servers. And especially if there are those that are based on open source frameworks, especially if the amount of traffic exceeds the standard. For even greater transparency, you can bring the logs of such servers or WAF to a separate ElasticSearch index and look in the parallel visualization window which HTTP fields and values directly contain the requests themselves.
Data Analysis with ELK
Not to be unfounded, I will try to show how to optimize such data analysis in the ELK stack. I’ll dwell, for example, on an attempt to quickly identify ICMP or DNS tunneling attempts based on the data collected.
Any information is perceived better in graphical form, so let's try to create ICMP communication visualization that exceeds the rate of traffic. We determine the rate by observing active traffic on the network, so that ordinary ICMP operations would not pop up, but attempts to flood the script or transmit the output of the command in ICMP packets could well be caught. I stopped at values greater than 2KB per stream. To get this traffic from the previous search, create a new one, at the end adding the following pattern:
netflow.in_bytes: {2000 TO *} AND netflow.protocol: 1 Next, select Visualize> Pie Chart. The newly selected Search is selected as a data source.
As a parameter for determining the angle of the sector, specify the sum of the parameter 'netflow.in_bytes'.
We specify that the pie should be divided into sectors according to the IP address of the destination.
Since in the case of the Tor network, the source address does not say anything (the same communication can be carried out with several addresses), the connection is identified by the address on your network. But for the convenience of identifying the flow, I also created the second level of the pie, where the node address in the Tor network is indicated.
I want to note one nuance - under the mentioned parameters, Search will fall into the usual ping, which was conducted for a long time and collected the number of packages in one direction 25+.
You can perform another optimization - manually in Kibana create a field that will display the number of bytes per packet in one particular Netflow stream. To do this, in the Scripted Fields section, create a unit that performs the following task in the painless language:
doc['netflow.in_bytes'].value / doc['netflow.in_pkts'].value By adding this field to Search, you can immediately filter out standard-size packets when viewing information. Unfortunately, it is impossible to filter streams by this field, Kibana reports this when creating a field:
These scripted fields are computed on your fly from your data. They can not be searched. You can manage, but be careful, scripts can be tricky!
However, in the Dashboard, you can directly place information from Search and match the data to the side of the visualization.
The result is:
The wider the sector, the more data received the IP address. Also, in this example, it is immediately obvious that all ICMP streams have a standard packet size.
A similar analysis is also suitable for DNS communication, where I stopped on streams larger than 1KB. We correct Search, supplemented by the following request and perform the same manipulations:
netflow.in_bytes: {1000 TO *} AND netflow.protocol: 17 AND ( netflow.l4_dst_port: 53 OR netflow.l4_src_port: 53 ) Most likely, specific examples in your network can fall into the examples offered by me - monitoring or DNS servers, of course we are filtering them away. As a result, we have a clear picture that displays the deviations of current services. In general, such an analysis of these services should be carried out not only to the traffic that comes from Tor, so this approach can be applied to all the information received by ElasticSearch.
Finally
Of course, the list of possible analysis of this information does not pretend to be complete. This is just a superficial example, which it is desirable to further develop. Please, if the reader can describe the methods of analyzing such information - share it, and the community will be interested to me.
Also, most likely, any of these tips can be broken down (in terms of utility) by arguments that do not occur to me. In that case, I would very much like to hear these arguments.
Of course, you will not see all this if a potential attacker who wants to anonymize his behavior uses the VPN-Tor-VPN svyazku or more sophisticated fraud. Therefore, using similar methods it is better to analyze all the traffic of your infrastructure in general. But viewing this information is already very interesting.
Thank you for reading! Hope it was interesting / helpful.
PS Responsibly modify the article in accordance with the amendments of the reader. Please provide notes on the quality of the text in your personal mail, leave comments for discussion directly on the topic of the article.
Source: https://habr.com/ru/post/327048/
All Articles