How Reddit created r / Place
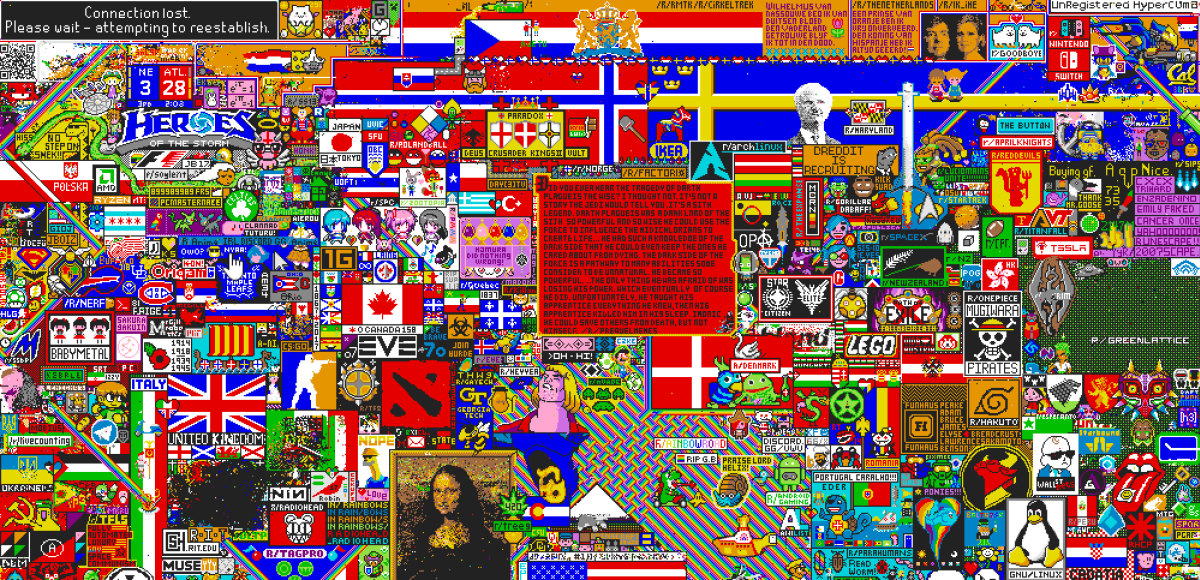
Several teams worked on the project - frontend, backend, mobile development. For the most part, it was implemented on technologies that already existed in Reddit. In this article we will look at how Place was created from the technical side. If you want to see the Place code, then it is here .
Requirements
To begin with, it was extremely important to determine the requirements for the April Fools project, because it was necessary to start it without “overclocking”, so that all Reddit users could immediately access it. If he had not worked perfectly from the very beginning, he would hardly have attracted the attention of a large number of people.
The board must be 1000x1000 tiles in order to look very large.
All clients must be synchronized and display a single board status. After all, if different users have different versions, it will be difficult for them to interact.
You need to support at least 100,000 users at the same time.
Users can post one tile per five minutes. Therefore, it is necessary to maintain an average update rate of 100,000 tiles per five minutes (333 updates per second).
The project should not adversely affect the operation of the other parts and functions of the site (even if the traffic is high at r / Place).
- In the event of unforeseen bottlenecks or failures, flexible configuration is necessary. That is, you need to be able to adjust the size of the board and the allowed drawing frequency on the fly, if the data volume is too large or the update frequency is too high.
Backend
Implementation Solutions
The main difficulty in creating the backend was to synchronize the board status display for all clients. It was decided to make clients listen in real time to the events of placing tiles and immediately request the status of the entire board. Having a slightly outdated full state is valid in the case of a subscription to updates before this full state has been generated. When the client receives the full status, it displays all the tiles that he received during the wait; all subsequent tiles should be displayed on the board immediately upon receipt.
For this scheme to work, the request for the complete state of the board must be executed as quickly as possible. At first, we wanted to store the entire board on one line in Cassandra , and for each query to simply read this line. The format of each column in this line was:
(x, y): {'timestamp': epochms, 'author': user_name, 'color': color} But since the board contains a million tiles, we needed to read a million columns. In our work cluster, this took up to 30 seconds, which was unacceptable and could lead to an excessive load on Cassandra.
Then we decided to keep the whole board in Redis. We took a bit field per million of four-bit numbers, each of which could encode a four-bit color, and the x and y coordinates were determined by the offset ( offset = x + 1000y ) in the bit field. To obtain the full state of the board, it was necessary to count the entire bit field.
It was possible to update the tiles by updating the values with specific offsets (no need to block or carry out the whole read / update / write procedure). But all the details still need to be stored in Cassandra, so that users can find out who and when placed each of the tiles. We also planned to use Cassandra to restore the board when Redis crashes. Reading the entire board from it took less than 100 ms, which was fast enough.
Here is how we stored the colors in Redis using the 2x2 board as an example:

We were worried that we could rest against reading throughput in Redis. If many clients were simultaneously connected or updated, then all of them simultaneously sent requests for a full board status. Since the board was a general global state, the obvious solution was to use caching. We decided to cache at the CDN (Fastly) level, because it was easier to implement, and the cache was the closest to the clients, which reduced the time for receiving the answer.
Full board status requests were cached Fastly with a timeout per second. To prevent a large number of requests when the timeout expires, we used the stale-while-revalidate . Fastly supports about 33 POPs, which independently carry out caching, so we expected to receive up to 33 requests for the full state of the board per second.
For the publication of updates for all clients, we used our web service . Before that, we successfully used it to make Reddit.Live work with more than 100,000 simultaneous users for notifications about personal messages in Live and other features. The service was also the cornerstone of our past April Fools projects - The Button and Robin. In the case of r / Place, clients supported web socket connections to receive updates about real-time tile placement.
API
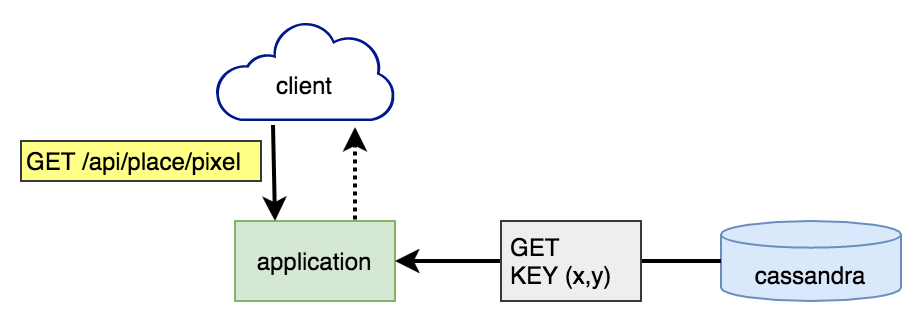
Getting full board status
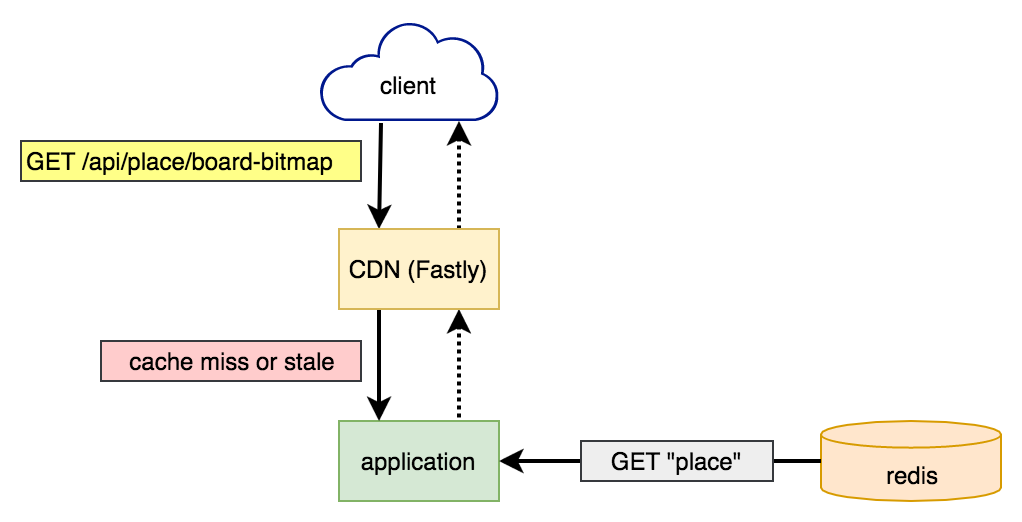
At first, requests got into Fastly. If he had a valid copy of the board, he immediately returned it without contacting the Reddit application servers. If not, or the copy was too old, then the Reddit application read the complete board from Redis and returned it to Fastly so that it caches and returns to the client.
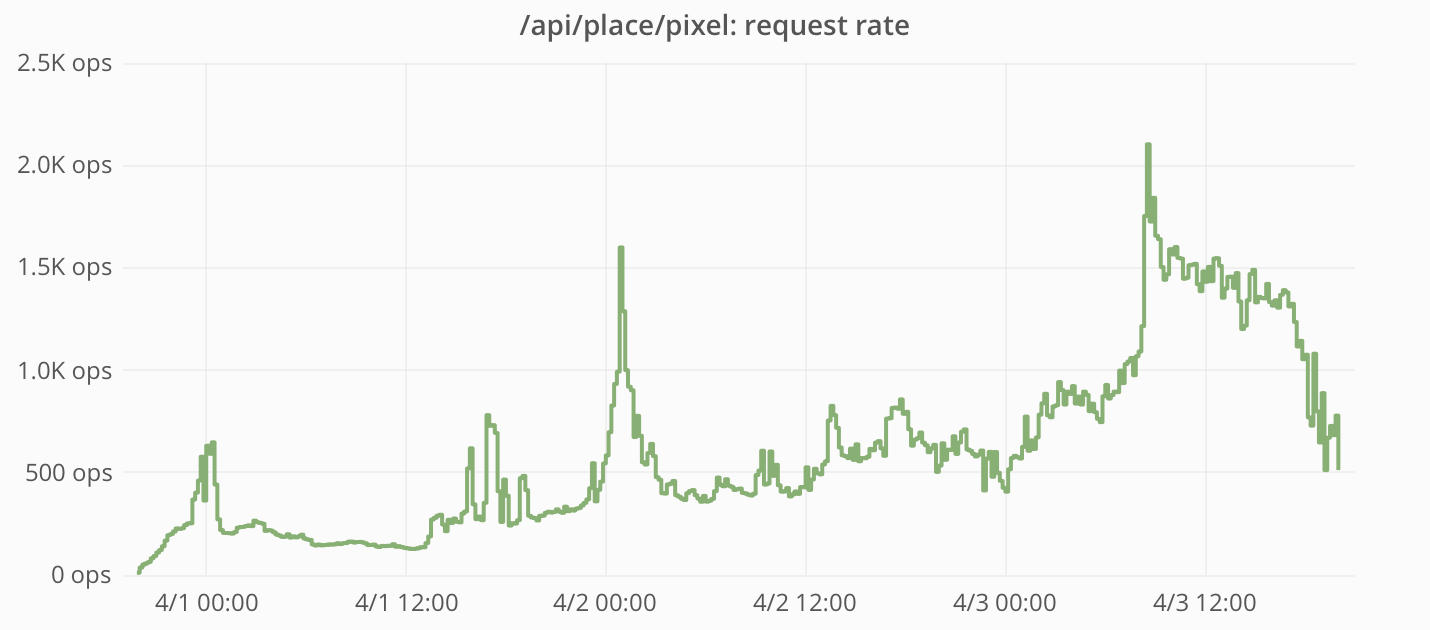
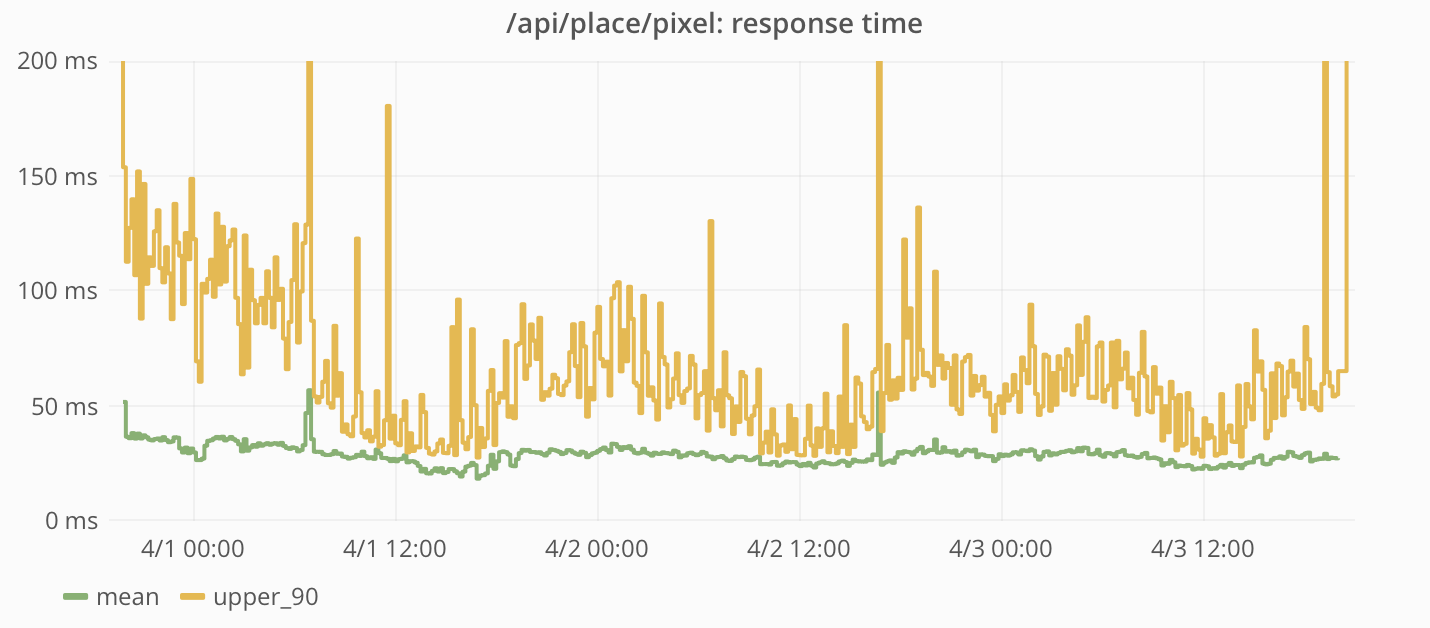
The frequency of requests and response times measured by the Reddit application:

Note that the request rate never reached 33 per second, that is, caching with Fastly was a very effective means of protecting the Reddit application from most requests.

And when requests still reached the application, Redis responded very quickly.
Tile rendering

Tile rendering stages:
- From Cassandra, the timestamp of the last placement by the user of the tile is read. If it was less than five minutes ago, then we do nothing, and an error is returned to the user.
- Details about the tile are recorded in Redis and Cassandra.
- The current time is recorded in Cassandra as the last tile placement by the user.
- The web socket service sends a message about the new tile to all connected clients.
In order to maintain strict consistency, all writing and reading in Cassandra was performed using QUORUM consistency level .
In fact, here we had a race, because of which users could place several tiles at a time. At stages 1-3, there was no blocking, so simultaneous attempts to draw tiles could be checked at the first stage and be drawn at the second. It seems that some users discovered this bug (or they used bots that neglected the limit on the frequency of sending requests) - and as a result, about 15,000 tiles were placed (~ 0.09% of the total).
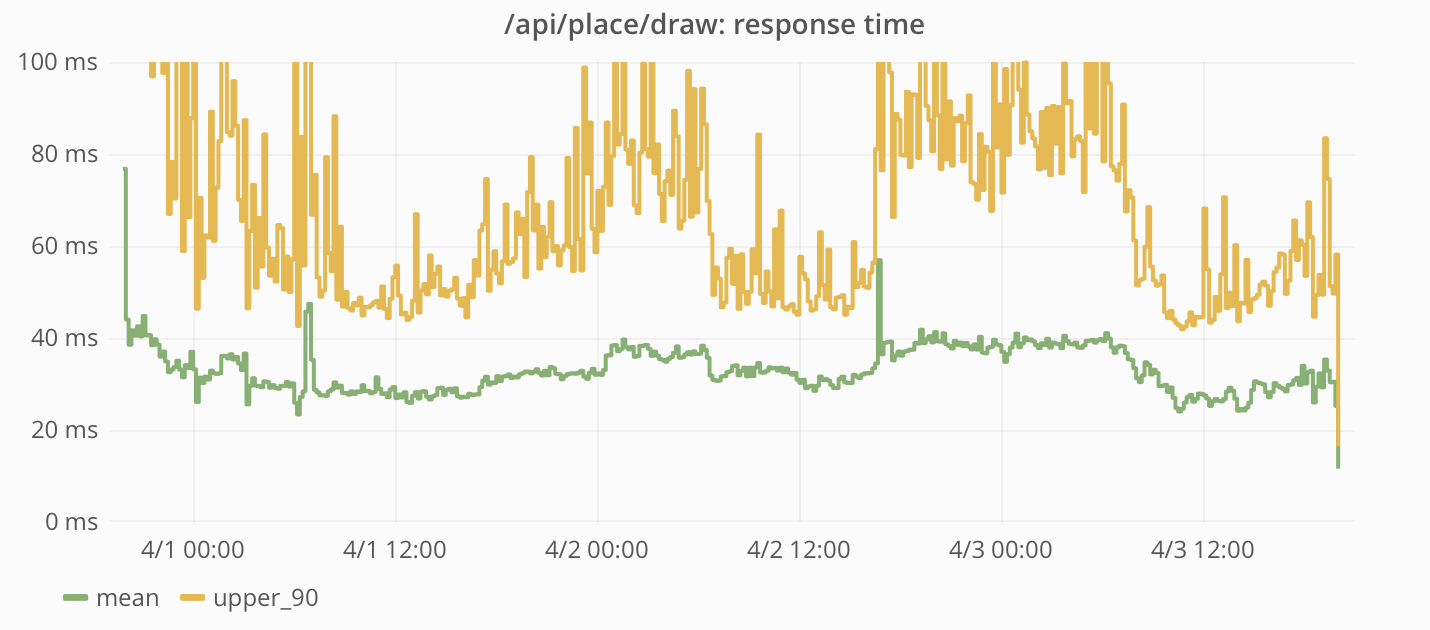
The frequency of requests and response times measured by the Reddit application:
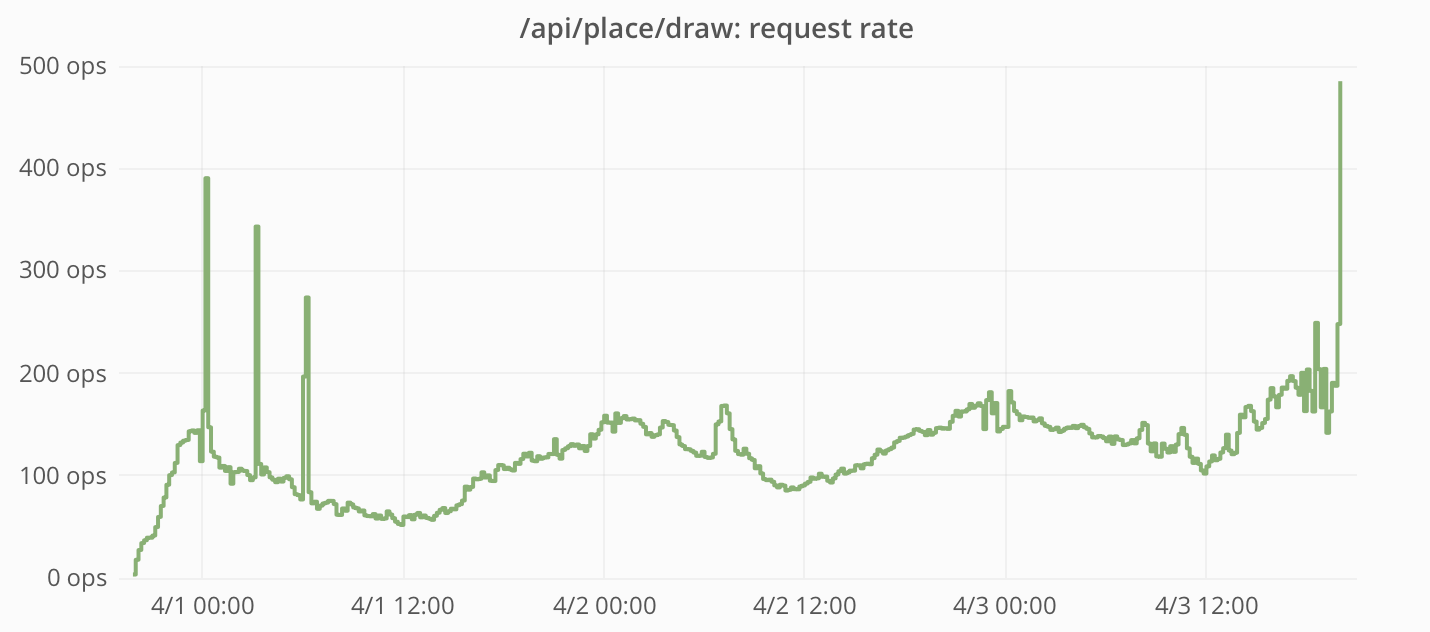
The peak frequency of placing tiles was almost 200 per second. This is below our calculated limit of 333 tiles / s (average value, provided that 100,000 users post their tiles every five minutes).
Get details on a specific tile
When requesting specific tiles, the data was read directly from Cassandra.
The frequency of requests and response times measured by the Reddit application:
This query has proven very popular. In addition to regular client requests, people wrote scripts to extract the entire board one tile at a time. Since this request was not cached in the CDN, all requests were serviced by the Reddit application.
The response time to these requests was rather short and kept at the same level during the whole existence of the project.
Web sockets
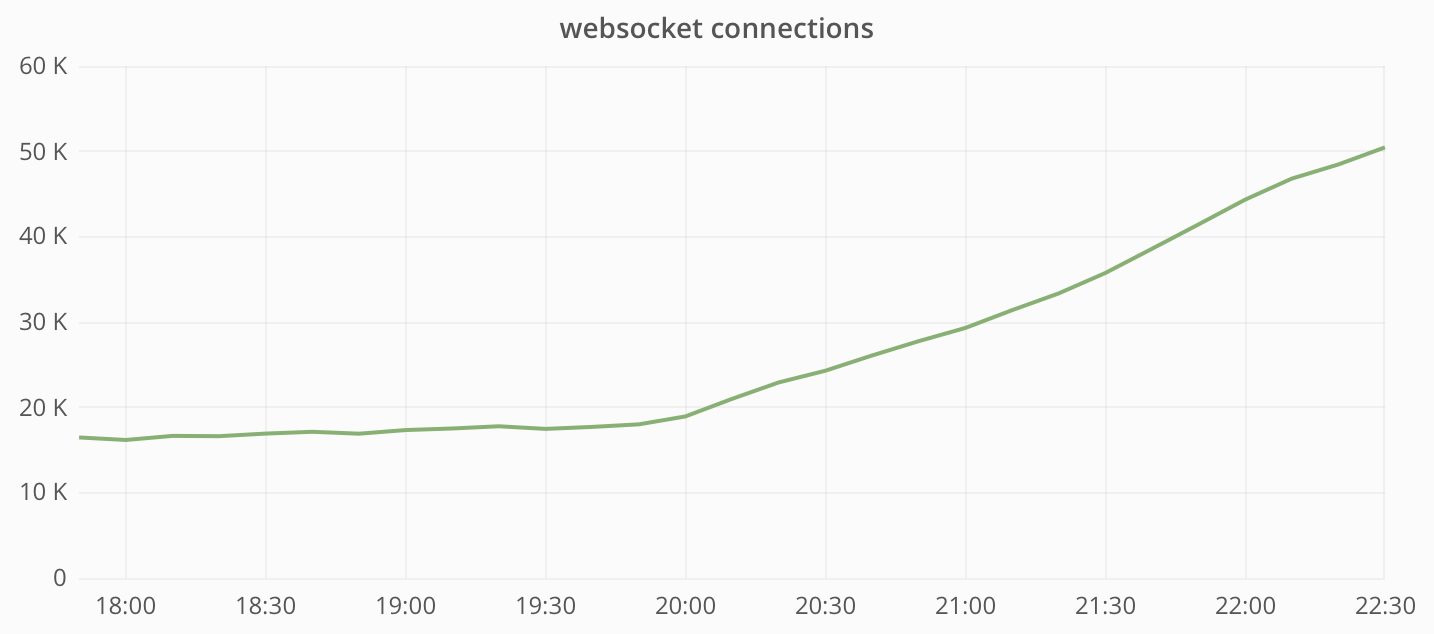
We do not have separate metrics showing how r / Place influenced the work of the web socket service. But we can estimate the values by comparing the data before the launch of the project and after its completion.
Total number of connections to the web service:

The base load before launching r / Place was about 20,000 connections, the peak being 100,000 connections. So at the peak we probably had about 80,000 users simultaneously connected to r / Place.
Bandwidth of a web socket service:

At the peak of the load on r / Place, the website service transmitted more than 4 Gbit / s (150 Mbit / s for each instance, a total of 24 instances).
Front-end: web and mobile clients
In the process of creating a frontend for Place, we had to solve many complex problems associated with cross-platform development. We wanted the project to work equally on all major platforms, including desktops and mobile devices on iOS and Android.
The user interface had three important functions:
- Display board status in real time.
- Allow users to interact with the board.
- Work on all platforms, including mobile applications.
The main interface object was the canvas, and the Canvas API was perfect for it. We used a <canvas> element of <canvas> size, and each tile was drawn as a single pixel.
Canvas drawing
Canvas was supposed to reflect the state of the board in real time. It was necessary to draw the entire board when loading the page and to draw the updates coming through the web sockets. The canvas element using the CanvasRenderingContext2D interface can be updated in three ways:
- Draw an existing image in canvas with
drawImage(). - Draw forms using different form rendering methods. For example,
fillRect()fills a rectangle with some color. - Construct an
ImageDataobject and draw it in a canvas usingputImageData().
The first option did not suit us, because we did not have a board in the form of a finished image. Options 2 and 3 remained. The easiest way was to update the individual tiles with fillRect() : when the update comes through the web socket, simply draw a 1x1 rectangle on the position (x, y). In general, the method worked, but was not very convenient for drawing the initial state of the board. The putImageData() method came up much better: we could define the color of each pixel in a single ImageData object and draw the entire canvas at a time.
Drawing the initial state of the board
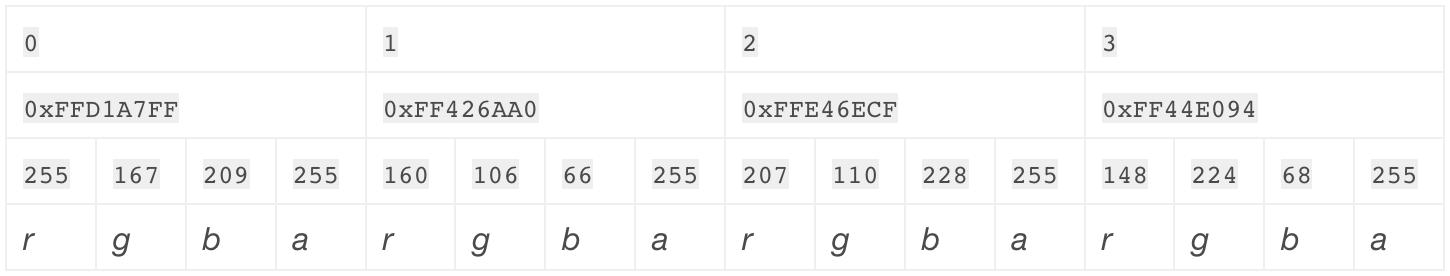
Using putImageData() requires determining the state of the board as Uint8ClampedArray , where each value is an eight-bit unsigned number in the range from 0 to 255. Each value represents a color channel (red, green, blue, alpha), and for each pixel you need four element in the array. For a 2x2 canvas, a 16-byte array is needed, in which the first four bytes represent the upper left pixel of the canvas, and the last four are the lower right.
This shows how the pixels of the canvas are related to their Uint8ClampedArray views:
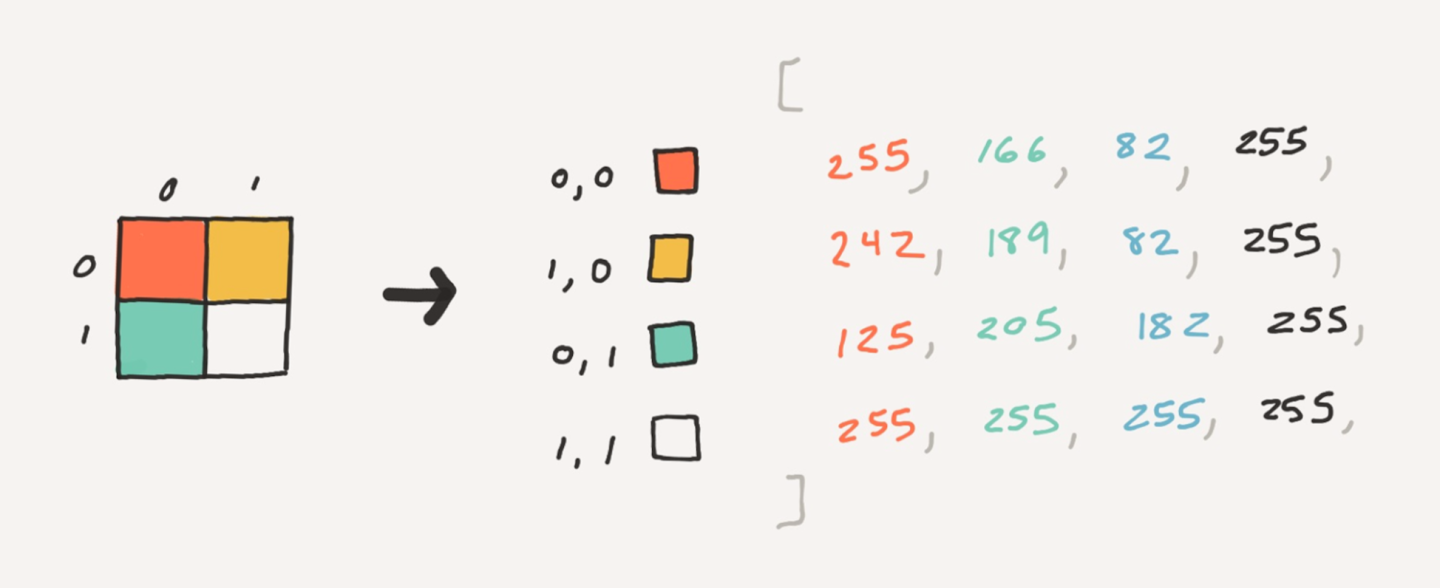
For the canvas of our project, we needed an array of four million bytes - 4 MB.
In the backend, the state of the board is stored as a four-bit bit field. Each color is represented by a number from 0 to 15, which allowed us to pack two pixels in each byte. To use it on a client device, you need to do three things:
- To transfer to the client binary data from our API.
- Unpack the data.
- Convert four-bit colors to 32-bit.
To transfer binary data, we used the Fetch API in those browsers that support it. And in those that do not support, they used XMLHttpRequest with a responseType that has the value “arraybuffer” .
The binary data received from the API contains two pixels in each byte. The smallest constructor TypedArray that we had, allows you to work with binary data in the form of single-byte units. But they are inconvenient to use on client devices, so we unpacked the data to make it easier to work with. The process is simple: we iterate over the packed data, pull out the bits and bits, and then copy them into separate bytes into another array.
Finally, four-bit colors needed to be converted to 32-bit.

The ImageData structure that we needed to use putImageData() requires that the final result be in the form of a Uint8ClampedArray with bytes encoding the color channels in the RGBA order. This means that we needed to do another unpacking, breaking each color into component channel bytes and putting them in the correct index. It's not very convenient to make four entries per pixel. But fortunately, there was another option.
TypedArray objects are essentially ArrayBuffer representations in the form of arrays. There is one nuance: multiple TypedArray instances can read and write to the same ArrayBuffer instance. Instead of writing four values to an eight-bit array, we can write one value to 32-bit! Using Uint32Array for writing, we were able to easily update tile colors by simply updating one array index. True, we had to save our color palette in reverse byte order (ABGR), so that the bytes automatically fall into the right places when read using Uint8ClampedArray .
Processing updates received via the web socket
The drawRect() method was well suited for drawing updates on individual pixels as they were received, but there was one weak point: large portions of updates coming at the same time could cause braking in browsers. And we understood that updates to the state of the board can come very often, so the problem had to be somehow solved.
Instead of immediately redrawing the canvas every time we receive an update via a web socket, we decided to make it so that web updates that come at the same time can be bundled and immediately drawn in a crowd. For this, two changes were made:
- Terminating the use of
drawRect()- we have found a convenient way to update many pixels at once withputImageData(). - Moving canvas rendering to the requestAnimationFrame loop.
Thanks to the transfer of the rendering to the animation loop, we were able to immediately record the web sock-update into the ArrayBuffer , while postponing the actual rendering. All website updates coming between frames (about 16 ms) were combined into packages and rendered simultaneously. Using requestAnimationFrame , if drawing took too much time (longer than 16 ms), it would only affect the refresh rate of the canvas (and would not degrade the performance of the entire browser).
Interaction with Canvas
It is important to note that the canvas were needed to make it easier for users to interact with the system. The main interaction scenario is placement of tiles on canvas.
But it would be extremely difficult to do accurate rendering of each pixel on a 1: 1 scale, and we would not avoid errors. So we needed a zoom (big!). In addition, users needed the ability to easily navigate the canvas, because it was too large for most screens (especially when using the zoom).
Zoom
Since users could place tiles once every five minutes, errors in placement would be especially unpleasant for them. It was necessary to realize a zoom of such a multiplicity, so that the tile would be large enough, and it could be easily placed in the right place. This was especially important on touchscreen devices.
We implemented a 40x zoom, that is, each tile had a size of 40x40. We wrapped the <canvas> in a <div> , to which we applied the CSS transform: scale(40, 40) . It was a great solution for placing tiles, but made it difficult to view the board (especially on small screens), so we made a two-step zoom: 40x - for drawing tiles, 4x - for viewing the board.
Using CSS to scale the canvas made it easy to separate the code responsible for drawing the board from the code responsible for scaling. But this approach had several drawbacks. When scaling a picture (canvas), browsers by default use image smoothing algorithms. In some cases, it does not cause inconvenience, but pixel graphics simply destroys it, turning it into soapy porridge. The good news is the CSS image-rendering property, with which we were able to “ask” browsers not to apply anti-aliasing. The bad news is that not all browsers have full support for this property.
Blur at zoom:

For such browsers, it was necessary to find another way to scale. I mentioned above that there are three ways to draw in canvas. The first, drawImage() , supports the rendering of an existing image or another canvas. It also supports image scaling when drawing (with increasing or decreasing). And although the increase has the same blurring problems as the above-mentioned CSS, they can be solved in a more universal way from the point of view of browser support by removing the CanvasRenderingContext2D.imageSmoothingEnabled flag.
So, we solved the problem with blur of canvas, adding another step to the rendering process. To do this, we have made another <canvas> element that coincides in size and position with the container element (that is, with the visible area of the board). After redrawing the canvas with drawImage() , the visible part of it is drawn at the desired scale in the new canvas. Since this additional step slightly increases the rendering cost, we only used it in browsers that do not support the image-rendering CSS property.
Canvas moving
Canvas is a rather large image, especially in approximate form, so we needed to provide the ability to move around it. To adjust the position of the canvas on the screen, we applied the same approach as in the case of scaling: we wrapped the <canvas> in another <div> , to which we applied the CSS transform: translate(x, y) . Thanks to a separate div, we were able to easily manage the order of transformations to the canvas, which was necessary to prevent the “camera” from moving when the zoom was changed.
As a result, we have provided support for various ways to adjust the position of the “camera”:
- Click and drag (click-and-drag, or touch-to-drag);
- "Click to move" (click-to-move);
- keyboard navigation.
Each of these methods is implemented differently.
"Click and drag"
This is the primary way to navigate. We saved the x and y coordinates of the mousedown event. For each of these events, we found the offset position of the mouse cursor relative to the initial position, and then added this offset to the existing displacement of the canvas. The camera position was immediately updated, so the navigation was very responsive.
"Click to move"
When clicking on a tile, it was placed in the center of the screen. To implement this mechanism, we had to track the distance between the mousedown and mouseup events in order to separate the “clicks” from the “moves”. If the distance the mouse moved was not enough to be considered a “move”, the position of the “camera” changed based on the difference between the position of the mouse and the point in the center of the screen. Unlike the previous navigation method, the “camera” position was updated using the smoothness function. Instead of immediately setting a new position, we saved it as a “target” one. Inside the animation loop (the same one that was used to redraw the canvas), the current position of the “camera” was moved closer to the target using the smoothness function. This allowed to get rid of the effect of too sharp movement.
Keyboard navigation
You could navigate the canvas using the keyboard arrows or WASD. These keys controlled the internal motion vector. If none of the keys were pressed, then the default vector had coordinates (0, 0). Pressing any of the navigation keys adds 1 to x or y. For example, if you press "right" and "up", then the coordinates of the vector will be (1, -1). Then this vector was used inside the animation loop to move the “camera”.
In the process of animation, the speed of movement was calculated depending on the level of approximation using the following formula:
movementSpeed = maxZoom / currentZoom * speedMultiplier When the zoom was turned off, it was faster and much more natural to control the buttons.
Then the motion vector was normalized, multiplied by the speed of movement and applied to the current position of the “camera”. Normalization was used so that the speed of the diagonal and orthogonal displacements coincided. Finally, we applied the smoothness function to changes in the motion vector itself. , «» .
iOS- Android- . -, , . -, , OAuth: WebView . OAuth JS- WebView. . API:
r.place.injectHeaders({'Authorization': 'Bearer <access token>'}); iOS , . WebView, . , iOS 8 JS-:
webkit.messageHandlers.tilePlacedHandler.postMessage(this.cooldown / 1000); .

-
. , . . . , , - . ?
. r/Place :

. , . , . , , :

, , . «» ? , Place , . , , Live- . , , , . .
, : – . .
:

, . , production- RabbitMQ, -, , reddit.com. . .
, . - , , Rabbit Diamond collector . , , -, , , Rabbit, . – .
, :
$ cat s****y_diamond.sh #!/bin/bash /usr/sbin/rabbitmqctl list_queues | /usr/bin/awk '$2~/[0-9]/{print "servers.foo.bar.rabbit.rabbitmq.queues." $1 ".messages " $2 " " systime()}' | /bin/grep -v 'amq.gen' | /bin/nc 10.1.2.3 2013 , - , : . - .
, :

. r/place/new:
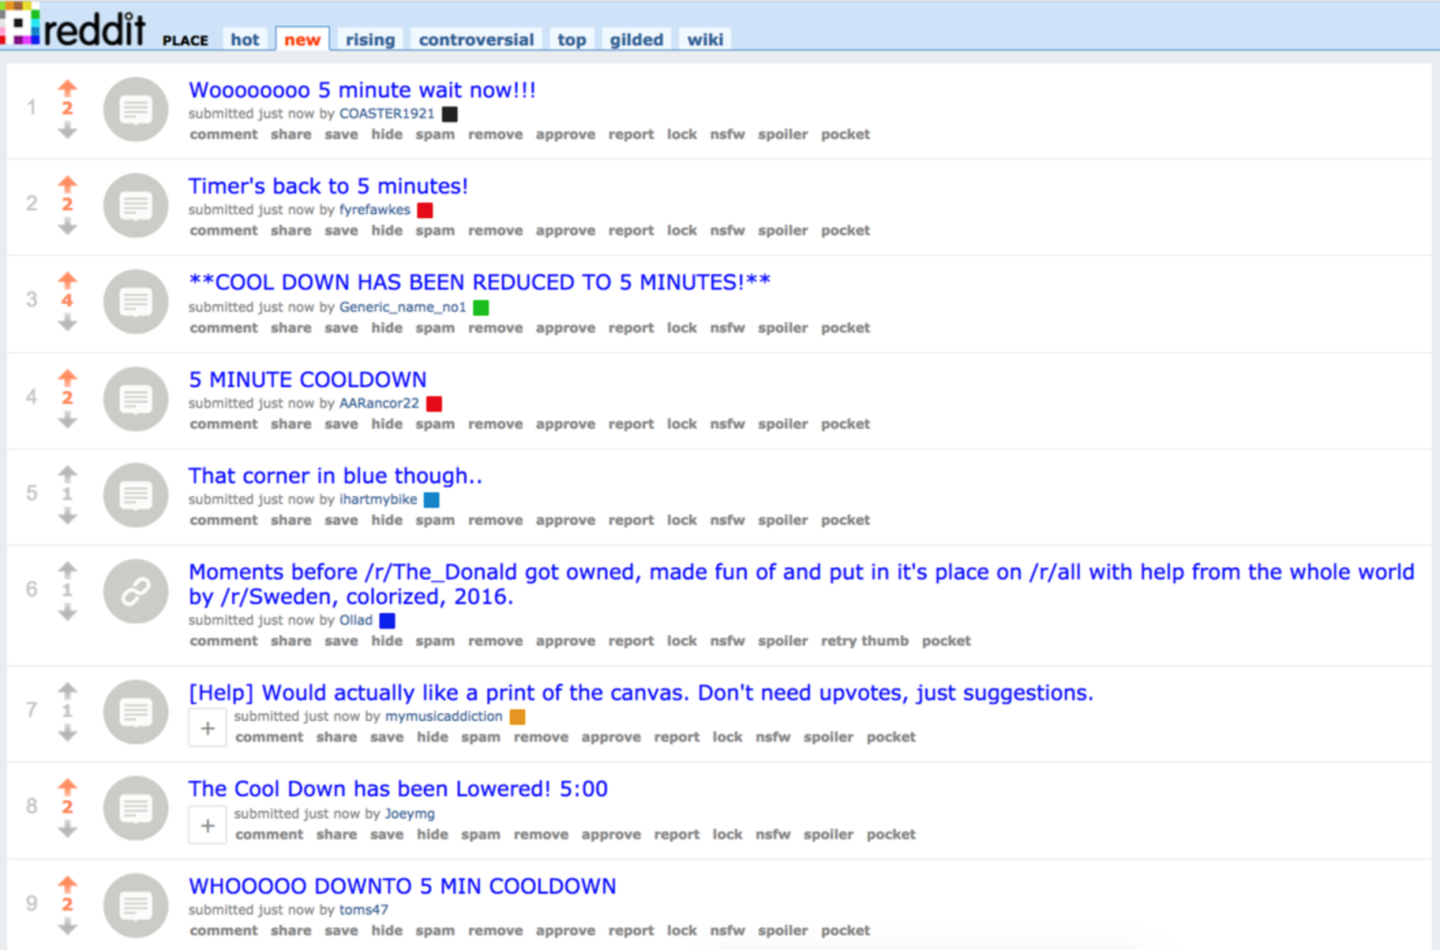
, .
. , . , , . . . - , , , .
Place, , , « » . . , Fastly.
-
r/Place , . u/gooeyblob, u/egonkasper, u/eggplanticarus, u/spladug, u/thephilthe, u/d3fect , .
')
Source: https://habr.com/ru/post/326984/
All Articles