Report of the Information Security Monitoring Center for the first quarter of 2017
In the report, we collected summary statistics on information security events and incidents recorded by our corporate Monitoring Center recorded in the first quarter of 2017.

Since we have a large enough data set:
')
then the statistics will be applicable for any medium and large organization.
The data in the report is what we see, and you can “figure out” the picture on your information security system.
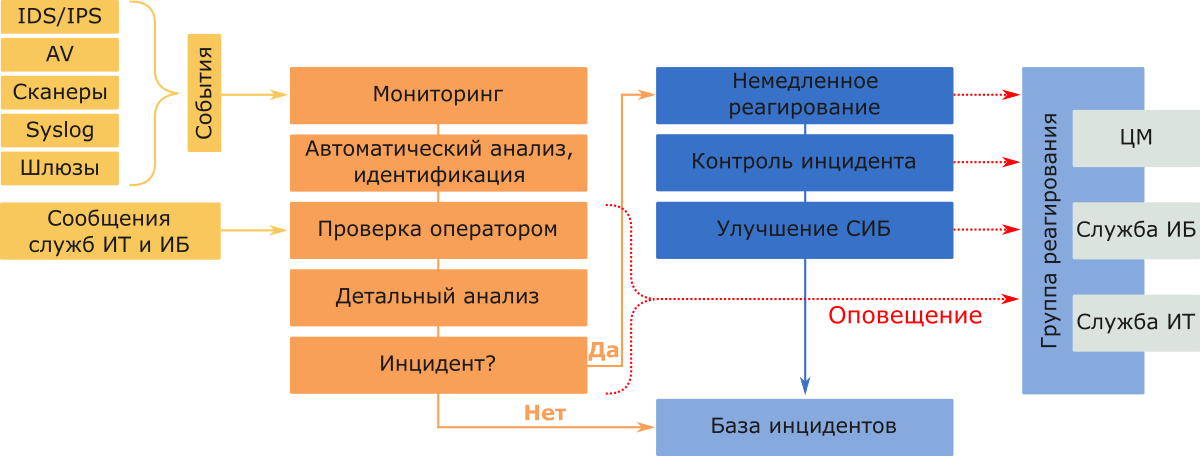
The Monitoring Center (CM) of the Advanced Monitoring company is a service that processes information security events coming from connected systems, determines whether a sequence of events is an incident or not, and helps employees of the monitoring organization to respond to incidents.
It works like this:
With this report, we close the first year of regular publications on information security events and incidents detected by the Monitoring Center.
During this year, the rules for identifying and recording events have changed (some events are “glued together” into one) and the number of nodes in the monitoring, so it will not be entirely correct to directly compare the number of events and incidents now and a year ago. Nevertheless, all statistics for previous periods is available in previous reports (pdf from our site).
As part of this report:
The event sources are network and host IDS, network devices, security scanners, anti-virus solutions and honeypots.
For internal processing, we classify incidents according to the resources affected.
An analyst at the Monitoring Center arbitrarily determines the degree of criticality if he believes that an incident can lead to serious negative consequences.
From January 1 to March 31, 2017, employees of the Monitoring Center monitored the information systems of several organizations with a total number of connected nodes of about 12,000 (workstations, web, mail, file storage, VPN, etc.).
For three months, sensors recorded and analyzed 137,873,416 information security events and identified 98 incidents .
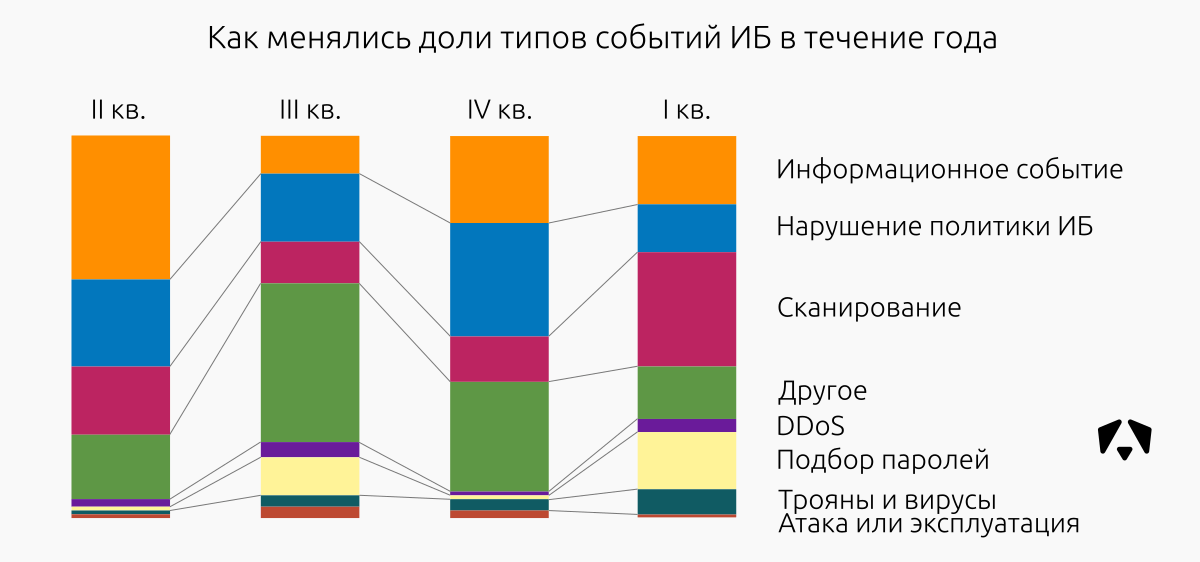
The most significant change from the previous period was the increase in the share of events related to the scanning of information resources and attempts to select passwords for various information systems. Also slightly increased the activity of malware.
The figure above shows how the ratio of types of information security events has changed. To estimate the size of the incoming data, it is worth mentioning that the “Scanning” in the first quarter of 2017 is 30% and
41,646,524 recorded events; a "Passwords Selection" - 15% and almost 21 million events.
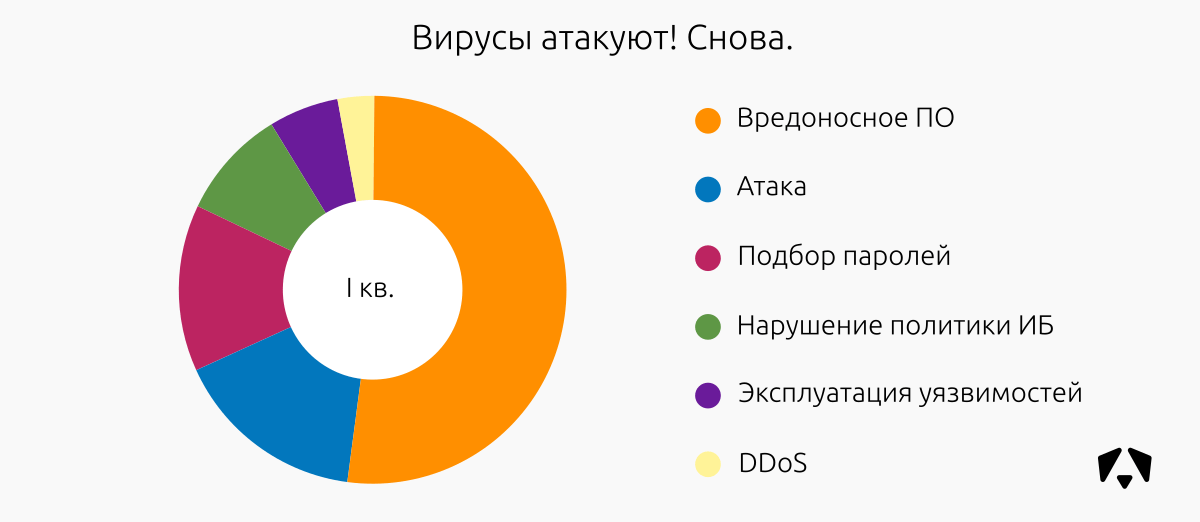
Among the 98 incidents identified:
The most relevant and critical of the identified are attacks related to attempts to obtain unauthorized access to the resources of organizations.
One interesting observation. Employees often use corporate resources for their personal purposes: from printing a report to a child in school to accessing a personal Internet bank. Now we are faced with the fact that the staff of minyut bitcoin and ethereum on the computing resources of the organization. Such incidents fell into the "Violation of the policy."
For the previous 4th quarter of 2016, the Monitoring Center recorded 21,788,201 IS events and 53 incidents .
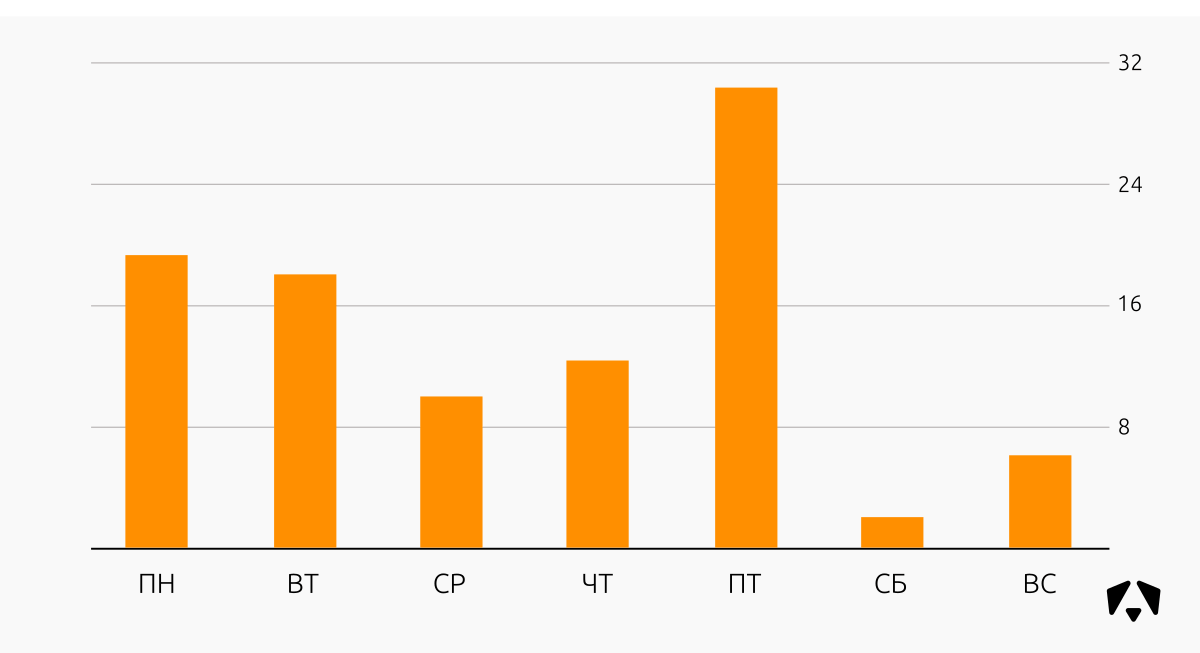
Distribution of information security incidents relative to the days of the week in the first quarter of 2017:
Distribution of information security incidents in the first quarter of 2017:
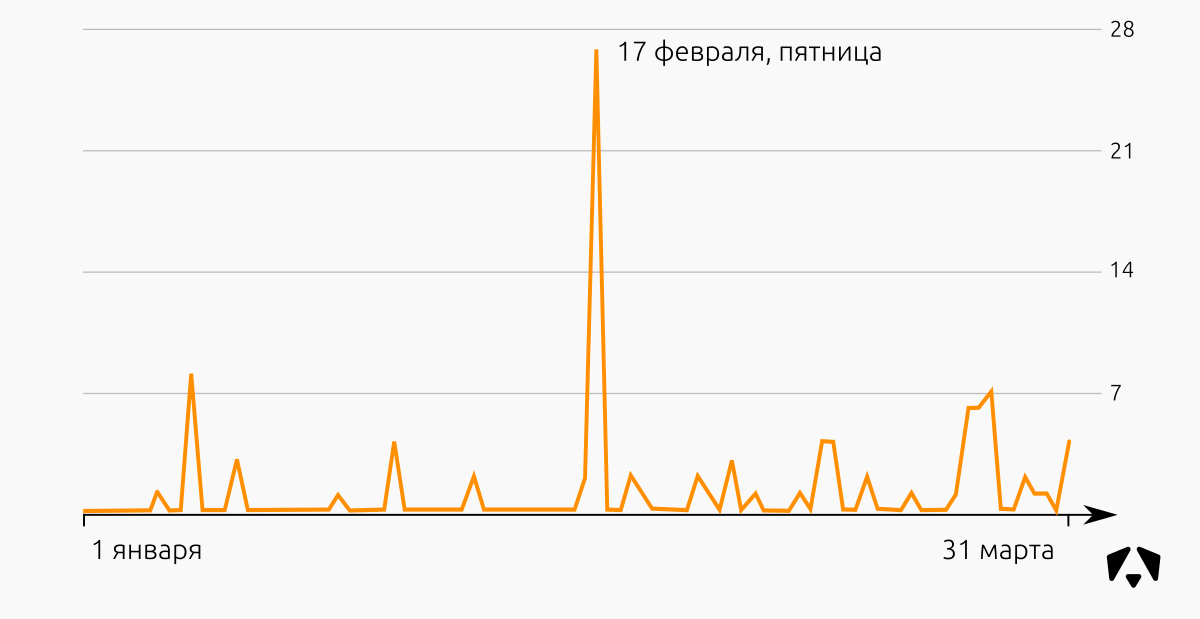
If you look closely at the two graphs above, you can see that the “Friday” peak of incidents falls on a specific day - February 17th. On this day, events from the network of a fairly large organization began to be received and processed in our Monitoring Center, respectively, and immediately the malicious activity that was already present on this network became visible and was recorded in the statistics. Gradually, as these incidents responded, the number of new incidents recorded decreased.
If we exclude this particular day, then most of the incidents occur at the beginning of the week. They are associated primarily with the activity of malicious software in the workplace of employees. Such incidents do not bear serious negative consequences for controlled information systems, but administrators spend time on anti-virus checks, and users cannot work at this time fully.
The sources of attacks in this case are IP addresses from which network security tools recorded negative actions.
The graph shows the location of the first hundred IP addresses by the number of registered events. Most of these addresses are located in Russia, the USA and Germany, although, of course, it cannot be argued that the attackers were from these countries.
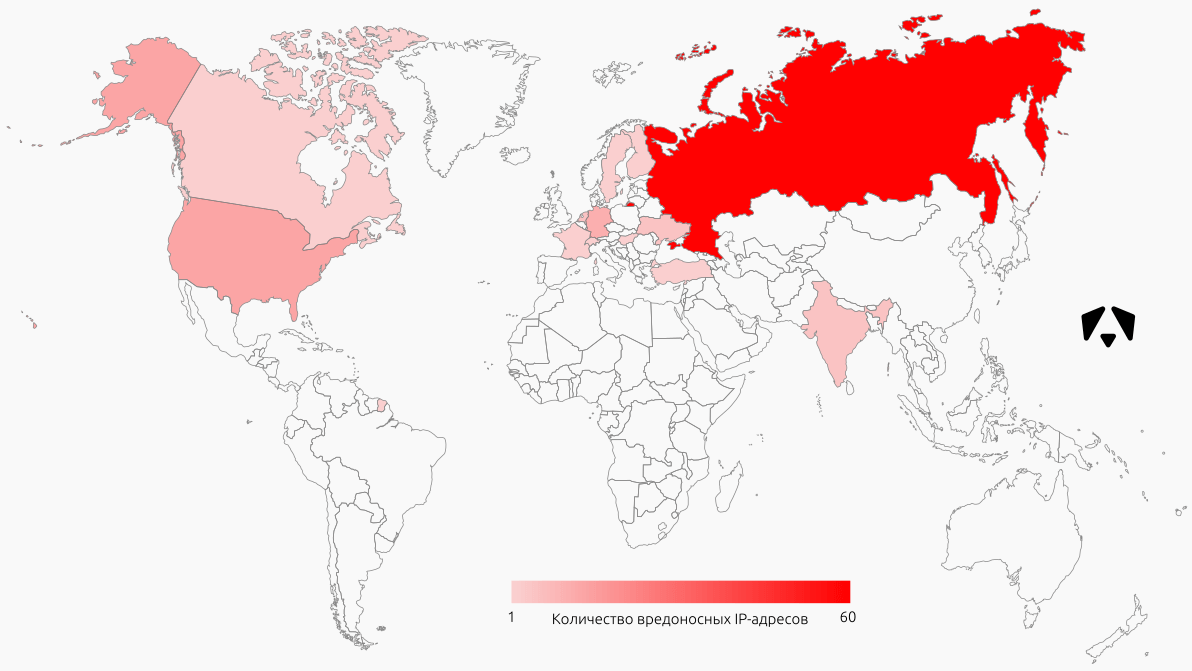
There is one interesting feature. In the second and third quarters of 2016, China was among the leaders in the number of IP addresses from which attacks were carried out. In the fourth quarter of 2016 and in the first quarter of 2017, the situation changed dramatically - we did not record any malicious activity from there. We assume that the attackers switched to Russian proxies.
The situation on the objectives of the attacks has changed not fundamentally: the attackers were most active in relation to user jobs. This segment accounts for more than half of all incidents.
Thanks to Maxim Baymaxx and Alina Eris for the data provided for the report. If they answer you in the comments - they can be trusted.
→ Life without SDL. Winter 2017
Since we have a large enough data set:
')
- 12,000 nodes on monitoring;
- 137,873,416 information security events;
- 98 confirmed incidents;
then the statistics will be applicable for any medium and large organization.
The data in the report is what we see, and you can “figure out” the picture on your information security system.
The Monitoring Center (CM) of the Advanced Monitoring company is a service that processes information security events coming from connected systems, determines whether a sequence of events is an incident or not, and helps employees of the monitoring organization to respond to incidents.
It works like this:
With this report, we close the first year of regular publications on information security events and incidents detected by the Monitoring Center.
During this year, the rules for identifying and recording events have changed (some events are “glued together” into one) and the number of nodes in the monitoring, so it will not be entirely correct to directly compare the number of events and incidents now and a year ago. Nevertheless, all statistics for previous periods is available in previous reports (pdf from our site).
- Report for the II quarter of 2016 .
- Report for the III quarter of 2016 .
- Report for the IV quarter of 2016 .
What and how we consider
As part of this report:
- An information security event is an identified occurrence of a certain state of a system, service, or network indicating a potential violation of the information security policy or the failure of protective measures, or the occurrence of a previously unknown situation that may be related to security.
- An information security incident is the occurrence of one or more unwanted or unexpected security events that are associated with a significant likelihood of business operations being compromised and creating an information security threat.
The event sources are network and host IDS, network devices, security scanners, anti-virus solutions and honeypots.
For internal processing, we classify incidents according to the resources affected.
| High criticality | Incidents related to key server segment resources or critical user segment resources (resources that handle critical information from a business, financial, or legal point of view). |
| Average criticality | Incidents related to non-critical server segment resources. |
| Low criticality | Incidents related to non-critical resources of the user segment (ordinary user). |
An analyst at the Monitoring Center arbitrarily determines the degree of criticality if he believes that an incident can lead to serious negative consequences.
Monitoring results
From January 1 to March 31, 2017, employees of the Monitoring Center monitored the information systems of several organizations with a total number of connected nodes of about 12,000 (workstations, web, mail, file storage, VPN, etc.).
For three months, sensors recorded and analyzed 137,873,416 information security events and identified 98 incidents .
The most significant change from the previous period was the increase in the share of events related to the scanning of information resources and attempts to select passwords for various information systems. Also slightly increased the activity of malware.
The figure above shows how the ratio of types of information security events has changed. To estimate the size of the incoming data, it is worth mentioning that the “Scanning” in the first quarter of 2017 is 30% and
41,646,524 recorded events; a "Passwords Selection" - 15% and almost 21 million events.
Event Type Descriptions
“Informational event” - informational events that may be useful in the analysis of an incident.
“Violation of the IS policy” - events that indicate actions that allegedly violate the requirements of the IS Policy of a controlled organization.
“Attack or exploitation” - events that indicate attempts to remotely execute a code or exploit vulnerabilities in controlled resources.
"Scan" - events that indicate the study of the network before attempting an attack.
“Password Selection” - events that indicate attempts to gain access to monitored resources by selecting authentication data.
"Trojans and viruses" - events that indicate the fact of infection of controlled resources with viruses or malware activity.
“DDoS” - events that indicate attempts to carry out distributed denial of service attacks.
“Other” - events which by their nature cannot be attributed to one of the classes listed above.
Among the 98 incidents identified:
| Incident class | High criticality | Average criticality | Low criticality | Total incidents | Share of incidents |
|---|---|---|---|---|---|
| Malicious software | sixteen | 20 | 15 | 51 | 52% |
| Attack | 9 | five | one | 15 | sixteen% |
| Password Selection | eleven | 3 | 14 | 14% | |
| Violation of information security policy | 2 | four | 3 | 9 | 9% |
| Vulnerability Exploitation | 3 | 3 | 6 | 6% | |
| DDoS | 3 | 3 | 3% | ||
| Total: | 98 | 100.0% |
| The share of incidents,% | ||||
|---|---|---|---|---|
| Incident class | IIQ 2016 | Q3 2016 | IVQ 2016 | Iq 2017 |
| Malicious software | 43.5 | 42,8 | 51 | 52 |
| DDoS | 8.7 | 14.3 | 1.9 | 3 |
| Violation of information security policy | 30.4 | 14.3 | 13.2 | 9 |
| Password Selection | 17.4 | 23.8 | 13.2 | 14 |
| Attack | 11.3 | sixteen | ||
| Vulnerability Exploitation | 4.8 | 9.4 | 6 | |
The most relevant and critical of the identified are attacks related to attempts to obtain unauthorized access to the resources of organizations.
One interesting observation. Employees often use corporate resources for their personal purposes: from printing a report to a child in school to accessing a personal Internet bank. Now we are faced with the fact that the staff of minyut bitcoin and ethereum on the computing resources of the organization. Such incidents fell into the "Violation of the policy."
For the previous 4th quarter of 2016, the Monitoring Center recorded 21,788,201 IS events and 53 incidents .
Distribution of information security incidents relative to the days of the week in the first quarter of 2017:
Distribution of information security incidents in the first quarter of 2017:
If you look closely at the two graphs above, you can see that the “Friday” peak of incidents falls on a specific day - February 17th. On this day, events from the network of a fairly large organization began to be received and processed in our Monitoring Center, respectively, and immediately the malicious activity that was already present on this network became visible and was recorded in the statistics. Gradually, as these incidents responded, the number of new incidents recorded decreased.
If we exclude this particular day, then most of the incidents occur at the beginning of the week. They are associated primarily with the activity of malicious software in the workplace of employees. Such incidents do not bear serious negative consequences for controlled information systems, but administrators spend time on anti-virus checks, and users cannot work at this time fully.
TOP sources
The sources of attacks in this case are IP addresses from which network security tools recorded negative actions.
The graph shows the location of the first hundred IP addresses by the number of registered events. Most of these addresses are located in Russia, the USA and Germany, although, of course, it cannot be argued that the attackers were from these countries.
There is one interesting feature. In the second and third quarters of 2016, China was among the leaders in the number of IP addresses from which attacks were carried out. In the fourth quarter of 2016 and in the first quarter of 2017, the situation changed dramatically - we did not record any malicious activity from there. We assume that the attackers switched to Russian proxies.
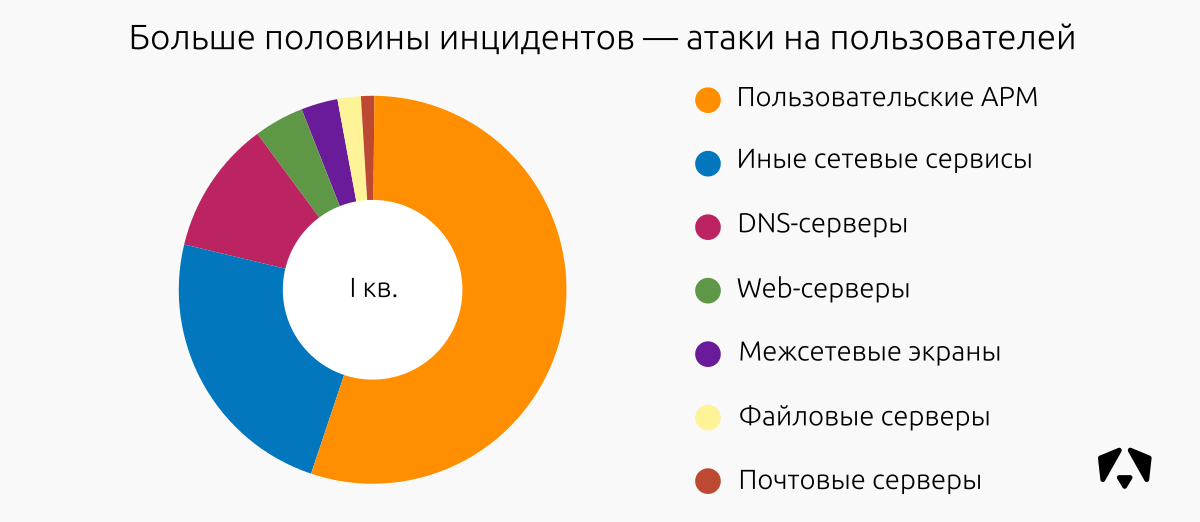
TOP incident-prone segments
The situation on the objectives of the attacks has changed not fundamentally: the attackers were most active in relation to user jobs. This segment accounts for more than half of all incidents.
The most frequently used techniques for influencing systems that caused the IS incident
| Threat | Impact Technique |
|---|---|
| Adware | Infection of the final system, transmission of information about the user to the command server, display of targeted advertising. |
| Brute force | Attempts to select authentication information for access to services and resources of controlled organizations - RDP, SSH, SMB, DB, Web. |
| Violation of the IS policy | Violation by users / administrators of monitored resources of the requirements of IS policies regarding the use of outdated versions or untrusted software. This software can be used by an attacker to attack by exploiting a vulnerability. Also use the resources of the company for their own benefits (mining bitcoin / ethereum). Using torrent trackers. |
| Virus software | Infecting the final system, spreading the virus over the local network, shutting down / blocking services that prevent the spread of the virus, attempting other attacks within the network to obtain critical information and transmitting to command servers. |
| DDoS using organization resources | DDoS Amplification is a technique of replacing your address with the address of the victim and generating small requests for open services. The service returns to the request a response several dozen times more to the “sender” address. Using a large amount of resources from various organizations, the attacker performs a DDoS attack on the victim. |
| Attempts to exploit vulnerabilities | Using flaws in the system for the integrity and violation of the correct operation of the system. Vulnerability can be the result of programming errors, deficiencies in the design of the system, unreliable passwords, viruses and other malicious programs, script and SQL injections. Some vulnerabilities are known only theoretically, while others are actively used and have known exploits. |
| Deface WEB-resources | A hacker attack, in which pages and important information are replaced with others, usually of the defiant type (advertising, warning, threat, propaganda) Often, access to the rest of the site is blocked, or the old content is deleted. |
Thanks to Maxim Baymaxx and Alina Eris for the data provided for the report. If they answer you in the comments - they can be trusted.
Other blog articles
→ Life without SDL. Winter 2017
Source: https://habr.com/ru/post/326810/
All Articles