Super Strengths WinDbg for .NET Developers
Continuing the series of publications on the reports at conferences, we stopped at the best report of DotNext 2016 Moscow, in which Sasha goldshtn Goldstein talks about the capabilities of WinDbg for debugging .NET applications. This really powerful tool allows you to solve problems that the Visual Studio built-in debugger cannot handle.
Especially this material will be useful to those who find it difficult to watch the reports in English, since the transcript is translated into great and mighty!
Windbg is considered to be a very complex tool that only hardcore C ++ developers can use. However, in this report, I will show you when it can be useful for .NET developers and where WinDbg can be used to debug .NET applications when solving really complex tasks.
')
Some of you have already used WinDbg before, but I hope you learn something new from this report. And to those who have not met with WinDbg, I hope to show what exactly this tool can do for you.
The Visual Studio debugger, which most of us use every day, cannot cope with approximately 90% of the material that I am going to show. That is why I show you all this with WinDbg (and not at all because it is such a fun tool). It does have a power that Visual Studio does not have.
Can Visual Studio be called a powerful debugger?
He is not bad. But this is a toy for people who like to use the mouse or hotkeys. Compared to really powerful debuggers like JDB with IDEA, DDD or WinDbg, Visual Studio is a kind of toy. It no longer contains macros, as in Visual Studio 2012, so it is very difficult to extend the debugger with your own scripts; there are virtually no extensions for the debugger mechanism itself. In addition, Visual Studio is great if you have the source code. But if you don't have the source code for a particular thing, it will be much more difficult to do something. You can hardly do anything.
Therefore, I like Visual Studio, but there are a number of cases when a more powerful tool is needed.
Probably, some of you saw the original of this diagram on Reddit in the edition for Linux distributions.
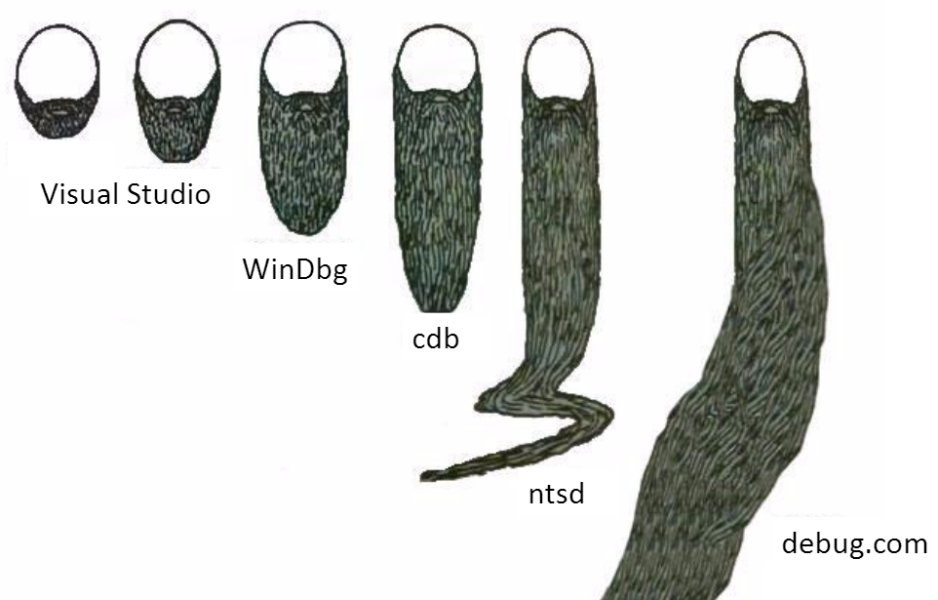
Here, Visual Studio is the shortest beard. Real geeks use WinDbg, cdb, which is the console version of WinDbg, and so on. In other words, you can always find hardcore to learn.
So let's take a look at some of the things that first make WinDbg a little easier to use.
One of the reasons why WinDbg is so scary is the need to memorize a huge number of commands. There are several menus and shortcuts, but more often you have to type a lot of text commands manually.
However, WinDbg has a

You can navigate the menu with the mouse, running useful commands. In one of my repositories there is an example of a file of an interactive tree of useful commands grouped into categories. Such a menu makes it a little easier to work with WinDbg for beginners.
I assume that many do not like WinDbg also because the output of commands is so terrible. And almost always have to use copy-paste - take the result of the execution of one command and transfer it to another team.
For those who don’t like it, there is an option that has been enabled for a long time by default in the WinDbg versions called DML (DML is a debugger markup language; I’ll show you later). Thanks to this option, in recent versions of the debugger, the output of the commands has links. Just click on the link to get something else.
In the example below, I ran a command called

The command output has links that I can click on. For example, if I click on the link next to the EEClass field, I’ll get this:

The link runs another command that displays information about the type. As you can see at the bottom of the screenshot, there is a Field, Type and additional information about this field. And again there are links. If you click on them, get more information and so on. When you do not remember all the commands, studying the results of the team’s work will be more useful if you have this toolkit.
Another feature that scares in WinDbg is that some simple things require you to enter a large amount of text. But there is another useful thing that many people don’t know about: you can run WinDbg, execute several commands at once, and at the end just exit (I’ll show you a few examples). In essence, WinDbg has the -c option, which takes the command line.
This feature is easier to demonstrate live using the example of a dump file of a process that failed.
In the folder C: \ temp I have saved several dump files. I also have WinDbg and cdb - as I said, this is the console version of WinDbg. I will open with WinDbg (cdb) one of the dump files.
The main thing - do not forget to close the file and exit at the end.
Here we have some basic automation of the debugger: I can start the debugger, analyze the dump file, put all this into a log file and exit. And these actions are repeatable - they can be performed in batch mode.
As a result, we get information about what happened in the dump. At the end of the output contains information about the response, the call stack and other useful details.
One more example. Here I ran

There is also information about the operating system, CLR version - in general, a lot of useful things.
Again, an example is a method that I often use in searching for memory leaks. When you have a memory leak, it is clear that the process is getting bigger and bigger. And you need to periodically connect to it, and then disconnect. Here's how to do this with WinDbg.
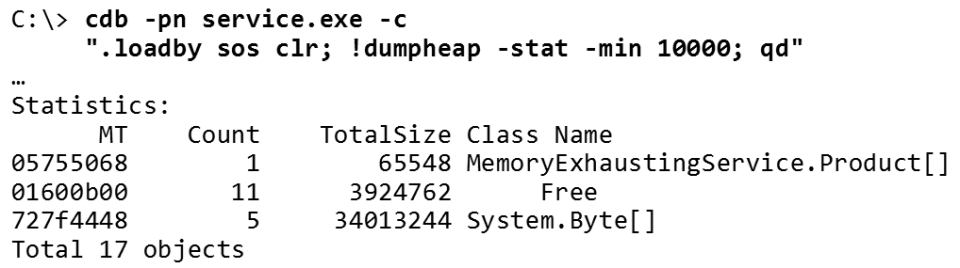
I run cdb (because I like it more) with the
After running this command, WinDbg connects to the process, displays the top objects in a heap of more than 10,000 bytes in size and disconnects from the process. In other words, this is an almost instant way to find out what is happening with memory. The same can be run in batch mode. Good luck to those who would like to do something similar in Visual Studio.
I hope that the above examples of automation prove that when you have a powerful debugger, you can run it automatically, write the script and use it repeatedly. But to really take advantage of the reusability, you need to understand how the scripting language works - the most difficult and “terrible” part of WinDbg.
WinDbg has a built-in scripting language, but this language has never been purposefully developed. It is not like C #, which is designed by a separate committee. This is a language that appeared gradually, someone added something to it, someone else corrected it. So it turned out that we have.
Let's take a look at this script (there are many more examples, there are relevant tutorials, but we will not turn this conversation into a training course on scripts in WinDbg).
Here, the first line initializes the
Whenever we hit a breakpoint (when we call this function), I execute the command inside quotes: I increase the
Then I entered
In other words, we set a breakpoint. Each breakpoint increases a variable by the number of bytes allocated. When I need to, I simply output the value of this variable, getting information about how much memory has been allocated.
The general approach, which is to put a breakpoint somewhere and do something for you, is extremely effective. In Visual Studio, many use breakpoints to simply stop the debugger. That's great, I do that too. But the real power of the breakpoint is that it can work for you (and not you at it).
Here are a couple of examples of this.
Let's say I have an application that creates files, but I don't know where these files come from. The application continues to create files, but does not delete them, but blocks them. Thus, while the application is running, I cannot delete these files. Surely many were faced with a similar situation.
Suppose I want to find out where these files come from. There are several ways to do this. The easiest is to add a breakpoint. Let's put a breakpoint where we create the files, and see where they come from.
The Windows API has two main functions for opening files:
Whenever I call one of these functions, I display the name of the file being opened.
Here
Next, I type the file name and three dashes. The
Suppose my application complains about missing files — that a file cannot be opened. But it does not tell me why and where. All I get is a stupid “can't open file” error message or something like that. This happens quite often.
Just put a breakpoint, though a little more complicated. It should reveal that an error occurred (I could not open the file). To do this, we put it in
So, we place breakpoint in
Again the debugger works for me, and not vice versa. I'm not trying to find in my code all the places where I could open the file. I just say to the debugger: "Let me know when the opening of the file fails."
Here is a real example from StackOverflow.
What a long description of the problem! This guy is trying to understand something. And at the end he asks the following question: “This definition raises the question: who then calls VirtualAlloc? Is this a heap or .NET runtime? ”
I think you know how to handle this task.
We set a breakpoint in
So, in this example, you see: I allocate virtual memory from the garbage collector. On the
The technique of placing a breakpoint anywhere with subsequent processing is perhaps the most important thing I give in this report. This is an incredibly powerful tool that simply does not exist in Visual Studio. Visual Studio is good when you have the source code into which you want to insert a breakpoint. But when you have to work with custom actions, conditions, etc., in Visual Studio you will find only basic support. With WinDbg you can do much more! WinDbg is also much better if you do not have the source code into which you want to insert a breakpoint (for example, if you plan to put it in Windows API calls or some internal CLR functions). I can't say that WinDbg is very friendly, but it is definitely very powerful.
Switch to another example. Suppose you have this huge collection of objects in which there is one bad object. Why is the object bad? For example, it contains the character a with a small dot breaking the encoding. I want to find this “broken” object.

Not very nice, but it works. Toward the end of the report I will show another way to solve this problem. So, first we will find where the class is
This is the class I'm looking for -
I'm interested in the

All that is left to do is to find
I will not rewrite the line once again - this is unnecessary, but I will mention a few key points:
In the last example (before moving on to extensions), I will show some cool commands.
There is a mysterious team
For example, I was curious about what the garbage collector does during
As a result, you get this beautiful tree (I have limited the depth to unity) - you get all the functions called by

Thus, you can see the most “expensive” functions in terms of the number of instructions:
It looks like a profiler right inside the debugger. It is important to emphasize that profiling goes step by step according to the instructions of the program. It is very slow, i.e. for profiling as such is not suitable. But it is very good to understand what is happening in a particular method.
In this part of the conversation, I'll show you a couple of useful extensions.
And I'll start with an extension that allows you to write scripts for the debugger using something less awful.

Not as bad as the script you saw before. This is a pretty nice extension, called PyKD. What does PyKD do? It allows you to run Python to automate WinDbg - i.e. run WinDbg commands, analyze output, use Python tools with WinDbg.
The example above is not very interesting. Here I’m just trying to fix the stack if it’s broken. However, the idea is that you have a Python API for most things that WinDbg can do. One way not to write in the terrible language WinDbg is to use Python.
I have, it seems to me, a good script created using PyKD, which I called heap_stat.py.

In fact, it is not for .NET, but for an application in C ++, but it gives C ++ developers some of the functionality that I showed earlier (viewing the heap and what objects are there). For .NET, as you have seen, it is quite easy. For C ++, this is a bit more complicated.
This extension is a Python script that works with heap C ++, finds objects and displays the number of objects of this type. In some cases, it can also display the total size. It would be very difficult to do this using only the WinDbg scripting language, and using Python it even turns out to be nice. This is Python, after all.
Let's look at some other extensions. In principle, the expansion model is quite simple.

Every WinDbg extension is just a dll. You can write it in C ++ or C # - in any language that supports exporting functions. And then you pass your extension to the debugger and just run each function as a command.
The extension has access to the debugger API. Suppose if your extension wants to output something, for example, to view objects in memory, it gets access to the debugger interface.
Here is a simple extension that I designed to demonstrate how, in principle, they look:

This extension scans the content by URL. From the debugger, you can execute an HTTP request and print the resulting HTML code.
The extension is written in C #, and it is quite simple, let's see how the result looks. To do this, I run WinDbg and any process I can join (for example, Notepad). After that I upload my extension - now I can go, for example, to google.com. And if the Internet connection works, we get this result.
This is probably the Russian language (I do not have the encoding).
Interestingly, the output contains links directly in the debugger. This makes its use more open to the user. For example, if I click here on Blogger, at the bottom of the screen you will see that the debugger is performing another query - on another page. As a result, we have a super simple text browser built into the debugger.
Above, I gave a very simple example of extending the debugger, but I hope it will serve as a starting point for you. If you are interested in creating your own extensions that are doing something really powerful, you can use this approach to design your own extensions. It is not difficult, and you can create extensions in C #.
Let's look at a few existing extensions (it’s not always necessary to write your own).
Here is an example of a typical situation that I have to deal with when debugging 64-bit code. 64- Windows , - . , , , , — . Visual Studio, WinDbg.
— cmkd , . , , .
,
, , . , , ,
, . , .NET-, C++ 64- Windows ( , ).
— SOSEX . , , WinDbg , SOSEX — , .NET WinDbg.
SOSEX . Microsoft, ( SOSEX ). .
SOSEX — heap. heap .NET, , , heap — , 10 — , .
? heap — — . :

—
. — SOSEX
, , netext . Microsoft — . , . ASP.NET. , heap.
,
HTTP- : , ( ) .. ASP.NET, .
netext SQL- . heap. SQL, , .

,
( )?

netext. .
netext , .
, (, , ) — . tracer. WinDbg, .
, , , , , . tracer , ( ) , — . , .
WinDbg, , , , , Visual Studio.
- Visual Studio, , Windows. , , — . WinDbg , , , , TCP, SSL, HTTP — , .
.
.
cdb ( TCP- 5050 ) .

, . x86 :
: , , , .
. Microsoft , . . .
WinDbg, — Smart Client.

, WinDbg WinDbg . dbgsrv.exe, , .
, . , , — ASP.NET.
. , , — .
WinDbg. , , «» . - , «» , - . , , . , , . , . , Visual Studio.
. WinDbg:
CLRMD :
:
msos — CLI-, C#:
20- — « The Performance Investigator's Field Guide », DotNext 2017 Piter ( — 19-20 ).
, «Production Performance and Troubleshooting of .NET Applications»
Especially this material will be useful to those who find it difficult to watch the reports in English, since the transcript is translated into great and mighty!
Windbg is considered to be a very complex tool that only hardcore C ++ developers can use. However, in this report, I will show you when it can be useful for .NET developers and where WinDbg can be used to debug .NET applications when solving really complex tasks.
')
Some of you have already used WinDbg before, but I hope you learn something new from this report. And to those who have not met with WinDbg, I hope to show what exactly this tool can do for you.
- I'll start with some tips on how to make WinDbg more friendly, a bit more simple for .NET developers.
- I will talk about the power of scripts and breakpoints, which in many cases help me solve problems, as it seems to me, are not otherwise solved, especially in Windows.
- I'll tell you about some useful extensions. WinDbg is notable for a good extension model - you can download add-ons that run arbitrary code to help you figure out things that the debugger itself can't handle.
- Let's talk a little about remote debugging, since this script is also very simple in WinDbg.
The Visual Studio debugger, which most of us use every day, cannot cope with approximately 90% of the material that I am going to show. That is why I show you all this with WinDbg (and not at all because it is such a fun tool). It does have a power that Visual Studio does not have.
When you can not do Visual Studio
Can Visual Studio be called a powerful debugger?
He is not bad. But this is a toy for people who like to use the mouse or hotkeys. Compared to really powerful debuggers like JDB with IDEA, DDD or WinDbg, Visual Studio is a kind of toy. It no longer contains macros, as in Visual Studio 2012, so it is very difficult to extend the debugger with your own scripts; there are virtually no extensions for the debugger mechanism itself. In addition, Visual Studio is great if you have the source code. But if you don't have the source code for a particular thing, it will be much more difficult to do something. You can hardly do anything.
Therefore, I like Visual Studio, but there are a number of cases when a more powerful tool is needed.
Probably, some of you saw the original of this diagram on Reddit in the edition for Linux distributions.
Here, Visual Studio is the shortest beard. Real geeks use WinDbg, cdb, which is the console version of WinDbg, and so on. In other words, you can always find hardcore to learn.
So let's take a look at some of the things that first make WinDbg a little easier to use.
Making WinDbg Less Chilling
Interactive menu
One of the reasons why WinDbg is so scary is the need to memorize a huge number of commands. There are several menus and shortcuts, but more often you have to type a lot of text commands manually.
However, WinDbg has a
.cmdtree command that creates this nice menu for you:You can navigate the menu with the mouse, running useful commands. In one of my repositories there is an example of a file of an interactive tree of useful commands grouped into categories. Such a menu makes it a little easier to work with WinDbg for beginners.
Links in the output
I assume that many do not like WinDbg also because the output of commands is so terrible. And almost always have to use copy-paste - take the result of the execution of one command and transfer it to another team.
For those who don’t like it, there is an option that has been enabled for a long time by default in the WinDbg versions called DML (DML is a debugger markup language; I’ll show you later). Thanks to this option, in recent versions of the debugger, the output of the commands has links. Just click on the link to get something else.
In the example below, I ran a command called
!name2ee , which takes the name of the class (in this example, the C # class) and gives me some information about the class, in particular, in which assembly it is located.The command output has links that I can click on. For example, if I click on the link next to the EEClass field, I’ll get this:
The link runs another command that displays information about the type. As you can see at the bottom of the screenshot, there is a Field, Type and additional information about this field. And again there are links. If you click on them, get more information and so on. When you do not remember all the commands, studying the results of the team’s work will be more useful if you have this toolkit.
Automation
Another feature that scares in WinDbg is that some simple things require you to enter a large amount of text. But there is another useful thing that many people don’t know about: you can run WinDbg, execute several commands at once, and at the end just exit (I’ll show you a few examples). In essence, WinDbg has the -c option, which takes the command line.
This feature is easier to demonstrate live using the example of a dump file of a process that failed.
In the folder C: \ temp I have saved several dump files. I also have WinDbg and cdb - as I said, this is the console version of WinDbg. I will open with WinDbg (cdb) one of the dump files.
cdb.exe -z C:\temp\FileExplorer.exe.14804.dmp -c ".logopen C:\temp\crash.log; !analyze -v; .logclose; q" -z - switch for dump.-c - allows you to run the command immediately after opening the dump.The main thing - do not forget to close the file and exit at the end.
".logopen C:\temp\crash.log; !analyze -v; .logclose; q" - this command line analyzes the dump file, giving me some useful information..logopen opens a log file, where output is performed (log files are more convenient to use, since we can analyze it later by applying a search on a string inside the file).Here we have some basic automation of the debugger: I can start the debugger, analyze the dump file, put all this into a log file and exit. And these actions are repeatable - they can be performed in batch mode.
As a result, we get information about what happened in the dump. At the end of the output contains information about the response, the call stack and other useful details.
One more example. Here I ran
findstr in the output results to find the name of the fallen process and which function caused the exception.There is also information about the operating system, CLR version - in general, a lot of useful things.
Again, an example is a method that I often use in searching for memory leaks. When you have a memory leak, it is clear that the process is getting bigger and bigger. And you need to periodically connect to it, and then disconnect. Here's how to do this with WinDbg.
I run cdb (because I like it more) with the
-pn for a process that may have a memory leak (which I want to join). Next, I give the command !dumpheap , which displays statistics for .NET heap objects. The -min means that in this case I only need objects larger than 10,000 bytes. At the end, using qd complete the work and disconnect.After running this command, WinDbg connects to the process, displays the top objects in a heap of more than 10,000 bytes in size and disconnects from the process. In other words, this is an almost instant way to find out what is happening with memory. The same can be run in batch mode. Good luck to those who would like to do something similar in Visual Studio.
Script language WinDbg
I hope that the above examples of automation prove that when you have a powerful debugger, you can run it automatically, write the script and use it repeatedly. But to really take advantage of the reusability, you need to understand how the scripting language works - the most difficult and “terrible” part of WinDbg.
WinDbg has a built-in scripting language, but this language has never been purposefully developed. It is not like C #, which is designed by a separate committee. This is a language that appeared gradually, someone added something to it, someone else corrected it. So it turned out that we have.
Let's take a look at this script (there are many more examples, there are relevant tutorials, but we will not turn this conversation into a training course on scripts in WinDbg).
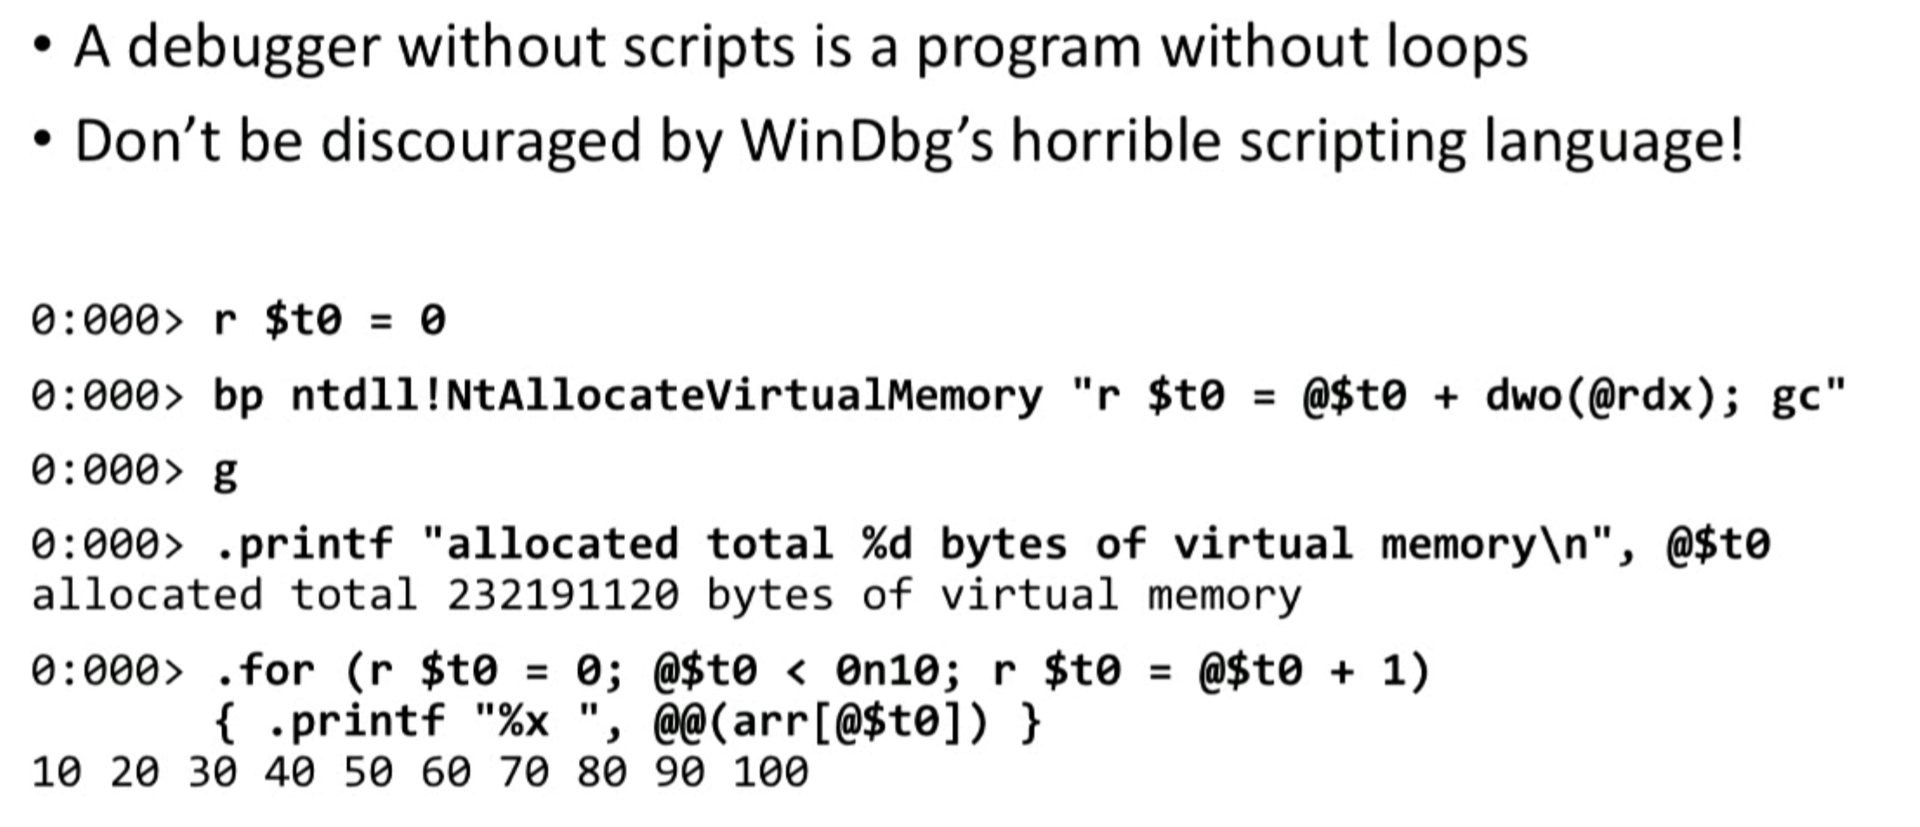
Here, the first line initializes the
$t0 variable with a value of 0 . It is easy. The second line places a stop point in a specific function. The NtAllocateVirtualMemory function is a Windows API that allocates memory. One way or another, memory allocations must go through this API.Whenever we hit a breakpoint (when we call this function), I execute the command inside quotes: I increase the
$t0 variable with some kind of scary expression (here the rdx variable contains the amount of allocated memory).Then I entered
g to keep the application running. After I use the .printf command to print the current value of the $t0 variable, which will tell me the total amount of allocated virtual memory.In other words, we set a breakpoint. Each breakpoint increases a variable by the number of bytes allocated. When I need to, I simply output the value of this variable, getting information about how much memory has been allocated.
Breakpoints
The general approach, which is to put a breakpoint somewhere and do something for you, is extremely effective. In Visual Studio, many use breakpoints to simply stop the debugger. That's great, I do that too. But the real power of the breakpoint is that it can work for you (and not you at it).
Here are a couple of examples of this.
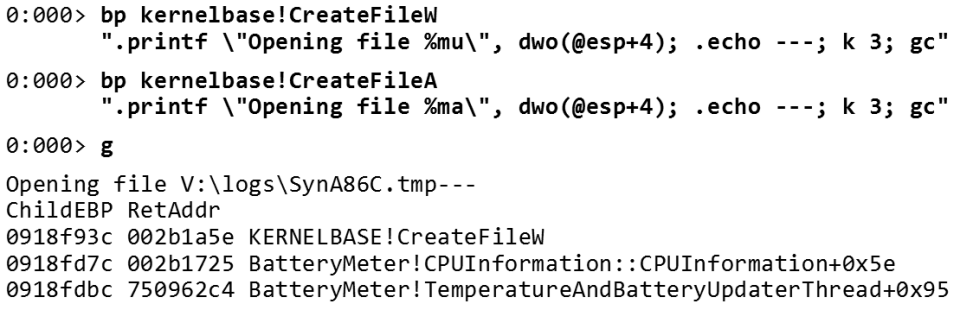
Let's say I have an application that creates files, but I don't know where these files come from. The application continues to create files, but does not delete them, but blocks them. Thus, while the application is running, I cannot delete these files. Surely many were faced with a similar situation.
Suppose I want to find out where these files come from. There are several ways to do this. The easiest is to add a breakpoint. Let's put a breakpoint where we create the files, and see where they come from.
The Windows API has two main functions for opening files:
CreateFileW and CreateFileA .Whenever I call one of these functions, I display the name of the file being opened.
Here
@esp is the stack pointer for 32-bit processes (x86), and @esp+4 is the first parameter of the function (you don’t need to remember this, you can find out all this by going to the debugger). If you call CreateFileW , the file name is a Unicode string, so I use the %mu format, and if it is CreateFileA , then the file name is an ANSI string, and then I use %ma .Next, I type the file name and three dashes. The
k command shows me the call stack. As a result, whenever my application opens a file, I get a message in my debugger about which file I open (the call stack shows how we got there). The example above is the C ++ call stack, but the same can be done for a .NET application. Consider a couple of additional examples.Suppose my application complains about missing files — that a file cannot be opened. But it does not tell me why and where. All I get is a stupid “can't open file” error message or something like that. This happens quite often.
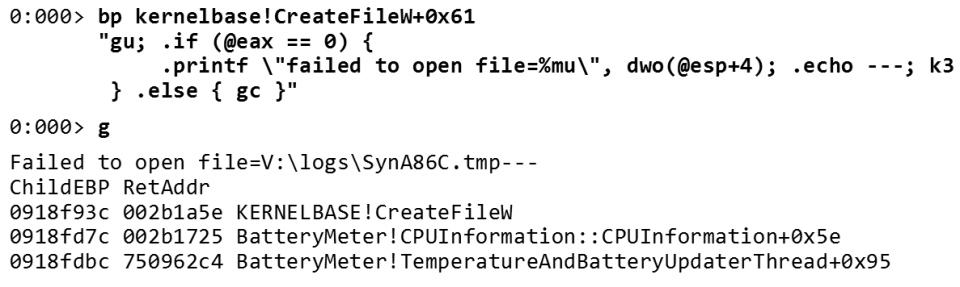
Just put a breakpoint, though a little more complicated. It should reveal that an error occurred (I could not open the file). To do this, we put it in
CreateFileW (in the example below, a small error: there should not be an offset of 0x61 , please ignore it).So, we place breakpoint in
CreateFileW . The gu command will be executed before returning from this function. After stopping, we check the @eax register. In 32-bit Windows, @eax stores the result of a function. On 64-bit Windows, @rax carries essentially the same load. If the return value is zero, then the file could not be created. If the debugger sees that the call did not work, I print out which file I was unable to open (and again I can print the call stack where it happened).Again the debugger works for me, and not vice versa. I'm not trying to find in my code all the places where I could open the file. I just say to the debugger: "Let me know when the opening of the file fails."
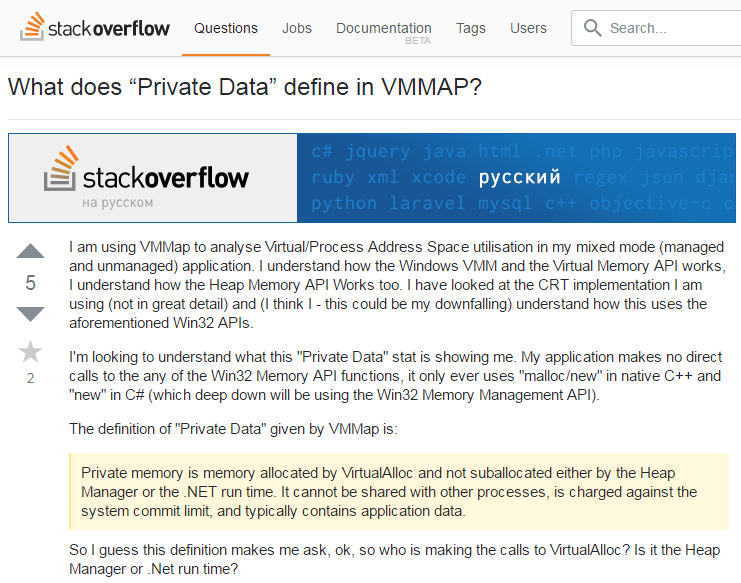
Here is a real example from StackOverflow.
What a long description of the problem! This guy is trying to understand something. And at the end he asks the following question: “This definition raises the question: who then calls VirtualAlloc? Is this a heap or .NET runtime? ”
I think you know how to handle this task.
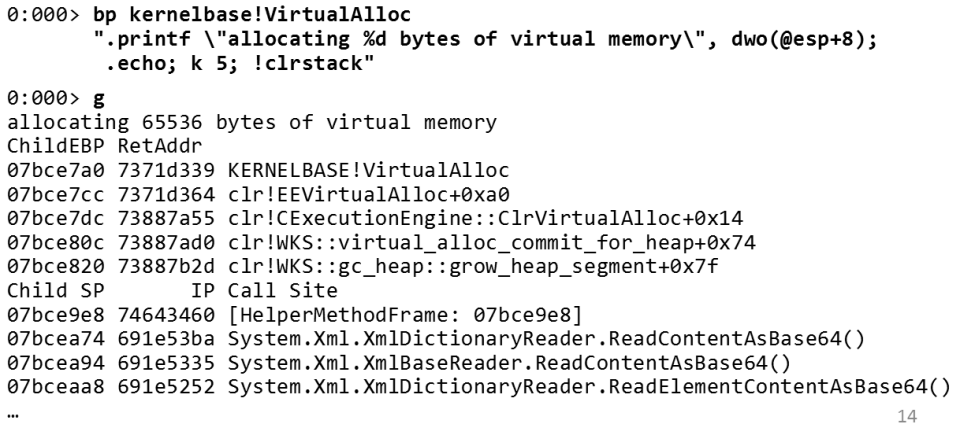
We set a breakpoint in
VirtualAlloc and figure out everything you need. It's pretty obvious - you want to know who is calling a function? Put a breakpoint there and get the information you need, what could be simpler? So, we put a breakpoint in VirtualAlloc , and then output how much memory is allocated. We are also printing - this is an example I’m talking about - the managed code call stack ( !clrstack ).So, in this example, you see: I allocate virtual memory from the garbage collector. On the
gc_heap stack, grow_heap_segment , virtual_alloc_commit_for_heap , which was called XMLDictionaryReader to read the contents.The technique of placing a breakpoint anywhere with subsequent processing is perhaps the most important thing I give in this report. This is an incredibly powerful tool that simply does not exist in Visual Studio. Visual Studio is good when you have the source code into which you want to insert a breakpoint. But when you have to work with custom actions, conditions, etc., in Visual Studio you will find only basic support. With WinDbg you can do much more! WinDbg is also much better if you do not have the source code into which you want to insert a breakpoint (for example, if you plan to put it in Windows API calls or some internal CLR functions). I can't say that WinDbg is very friendly, but it is definitely very powerful.
Switch to another example. Suppose you have this huge collection of objects in which there is one bad object. Why is the object bad? For example, it contains the character a with a small dot breaking the encoding. I want to find this “broken” object.
Not very nice, but it works. Toward the end of the report I will show another way to solve this problem. So, first we will find where the class is
!name2ee OrderService!OrderService.Order .This is the class I'm looking for -
Order . Good. Next, we do a class dump to find out where the field I need is located (relative to the beginning of the object).I'm interested in the
Address field. As we see, here the offset is 4 relative to the beginning of the object:All that is left to do is to find
Order objects in my heap and find the line with offset 4 from the beginning of the object. After that I have to look inside the line and see if there is “a with a round dot on top”.I will not rewrite the line once again - this is unnecessary, but I will mention a few key points:
- There is a
.foreachloop that runs a debugger. This is pretty "crazy." And in this cycle.foreachthere is an additional operator.if- i.e. real program logic. Not that there was no other way to do this, but perhaps the easiest way to accomplish this with WinDbg is to write your own code to analyze a collection of objects (you can do this if you have access to a system that runs the process) . - As a result, for some object the address field actually has a with a dot on top.
- This is the object I was looking for: “233 Håmpton Street”. The idea is that the debugger executes the program for us.
In the last example (before moving on to extensions), I will show some cool commands.
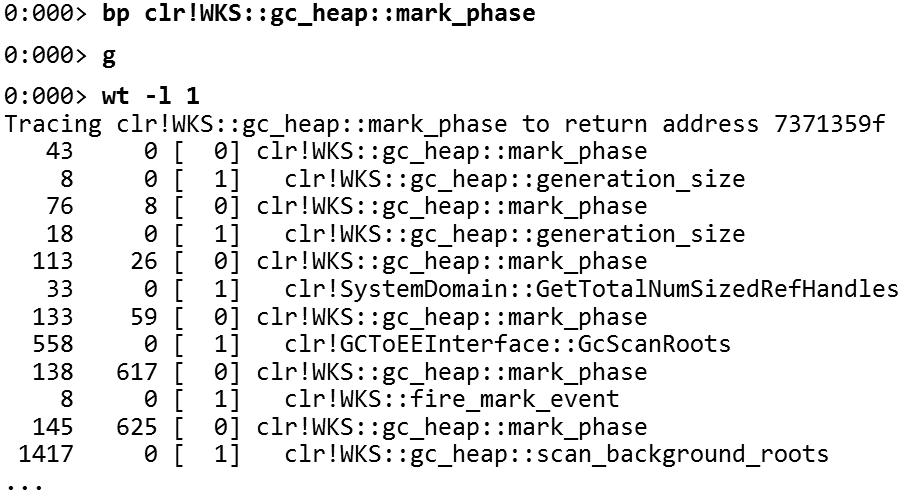
There is a mysterious team
wt , few know what it means. It traces the execution of the code. You take a function, run wt and it prints out all the calls that this function performs. At the same time you can limit the depth of the trace.For example, I was curious about what the garbage collector does during
mark_phase . So let's put a breakpoint in the garbage collector function called mark_phase and run wt .As a result, you get this beautiful tree (I have limited the depth to unity) - you get all the functions called by
mark_phase . If you're wondering how the garbage collector works, there are a lot of details here (calls generation_size , GcScanRoots , scan_background_roots and heaps of other functions). Full output includes several pages. At the end you will find a report with all the functions and the number of commands executed.Thus, you can see the most “expensive” functions in terms of the number of instructions:
mark_through_cards_for_segment , mark_through_cards_for_large_... , etc.It looks like a profiler right inside the debugger. It is important to emphasize that profiling goes step by step according to the instructions of the program. It is very slow, i.e. for profiling as such is not suitable. But it is very good to understand what is happening in a particular method.
Extensions
In this part of the conversation, I'll show you a couple of useful extensions.
PyKD
And I'll start with an extension that allows you to write scripts for the debugger using something less awful.
Not as bad as the script you saw before. This is a pretty nice extension, called PyKD. What does PyKD do? It allows you to run Python to automate WinDbg - i.e. run WinDbg commands, analyze output, use Python tools with WinDbg.
The example above is not very interesting. Here I’m just trying to fix the stack if it’s broken. However, the idea is that you have a Python API for most things that WinDbg can do. One way not to write in the terrible language WinDbg is to use Python.
I have, it seems to me, a good script created using PyKD, which I called heap_stat.py.
In fact, it is not for .NET, but for an application in C ++, but it gives C ++ developers some of the functionality that I showed earlier (viewing the heap and what objects are there). For .NET, as you have seen, it is quite easy. For C ++, this is a bit more complicated.
This extension is a Python script that works with heap C ++, finds objects and displays the number of objects of this type. In some cases, it can also display the total size. It would be very difficult to do this using only the WinDbg scripting language, and using Python it even turns out to be nice. This is Python, after all.
Extension Model
Let's look at some other extensions. In principle, the expansion model is quite simple.
Every WinDbg extension is just a dll. You can write it in C ++ or C # - in any language that supports exporting functions. And then you pass your extension to the debugger and just run each function as a command.
The extension has access to the debugger API. Suppose if your extension wants to output something, for example, to view objects in memory, it gets access to the debugger interface.
Here is a simple extension that I designed to demonstrate how, in principle, they look:
This extension scans the content by URL. From the debugger, you can execute an HTTP request and print the resulting HTML code.
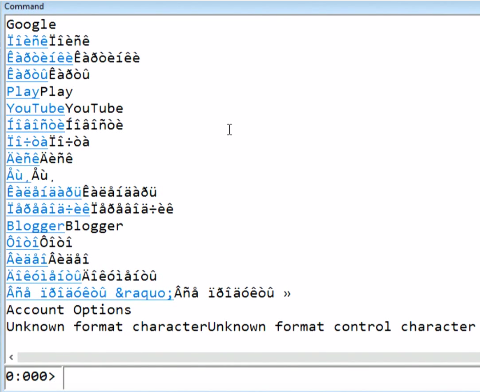
The extension is written in C #, and it is quite simple, let's see how the result looks. To do this, I run WinDbg and any process I can join (for example, Notepad). After that I upload my extension - now I can go, for example, to google.com. And if the Internet connection works, we get this result.
This is probably the Russian language (I do not have the encoding).
Interestingly, the output contains links directly in the debugger. This makes its use more open to the user. For example, if I click here on Blogger, at the bottom of the screen you will see that the debugger is performing another query - on another page. As a result, we have a super simple text browser built into the debugger.
Above, I gave a very simple example of extending the debugger, but I hope it will serve as a starting point for you. If you are interested in creating your own extensions that are doing something really powerful, you can use this approach to design your own extensions. It is not difficult, and you can create extensions in C #.
Let's look at a few existing extensions (it’s not always necessary to write your own).
CMKD
Here is an example of a typical situation that I have to deal with when debugging 64-bit code. 64- Windows , - . , , , , — . Visual Studio, WinDbg.
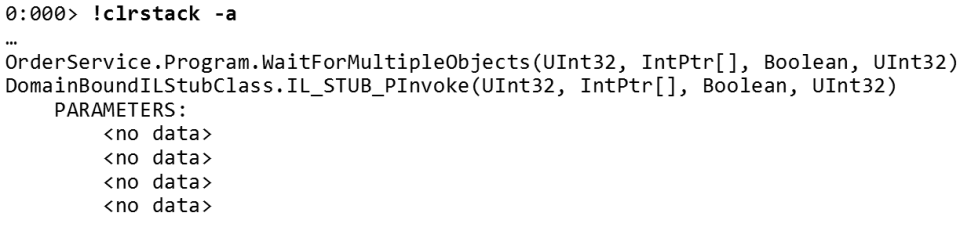
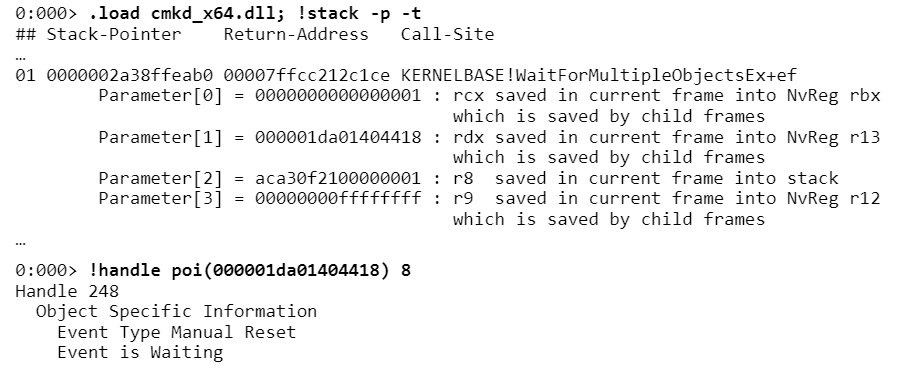
WaitForMultipleObjects , . , . : « , , , ». 4 , , , , « » 4 .— cmkd , . , , .
,
!stack . WaitForMultipleObjects . CMKD , ., , . , , ,
rdx , , r13 . r13 - , . , - ., . , .NET-, C++ 64- Windows ( , ).
SOSEX
— SOSEX . , , WinDbg , SOSEX — , .NET WinDbg.
SOSEX . Microsoft, ( SOSEX ). .
SOSEX — heap. heap .NET, , , heap — , 10 — , .
? heap — — . :
—
.foreach — heap , (, ). !bhi , !mroot , , , Byte Schedule , , , Employee .. — SOSEX
!gcroot . 30 ( 30 ) — 5 . , , ( 30 ). !mroot 30 0 ( — , , ). , . heap, WinDbg, — SOSEX. — heap. .netext
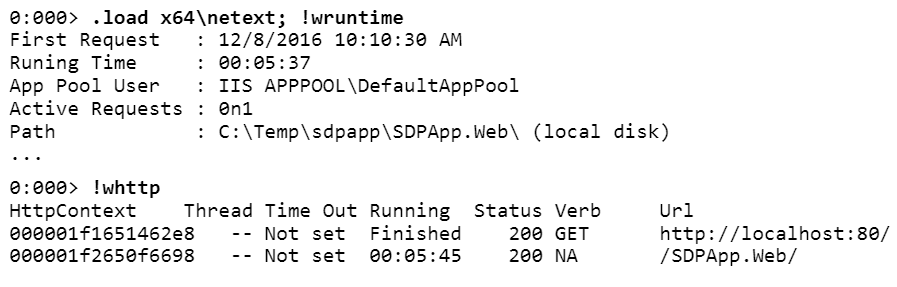
, , netext . Microsoft — . , . ASP.NET. , heap.
,
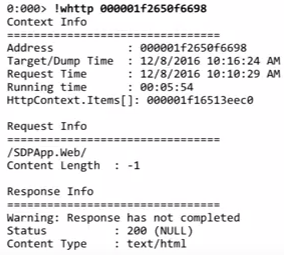
!wruntime , ASP.NET, . .!whttp , HTTP-, heap. HTTP-, ( ). , , , , .HTTP- : , ( ) .. ASP.NET, .
netext SQL- . heap. SQL, , .
,
HttpContext _request._rawUrl _response._statusCode . abc HTTP-.( )?
netext. .
Order , Address , $addr . . — .netext , .
tracer
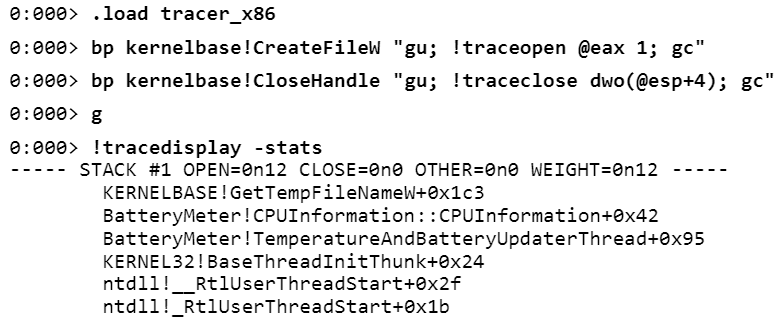
, (, , ) — . tracer. WinDbg, .
, , , , , . tracer , ( ) , — . , .
WinDbg, , , , , Visual Studio.
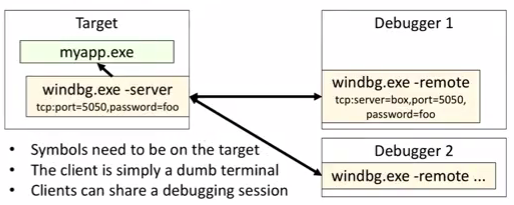
- Visual Studio, , Windows. , , — . WinDbg , , , , TCP, SSL, HTTP — , .
.
.
cdb ( TCP- 5050 ) .
, . x86 :
cdb -remote tcp:server=localhost,port=5050 : , , , .
. Microsoft , . . .
WinDbg, — Smart Client.
, WinDbg WinDbg . dbgsrv.exe, , .
, . , , — ASP.NET.
. , , — .
WinDbg. , , «» . - , «» , - . , , . , , . , . , Visual Studio.
. WinDbg:
CLRMD :
:
msos — CLI-, C#:
20- — « The Performance Investigator's Field Guide », DotNext 2017 Piter ( — 19-20 ).
, «Production Performance and Troubleshooting of .NET Applications»
Source: https://habr.com/ru/post/326454/
All Articles