UX strategy. Part 5 - Exhaust Design
In the first part, I described the outline of the UX-strategy , and the following talked about the operational and tactical components - how to build the work of the design team and produce quality products . Now it's time to discuss how design solves business problems.

The article is written for the magazine UXmatters (part 2 on the way).
Designers defend the rights of the user, but appeal to things that are incomprehensible to managers - best practices, guidelines, someone else's experience, or simply “first, it’s beautiful”. They can not always shift them to their product. Laura Martini makes the correct analogy : accountants do not say they earn money by filling in the tables of incomes and arrivals, and personnel officers say that they get money for calls and letters to candidates; they talk about business value - healthy finances and strengthening teams, respectively. It is better to translate the pain of users into the language of business, rather than continue to argue - then everyone will be happy.
')
One example is the Design Value Index . This is the capitalization index of companies investing in design - in 2015 it grew by 211% more than the S & P 500 stock index.

Design Value Index, 2015 © DMI
Not really. Bloomberg compared the American Customer Satisfaction Index and the market dynamics of 190 leading companies - the opposite is true .

Comparison of American Customer Satisfaction Index and market dynamics of 190 leading companies © Bloomberg
In fact, both are right index. In a competitive B2C market, product and service quality is very important for market success. But if sales are little dependent on the end-user opinion (monopolistic industries, government services, corporate software with centralized procurement), other patterns work. In addition, investments in product quality are aimed at the long term, they will not show a quick result.
Therefore, it is not enough to refer to the success of other companies - their business may work on other principles. You need to soberly assess the current situation and understand where the design can benefit the business. Otherwise, you will remain a pixel engine or a toy in the hands of management.
Solving business problems is the main task of designers after the most basic - assistance in product development. Companies, of course, it is important how well we do our work - the design should not delay the launch of products and their updates to the market, and its quality should be decent. But this is only a small piece. It is even better if designers help businesses make better product decisions. Or even find new opportunities for growth.
This is what will allow the design team to become not just a performer and advance along the maturity model from operational (how well a specialist does his job) and tactical levels (how well the product production process is built) to strategic (where and how successfully the company develops). In the end - to influence what the company is doing and why.

Designers often complain that they are not attracted to the work of defining a product. Requirements come from managers and they just draw pictures. Somewhere this is due to the immaturity of the company and management, somewhere - the weakness and short-sightedness of the designers themselves.
Start with yourself - you need to increase the credibility of the design team and not leave tails, solving basic problems at the operational and tactical levels (I have written enough about this in 2-4 parts). But if you want to influence the product - fight! It is important to show and prove the value of design - we know a lot about users, and this is important for product managers to make decisions. Then you will be invited not only for the production of models and prototypes. WeWork's Bobby Ghoshal says that 80% of design decisions are taken out of pixels — in discussions, presentations, meeting meetings, and so on. - and it is important to be able to argue your ideas.
Melissa Perri and Scott Sehlhorst show that the product manager and designer overlap in many ways. Some of this concerns quite familiar design artifacts that designers have been successfully making for a long time. But the most important thing is user problems. To be able to find them, assess the importance for customers (goals, context, motivation and opportunities) and the business itself (product strategy, competition, organizational potential, etc.), and as a result - the ability to offer and visualize the future in which the problem is solved - here are the key growth points for a design team aiming for a mature UX.
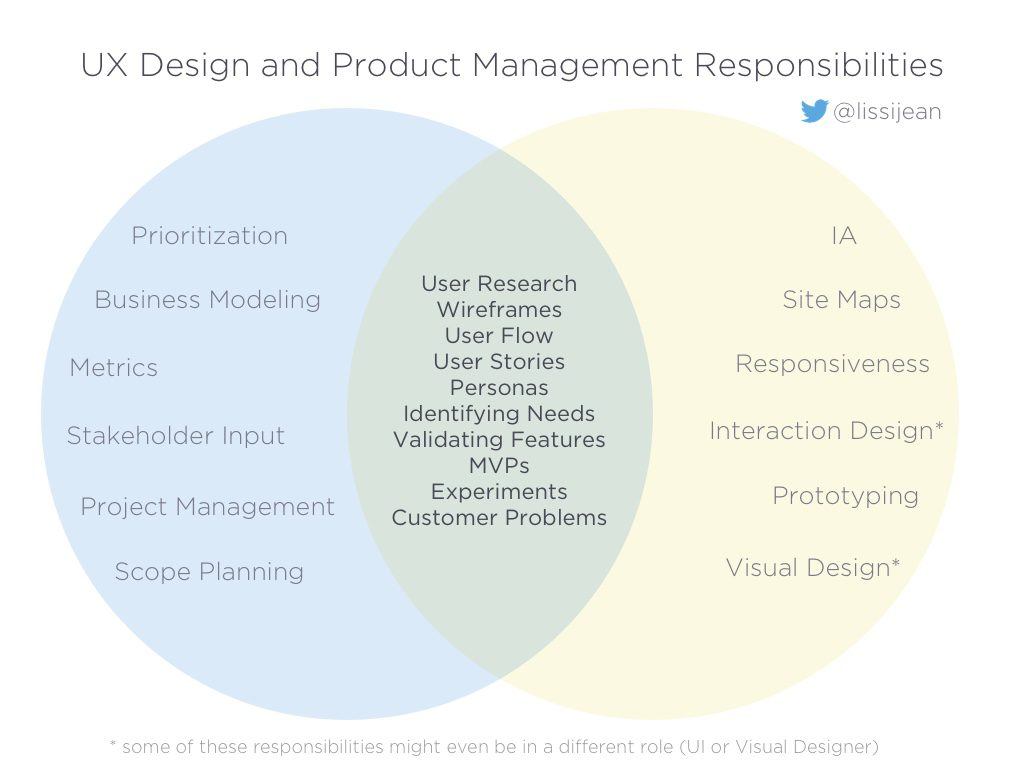
Common language and problems © Melissa Perri
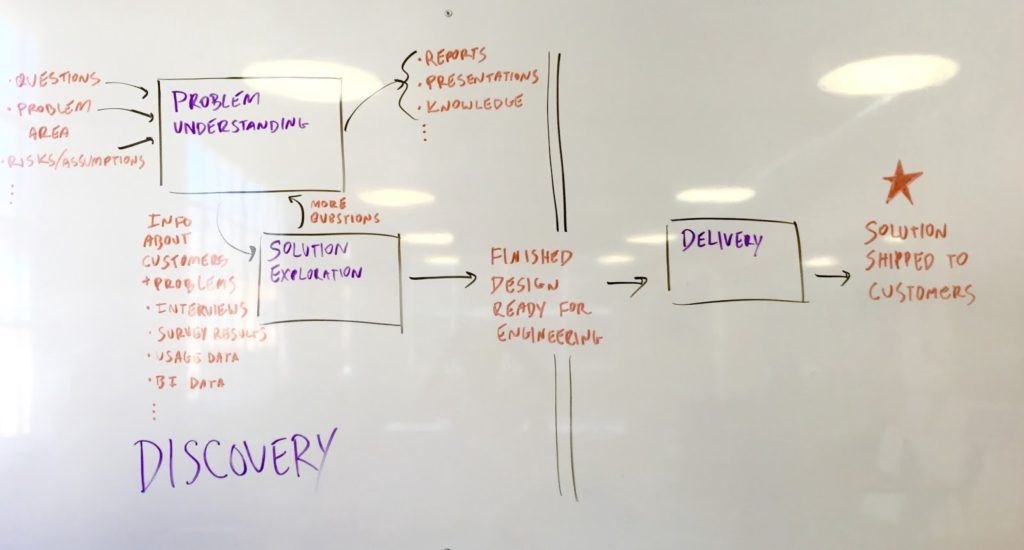
In a mature company with cross-functional teams, designers help product managers make decisions. Where and what? Imagine an idealized process of working on a product:

The idealized process of working on a product or functionality
The model of developing products and their new functions over the past 10–15 years has become increasingly dynamic, so this scheme is rather arbitrary - full of both more iterative and more conservative examples. In addition, in the real world, the first stages are often shortened to the finished product plan. But this does not change the essence.

Lean model of the product or functionality © Jason Evanish
If along the entire chain, designers will always remember why the company solves specific problems and how these decisions affect the business, the focus will shift from project artifacts and methods to product work. And finally, we will not only solve development problems, but will influence key business indicators and, perhaps, even introduce innovative ideas. This transformation of the role of designers consists of three stages:
If we take product development beyond the brackets, then the product team and its manager have three main tasks:
They can be represented as a “problem → solution → validation” chain. The product team will go through it more efficiently with the help of tools that UX-specialists have. Many companies are beginning to integrate designers from the last stage, organizing the process of usability testing - it is relatively simple, and the exhaust is immediately clear. But if you join in all three, you can dramatically increase the value of the work of designers.
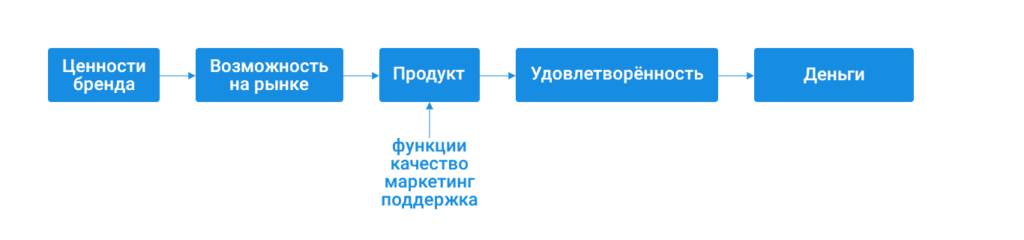
One of the ways to launch new products and develop existing ones is to go from the still unsolved problems of users. If the potential audience is large enough and there are prospects for monetization, the company can offer them a suitable product. What the product manager does in this case:
The advantage does not always come from the product itself (somewhere a competitive struggle is won by a cheaper price or new distribution channels; someone starts with technology). But if the matter is still in him, then the design team can greatly help the product manager:
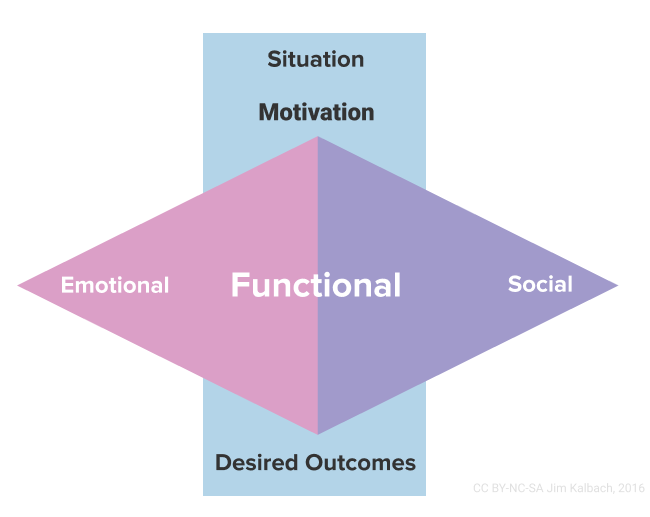
To formalize user problems, the Jobs to Be Done method is increasingly used. Intercom and James Kalbach are writing a lot about digital products about it now. Job stories show what life situations cause problems for users (functional, emotional, social) for which they are ready to pay. A similar approach to finding and describing potential problems is described by HubSpot .

Job story © Alan Klement
 Model Jobs to Be Done: 4 forces © Intercom
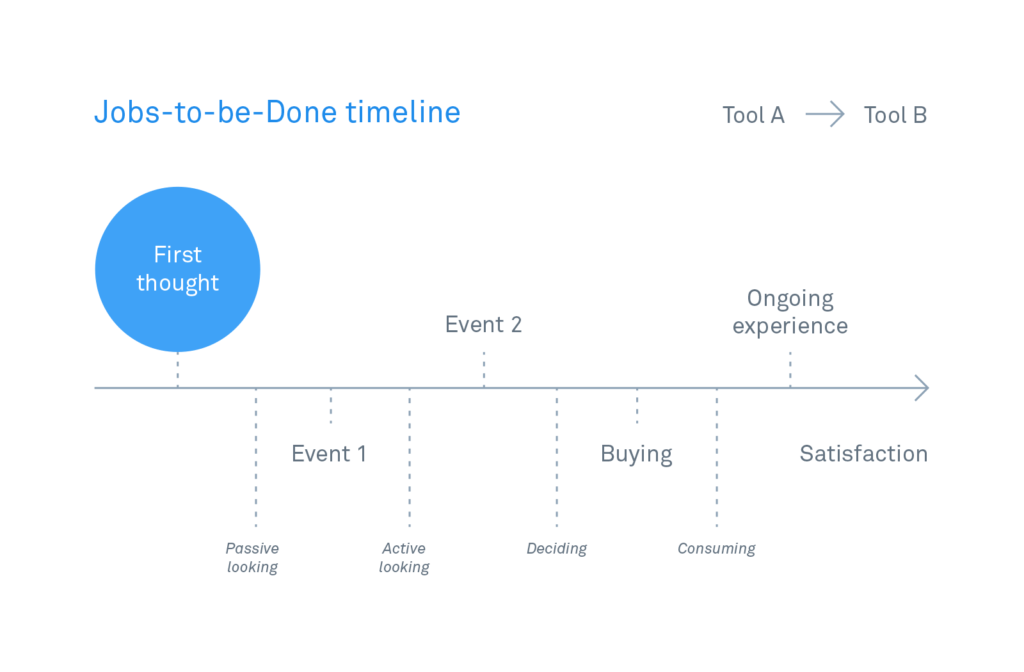
Model Jobs to Be Done: Life Cycle © Intercom
Model Jobs to Be Done © James Kalbach
Jobs to be Done are also a way to segment users according to their needs. Previously, designers used characters for this, but this tool has recently lost its former glory - few people use them effectively throughout the work on the product, and not just at the beginning. In addition, JTBD has a clear focus on problems, while characters often spend a lot of time describing personal characteristics, moreover, taken from the head, not from user research. Problems are easier to use as a filter for subsequent product decisions. Although the characters are still well pumped empathy to their users from the grocery team. And if the segmentation of the audience of the product is quite clear, the characters in conjunction with JTBD will be an excellent tool.
Value Proposition Canvas facilitates the similar task of linking the description of a user's portrait and his problems. This approach shows how a business plans to solve user problems through providing value to them.

The Value Proposition Framework Canvas © Alexander Osterwalder
A good tool for a more detailed analysis of user problems is the customer travel map (product interaction map) and the experience map (a more abstract process of solving a life problem). This is the language of designers, which is useful to teach managers (and the most advanced of them have already tried it out). Although in addition to these two formats, service blueprints are also distinguished (as the company provides service), many experts advise not to be killed about semantic accuracy and pattern matching - the main thing is for the card to help in its work.

Customer Journey Map © Macadamian
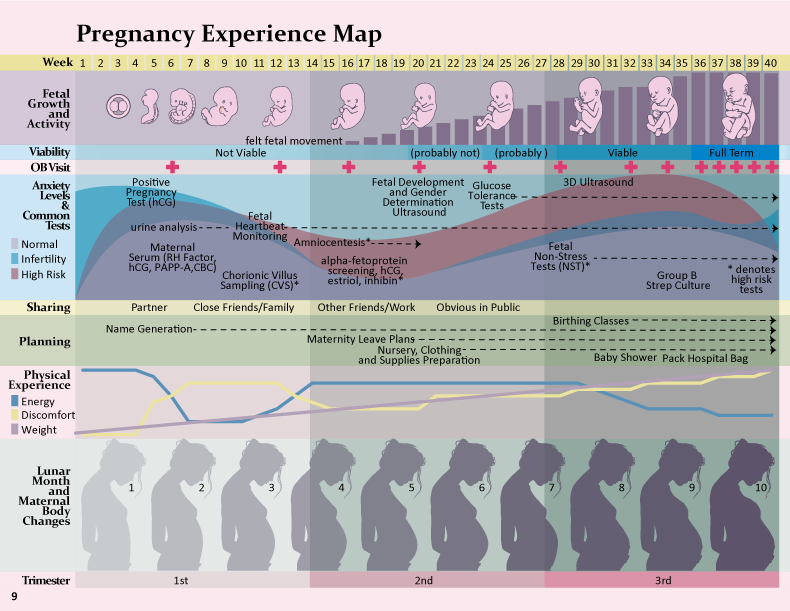
Experience Map © Beth Kyle
Such cards show how the user solves his problem now (in a particular product and outside of binding to it), noting the key stages of this scenario, as well as positive and problematic places in them. They may include the full cycle of the client’s purchase of the product from its awareness of the product to active use and recommendations to friends, or interaction with a separate large piece of service. If we are talking about a new product of the company, the map will help to present its main functions; if about existing - will show the bottlenecks, the solution of which will allow to develop it. Moreover, the card affects both the digital product and accompanying services in other channels of user interaction (including offline). And this is a deep look at the problem, giving even more useful information for decision-making.
The interaction map does not have to be complex and spectacular, as in the examples above. The main thing is that it helps to visualize user problems.

Customer Journey Map in a simplified version © Shopify
True, exhaust depends on the complexity of use cases. One-page promotional site is better to include in the general map of interaction with the product that it sells - interaction with the landing itself is too primitive. If the product processes a lot of scenarios, but it is still atomic (for example, an Internet search) - rather complex analytics and behavioral segmentation of users will help.
In reality, companies often come from opportunities in the market, quickly launching a product and iteratively developing it, and the understanding of users comes later. In this case, many angles are cut off and no user studies are performed. But for successful product growth, the need to understand your customers is important, so the product manager will return to these issues sooner or later. Moreover, the focus of mature companies is increasingly shifting from solving problems to finding them, and without an understanding of users, these possibilities are limited.
When the problem is studied well enough, and its importance and value to users is large enough, the product manager needs to offer a product solution for the target audience. What the product manager does in this case:
Here the participation of the design team is more active and we can further help the product manager:
Hypothesis testing is a major place for designers to benefit. And thanks to the popularization of the practices of design thinking, companies are increasingly “thinking with their hands”, creating prototypes of solutions. And with the spread of lean approaches, the importance of fast iterative work in the early stages has increased.
Although hypotheses are tested at the next stage, they need to be put at the stage of proposing solutions (and the very formulation of the problem is, in fact, a hypothesis). It is important to understand how we will make sure that the proposed concept really solves the chosen problem of users. To do this, you need to decide on the experiment: the way of testing (as well as which users will see the concept), the success metrics (which statistically significant data from analytics or user research will confirm the hypothesis) and the minimum set of functions (MVP (minimum viable product): which scenarios the concept should work out ). In many ways, this is the task of the product manager, but the design team has many methods for testing hypotheses and, in a mature company, is actively involved in the process.
An interesting approach to the description of hypotheses suggests John Cutler.
Hypothesis Description Format © John Cutler
Based on this, it is possible to vary the degree of development of the prototype, depending on the hypothesis itself and the process stage: from a rough demonstration of the key steps in the form of block diagrams of screens to a complete customer journey map on real data, including initial training. The relevance for the current project stage and the depth of understanding of the product and users are important here.
An interesting format for describing a bunch of problems and solutions is offered by Nikkel Blaase.

Format for describing problems and solutions © Nikkel Blaase
When the product approaches the launch and after the release itself, the manager needs to make sure that the quality of the implementation is up to standard, and the users understand how to work with it and are happy with the result. What does he do in this case:
In a lean environment, the transition from hypothesis and MVP to the early version of the product and its release is not always clear, therefore, steps 2 and 3 can be difficult to separate. But in general, this is a classic task for the design team, when we help the product manager to improve it:
This is bread and butter for food designers and custom researchers; the first role for which they are involved even in not the most mature companies. The format of the work is simple and straightforward, although it is often not easy to make changes. Young design teams can start from this side, and then get involved in the grocery work deeper. At the same time, it is important to involve product managers in user research and testing themselves as observers. They will see problems in the product with their own eyes and will trust designers more (and you will be interested to see all five stages of making the inevitable).
True, to test and analyze all the hypotheses will not work. It is important to learn how to matchthe amount of new information that the team will receive after the survey, and the time and resources needed for this. Often we can only rely on expert opinion, so the ability to competently communicate their arguments is no less important skill. Ed Catmull says that the rubber stamp “you can't control what you don't measure” is taken too literally by many - too many hidden patterns and interdependencies exist in any data set, so we must realize that often even on the basis of the data we build assumptions.
Very good thoughts on this subject are expressed by Taylor Palmer ( continued): any design activity should be correctly perceived as “learning activity”, and therefore design tools - primarily “learning tools”. Meena Kothandaraman and Zarla Ludin offer a good map of research methods for specific tasks : Map of user research methods © Meena Kothandaraman and Zarla Ludin
For greater clarity of how the product works and what problems it is worth solving, first of all, the customer journey map comes in handy again. Product problems can be shown along the user's work scenarios — it will make the choice to solve specific ones easier. It's great if you mark problems and insights on the map (as you initially create it) with the product manager - this will give a general understanding of how the product works. Scott Sehlhorst and 3M have helpful thoughts on this .
Interaction map showing problems in the interface
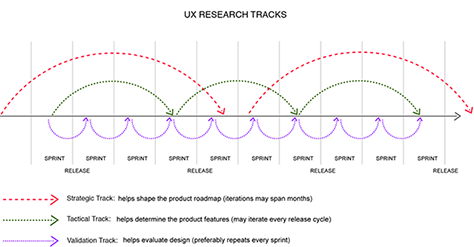
A good way to organize the internal work of the design team along the entire chain from finding problems to proposing and checking solutionsOptimizely offers. They organized a special kanban board, showing a gradual deepening of the problem and solution: Optimizely Kanban Board And Atul Handa and Kanupriya Vashisht show an excellent format for planning research activities in modern dynamic projects . They divide them into three types: strategic (helping to form a product vision, strategic goals and a roadmap, and also segmenting the target audience), tactical (helping to work on specific functions and complex interactions) and validation (testing hypotheses, evaluating design decisions, searching problems). Research in the agile process © Atul Handa and Kanupriya Vashisht
After the design team has helped the product manager to find unresolved user problems and product solutions for them, you need to monitor the roadmap for fixes and verify that the problems have been resolved.
True, absolutely all the problems, bugs and shortcomings of the product can not be fixed. This is an endless process, which, moreover, takes resources from the introduction of new functions. The task of the designers is to evaluate together with the product manager what improvements will give the maximum benefit for business and users.
If you look at the work of the company as a business as a whole, then the overall picture will show where it moves and what problems it faces. In addition to understanding the prerequisites that guide the top management and product managers, the design team will be able to offer directions for the development of services. In the first part of the series I described the contexts of the life of companies - they have different problems, tasks and needs. At each we can be useful in our own way, and our role (as well as tools and methods of work) should be different:
Each of these contexts has its own indicators of the health of the company and its products. If designers help to improve them, they will become even more valuable. And if, in addition to solving business problems, to find and use opportunities for its growth, respect for the design team will become even stronger.
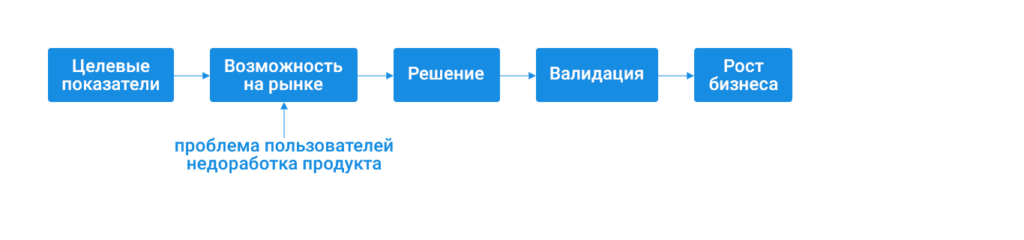
In this context, the prism “problem → solution → validation” will become more complete - “business targets → opportunity on the market (user problem or product flaw) → solution → validation → business growth”. And this is a common language in which designers will always understand management - many interface changes can be tied to business values.
In addition to the life cycle stage, it is important to understand the business model of the product (direct sales, subscription, freemium, open source, advertising, partner club, mediation, franchising, crowdsourcing, auction and reverse auction, leasing, etc.), level of competition, type of market (B2C, B2B, business with the state or non-profit organizations), its condition (existing, new, regional clone) and segmentation (by price or niche). This greatly influences distribution and marketing, the choice of metrics, and hence the focus on user and business issues. What ultimately determines what value the company expects from designers.
There are a number of metrics for assessing the health of a business as a whole and specific products. They will show whether the product has problems to solve. These metrics display the current status and help assess growth prospects. In the general sense, “ metric ” is a collected and measurable assessment that allows you to track the effectiveness of a certain criterion of a product or business over time. The metric says that something happens, and its analysis - why it happens.
Metrics can relate to the entire user base, as well as to specific segments of the audience. Understanding the percentage and absolute number of users whose problem is solved by a new function or improvement of an existing one is another important part of the common language between the designer and the product manager. Abstract improvements for abstract people are harder to sell.
The most direct indicator of the success of a commercial product. Depending on the business model, stage of business development and product features, you can consider earned, spent and saved money:
Their calculation is the subject of a separate article. I touched on some of this in my publication on UXmatters a few years ago . And although design decisions often influence them only indirectly, it is important to always remember about monetary metrics.
The attitudes of users are often indirect indicators, but they reflect well the attitude towards the company and products. If you follow their changes, you can predict monetary metrics.
If satisfaction is tracked with a delay and shows rather the long-term health of the product, then engagement and retention rates are more dynamic and well suited for tracking the response to improvements. The chain is approximately like this: “involvement → recurrence → satisfaction → recommendation”. At the same time, involvement is rather a collective name for a broad group of metrics that are often unique to a particular product. Many large services groped their criteria for user activity leading to long-term use. Oleg Yakubenkov gives several examples :
Invesp write that 44% of companies focus on attracting users against only 18% of companies focusing on recurrence . While the cost of raising exceeds the cost of withholding five times. This is a useful reminder for designers to focus on. Samuel Hulick shows how to build onboarding for better return . And many growth hacking experts advise focusing on the analysis of those users who stayed and not gone - this gives a clue about the value and those usage scenarios that should be developed and made more explicit.
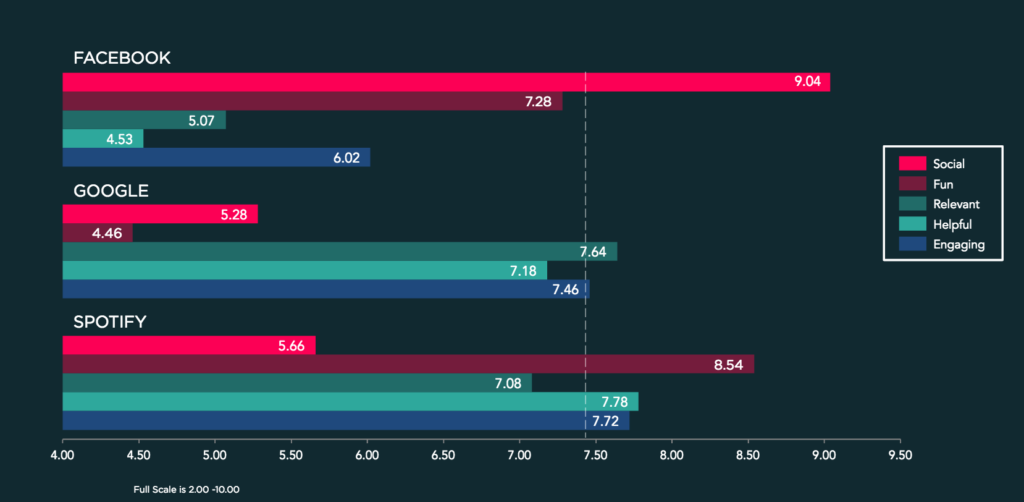
Other interesting examples include Fjord, which use the Love Index to assess brand attitudes, consisting of five aspects of FRESH (Fun, Relevant, Engaging, Social, Helpful). Using ethnographic research and user surveys, they assess how users perceive key product use scenarios.
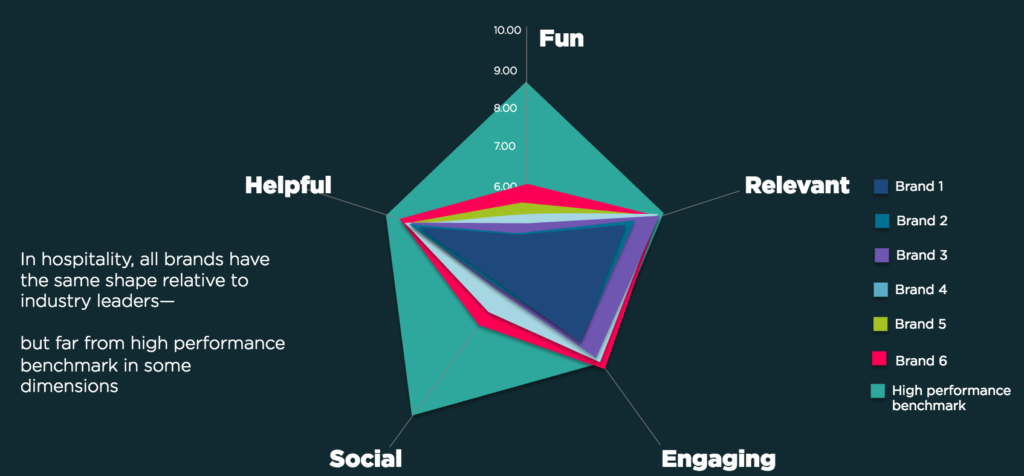
Love index fjord
However, we must understand that the struggle for satisfaction does not always lead to an increase in profits and market share - this is evident from the comparison of the Design Value Index graphs and the analysis of the American Customer Satisfaction Index from Bloomberg at the beginning of the article. Paradoxically, but quite often the opposite is true - money spent on increasing loyalty and satisfaction, not only does not give predictable returns, but also worsens the position of the company. Indeed, in competition, a product can win by price, assortment, and other factors. Therefore, I note once again that it is important to understand the peculiarities of your company's business, before taking ready-made recipes.
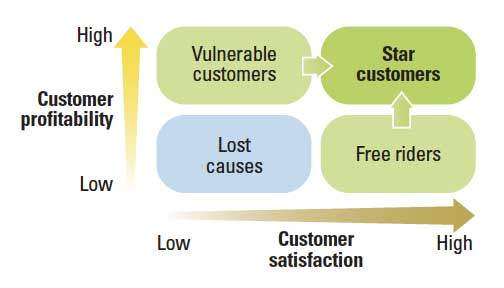
User satisfaction and profitability © MIT Sloan
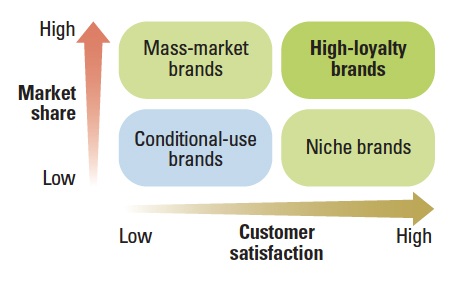
The importance of user satisfaction for different types of companies © MIT Sloan
A similar problem with your favorite designers "delightful details", seeking to cause delight and increase loyalty. The article by Matthew Dixon, Karen Freeman, and Nicholas Toman gives disappointing facts - exceeding expectations, for example, in the form of free delivery or a gift, makes customers little more loyal than just the usual fulfillment of obligations. If you take two conditional cakes with things that increase and decrease loyalty, respectively - the product and brand will dominate the first (despite the fact that the service takes up a small part of it). But in the second, the quality of service is the main reason for the negative attitude. But this is the topic of the next group of metrics.
Internal indicators of the stability of the product and the quality of its implementation for all components - functionality, marketing, support. Indirectly affect the attitude of users to it and, ultimately, the money.
The integrated usability indicators work well here, which take into account several factors at once. Either standardized, like SUS , SUPR-Q, and SUM , or tailored to the needs of specific companies, like ICU / ICU (Integral Criteria of Usability) from UIDG or TPI (Cisco Task Performance Indicator) from Cisco. The principles of the latter are well described in the article Gerry McGovern . They can be tracked over time in order to assess the improvement in consumer qualities of the product, or to compare with competitors in order to assess competitiveness. By the way, for the interest you can see the classic integral quality metric RATER (initially SERVQUAL ) - reliability, assurance, tangibles, empathy, responsiveness.

Cisco Task Task Indicator © Gerry McGovern
In the previous group of metrics, I ended up with the fact that the quality of the service is capable of greatly dropping user loyalty. Harvard Business Review talks about CES (Customer Effort Score) , which affects repeat purchases more than satisfaction and NPS. It shows how easily the client solved his problem with the product. Designers need to remember that in addition to the main interface of the product there is support, distribution and other components of interaction with the company that affect the business.

The impact of quality support, NPS and satisfaction on repeat purchases © HBR
Metrics that talk about the long term company. If there is simply no space for growth, then the overall strategy needs to be changed - otherwise product improvements will bring little benefit.
As applied to startups, they often talk about the importance of getting a product into the market. Marc Andreesen writes that a strong market with a large number of potential customers is able to pull the product out . He divides the life of a startup into two stages - before entering the market (when it is necessary to adjust the concept, the team and the choice of the market often and quickly) and after (when there is a normal development of the company). Andy Rachleff says that the main killer of companies is the lack of a market and it doesn’t matter whether a strong team works in a weak market or a weak one in a strong one - only the market is important.
This is also important for mature companies - the market may collapse or become too competitive. Christina Wodtke gives a matrix of markets for the importance of customer problems and the frequency of its occurrence: the ocean (it is easy to achieve profitability, although it is important to find your niche), a swamp (many people without special preferences, so you need powerful marketing), a well (high margin, but small volumes) and desert (little chance). Designers need to understand where the company is located and what problems it will bring to its solution.
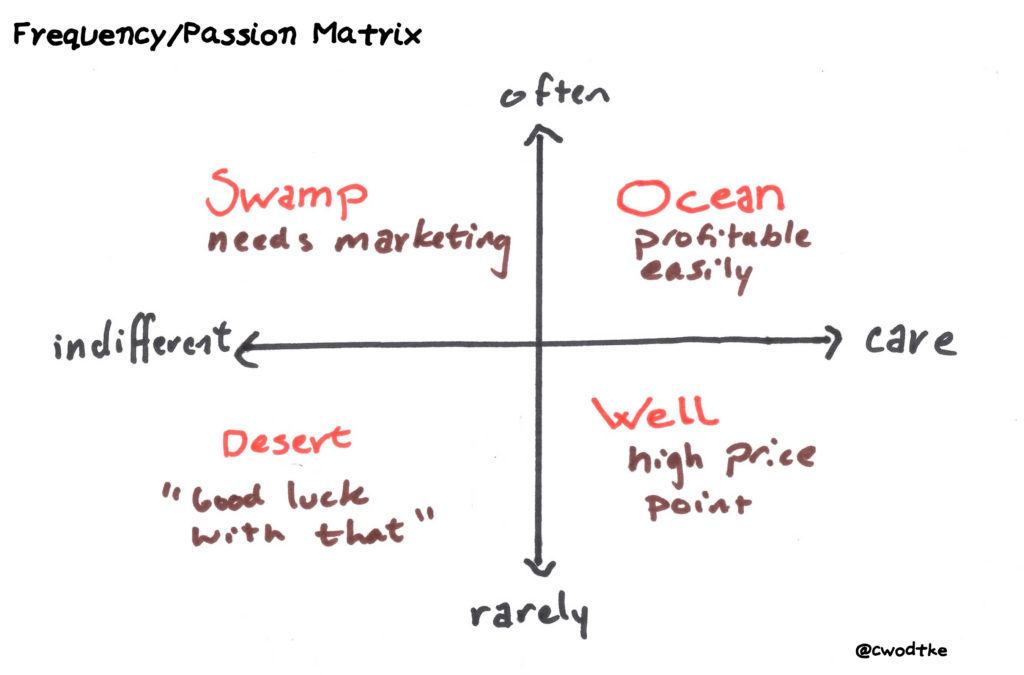
Market Matrix © Christina Wodtke
In addition to metrics, there are common brand values — principles, a manifesto, and other ways to describe why a company exists. This is a high-level filter that helps to choose among all initiatives those that are close to the brand in spirit and competence. And then - and specific solutions to problems. Otherwise, entry into the market may become too expensive and risky.
Erik Roscam Abbing and his company Zilver Innovation consider all initiatives and solutions from the point of view of the brand :
Innovations coming from the brand © Zilver Innovation
Take a look at Facebook and Google: who is better at creating devices, and who has social networks?
Between these five groups of metrics is approximately the following link:
Chain of metrics
You can track changes in this chain along three sections:
The first cut is the main working tool. You set the period for which the metric changes. Then see what effect the changes in the interface gave. For example, did the return rate increase in a month or did the number of registrations increase in a week. Small products need more time for the number of users in the experiment to become statistically significant. Whatsapp Monster gets about 700 registrations per minute and can conduct tests almost in real time. By the way, statistical significance is important in all dimensions. And also a sober assessment of growth opportunities - somewhere an increase of 20% will not be noticeable, but somewhere + 2% will give an explosive effect.
It is also useful to have counter-metrics for key indicators - so you make sure that you do not harm the product. For example, the number of registrations may increase due to a new distribution channel, but the involvement of these users may be too low.
It is also necessary to distinguish metrics from signals like the number of page views per day. They are needed when conducting experiments (for example, whether we began to view the movie page more when adding a link to it on the news page) when we are solving a specific task. Or if the company's critical indicator is built on such a signal (I gave the above example of Facebook , where a potentially active user adds 10 friends in the first 7 days). But in any case, our main task is to improve the key indicator and in another experiment we will need other signals. Therefore, do not give them too much attention, otherwise you will dig in the flow of useless information. Or even worse - you will start to solve problems like a high failure rate in panic, without understanding the broader picture of the user interaction with the product .
Ultimately, designers want their proposals to fall into the design plan. True, many have met one of the following reactions of the product manager to product development proposals :
Common language and problem visualization are part of the answer to such objections. The second part is participation in the selection of priorities for product development and the preparation of a product plan (roadmap). It is good when the whole team has access to it and understands the criteria for evaluating the functions falling into it. This will allow designers to independently check whether their ideas have a chance for implementation.
There is no single standard for product plans, but, as a rule, there are two tools:
Mature in terms of design, the company takes into account among the parameters of assessment and consumer qualities. There are several common ways to evaluate them.
The Kano model allows you to divide product ideas into five categories: attractive (exceed expectations), work efficiency (key characteristics that compare competitors), mandatory (without them, the product cannot be sold), unimportant (do not affect user choice) and negative (in minus product). The most valuable fall into the upper right corner. For the evaluation of ideas and the subsequent placement on the scale can be used to survey users.

Model Kano © UIE
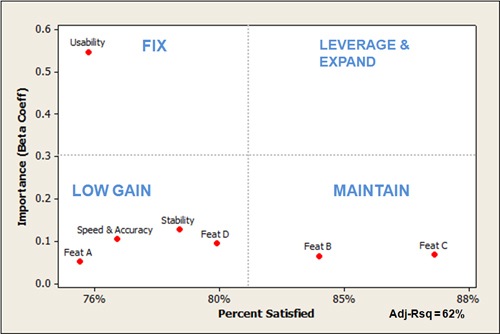
The window of opportunity helps to assess the potential of product ideas due to the difference between the importance of the problem for the user and satisfaction with the current solution. The importance and satisfaction are assessed on a 9-point scale, the total score is obtained by the formula “importance + (importance - satisfaction) = window of opportunity”.
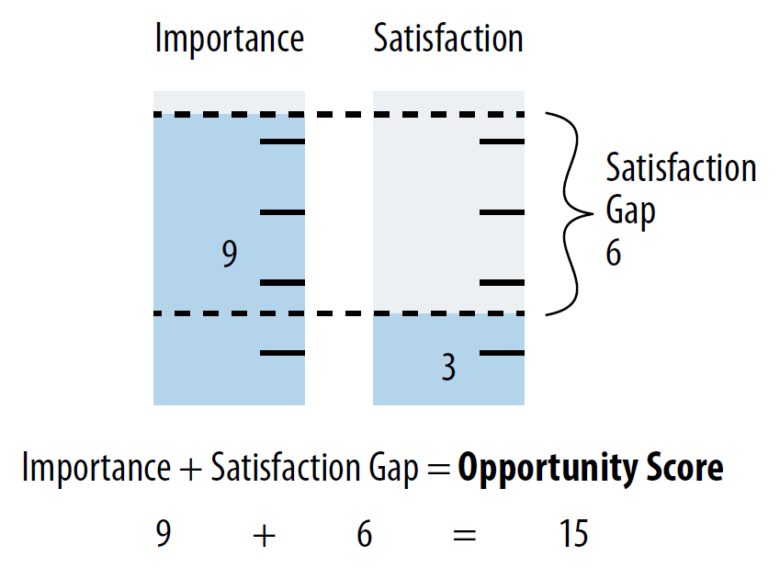
Calculation principle Opportunity gap © James Kalbach
Evaluation, again, can be done through a user survey. It is important to correctly describe the product ideas - in terms of the ultimate value for the user. The most valuable problems for the user fall into the upper left corner:
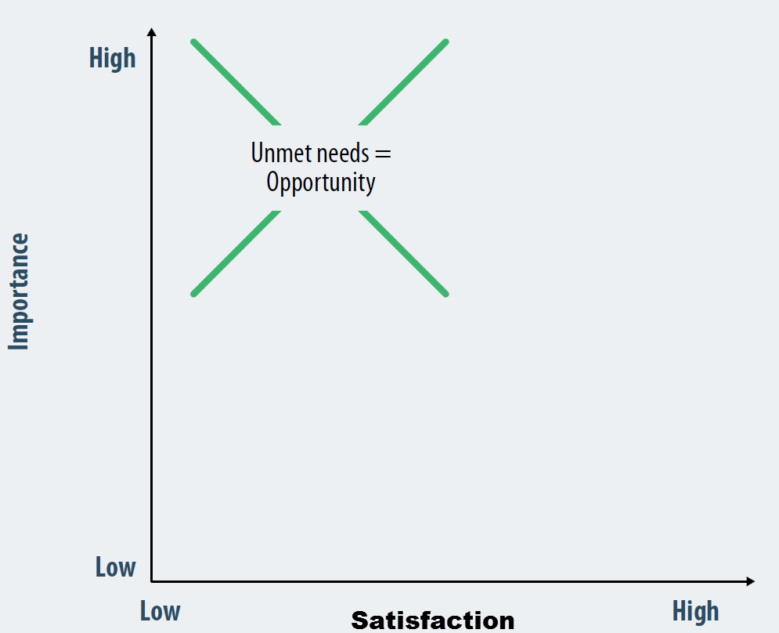
Most Valuable Issues © James Kalbach
Another way to visualize this approach is Jeff Sauro:
Analysis of key drivers © Jeff Sauro
A great example of passing through the whole chain from finding problems to visualizing and prioritizing them is described by Niall O'Connor.

A bunch of user and business issues © Niall O'Connor

Interaction Map with Problem Designation © Niall O'Connor

Roadmap with the evaluation of food ideas on key parameters © Niall O'Connor
The set of the most important indicators now depends on the type of product, the stage of its life cycle and the market - tracking all possible metrics at once is useless. When looking for a suitable market, a grocery solution and a business model for its monetization, recurrence is critical - is it valuable enough? In a period of growing user base and / or profits, it is important to reduce the outflow by optimizing the entire interaction map. In short, key metrics should answer the right questions about the current state and business plans (there is even the concept of Minimum Viable Metrics ). They can be used in the prism “business targets → opportunity on the market (user problem or product flaw) → solution → validation → business growth”.
Prism to evaluate solutions
In order to make work on solving problems more systematic and visual, you can tie key metrics to the interaction map. It will show improvements with the greatest exhaust.

Example of binding metrics to the interaction map
A smart example of using an interaction map to select the most valuable problems to solve is described by Jake Causby from Westpac. At the bank’s office there is a huge map for the whole wall, on which they mark business objectives and highlight key metrics that can be pumped in various ways. These analysts are also marked on the map - they help to find ideas for product improvements. Moreover, the ideas and solutions of competing banks were also noted there. Concepts and prototypes of new interfaces that solve the selected problem can also be placed here. The result is a powerful tool for finding problems and choosing the most effective points of application of effort, which is used by the whole team and shows the whole picture of the client's interaction with the company.
You can log in on the other hand and use the pirated metrics of AARRR (Acquisition, Activation, Retention, Revenue, Referral) of Dave McClure - they show the user's life cycle in terms of the effect on business:
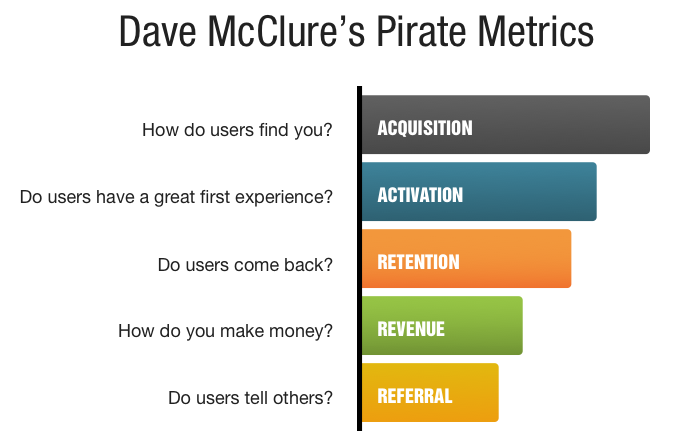
Pirated AARRR Metrics © Dave McClure
In his book Build Better Products, Laura Klein offers a similar model:
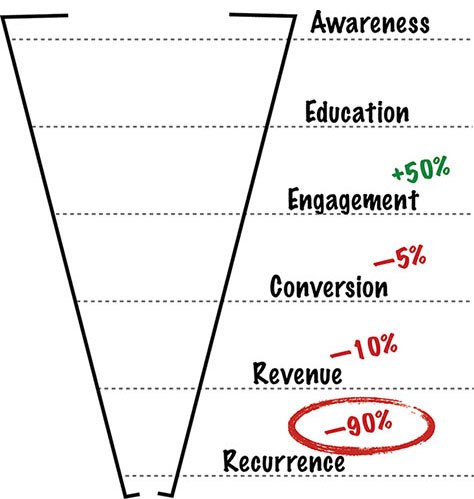
Product Life Cycle Funnel Funnel © Laura Klein
Another model that visually represents the health of the product is HEART (Happiness, Engagement, Adoption, Retention, Task Success) in the prism of “goals → signals → metrics” from Google Ventures. It takes into account not only money, but also the attitude of the user to the product.

HEART Framework © Google Ventures
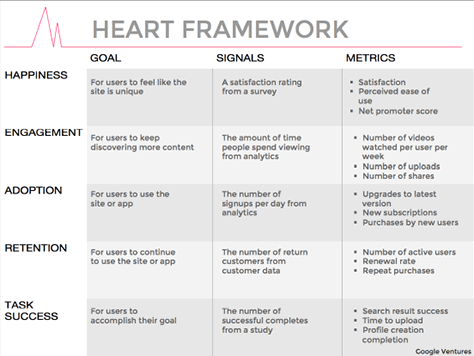
Version of the framework HEART © Pamela Pavlichak
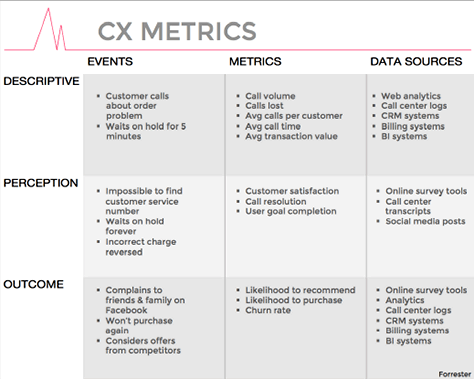
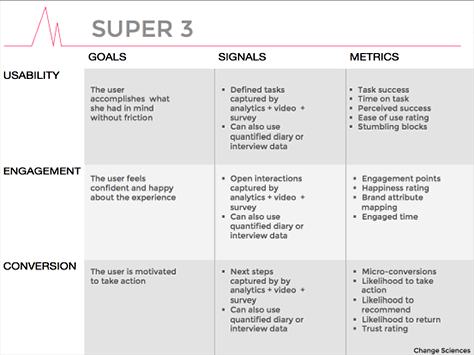
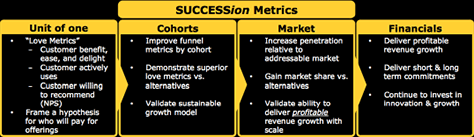
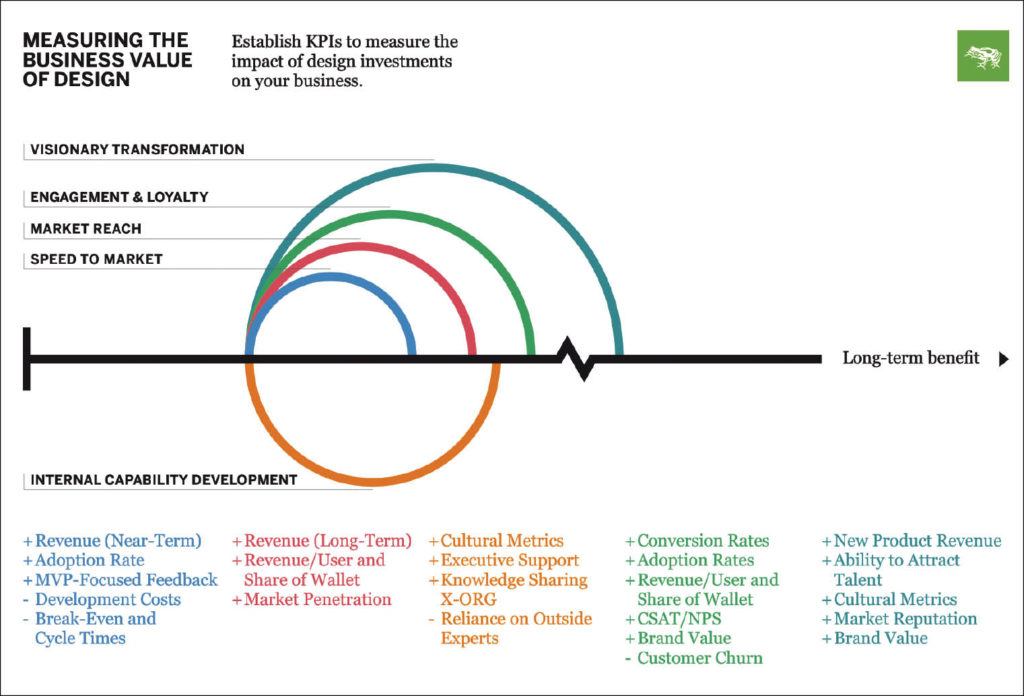
Pamela Pavliscak in his master class at UXSTRAT 2014 presented in a similar form a few more models - CX-metrics from Forrester and Super 3 from Change Science. The Forrester model , proposed by Daniel Brousseau, places particular emphasis on the user's perception of the brand and the entire interaction map. Pamela presented them in the prism “events → metrics → sources”. These metrics are more abstract, but can be useful. Forrester CX Metrics in the prism of “events → metrics → sources” © Pamela Pavliscak Model of Super 3 metrics © Pamela Pavliscak Intuit uses an interesting approach with its SUCCESSion . Intuit SUCCESSion metrics model Our own model is also used by frog design : Model for assessing the impact of investment in design on business © frog design Another well-known framework “
See, Think, Do, Care offers Avinash Kaushik. First, users have a potential audience for your market, then they start exploring products on it, then they buy it, and in the end they become loyal customers:

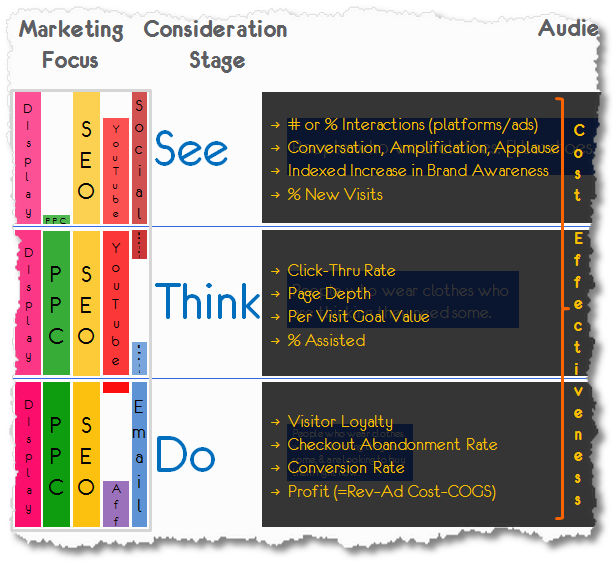
See, Think, Do, Care © Avinash Kaushik
AIDA and other models from the world of marketing and advertising are hardly applicable to interfaces, but it is useful to know them:
These models are rather a reference point, you always need to know the specifics of your product. The initiative for choosing a ready-made model (or creating one’s own) should come from the product manager - he is the main responsibility for success. Although the design team also has the right to vote, because it must understand the metrics and use them in the work on the design. The main thing - the health indicators of the product will become clearer.
It is important not to overdo it - metrics help make decisions, but do not always dictate them. Data has its limitations and can not answer all the questions. You will always need to balance between analytics and user research, as well as just expert opinion. But this is another important step to ensure that the design speaks with the business in the same language.
A common question that many design managers are asking is: how to show and prove the design ROI? If we talk about the activities of the team as a whole, then I wrote about this in the fourth part of the series . These are both general indicators of the quality of work (whether we are in plans, whether there are complaints about quality), and the value brought to the company (whether products and attitudes to the brand have become better, what insights about users we give to product managers).
If we express this in a more specific value for a product, we can take metrics from two groups as a basis: the user's attitude to the product (recurrence and outflow, satisfaction and NPS, involvement, brand awareness) and the quality of the product (compliance, SUS, integral metrics usability). Although, as Mauro Porcini of PepsiCo says,As the level of maturity of UX increases, designers need to prove their value less and less - a company with a strong design culture understands its importance.
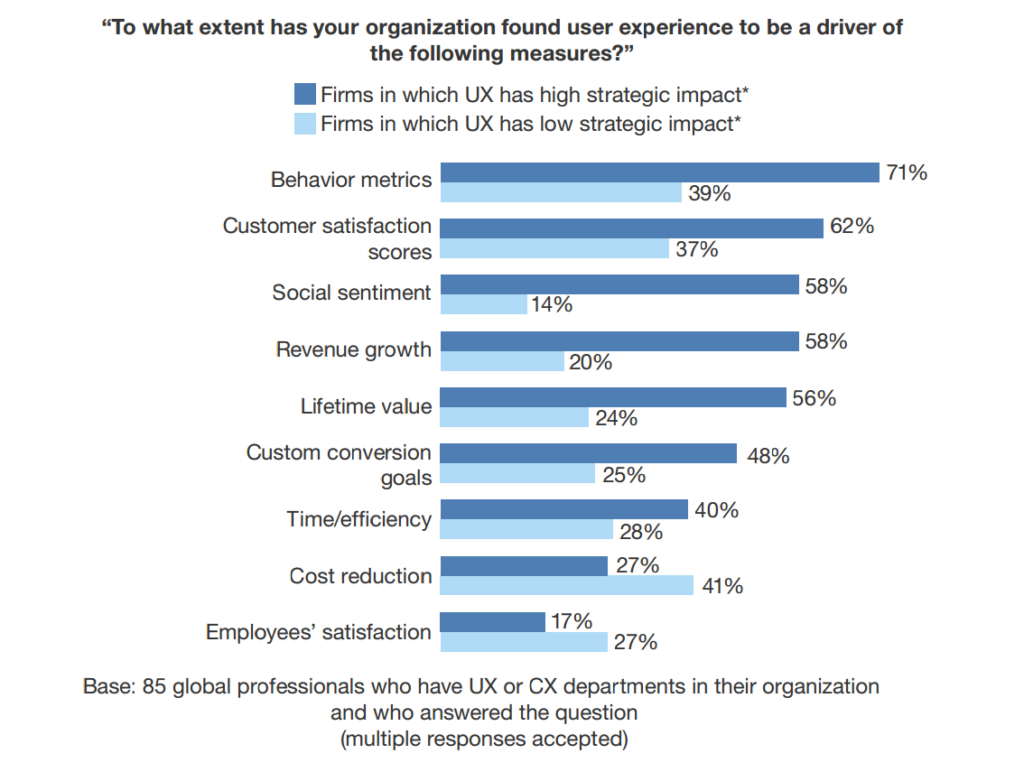
Leah Buley is already conducting a second study of design teams on how their work is different in companies with different levels of UX maturity (the original was done within Forrester). The graph shows that everything starts with simple things like saving resources and efficiency, but the real impact on the company's strategy is the metrics from the “money” group and the “user's attitude to the company”. How do companies of different degrees of maturity UX see the effect of design on key indicators © Leah Buley
When all the low-hanging fruits are torn off and simple ideas no longer give a break from competitors, and standard patterns for solving problems show less and less effect, there comes a need for innovation.
In the mass consciousness, “innovations” are understood as major technological breakthroughs with a large wow effect, even if they are not widely spread. If behind this there is also a genius-inventor, mythology only enhances the cliché, and the designers salivate and disable critical thinking. While the routine and not very impressive-looking work on the creation and maintenance of infrastructure often brings people much more benefit.
Real innovations are solutions to complex problems, made commercially successful for the first time. They directly affect the lives of millions of people. Therefore, you need to look in the direction of frequent gradual improvements. After all, they ultimately add up to breakthroughs and, if you put them on stream, you will more often accomplish mini-revolutions in the industry.
In this section, innovations can relate to completely different things - new functionality or technology, a breakthrough interface, unexpected ways of distribution, price reduction and costs, alternative ways of monetization, and entry into new markets. Potential breakthrough points can be seen on the Alexander Osterwalder business model map or its numerous variations. It is designed for new companies and products, but will help to analyze existing ones.
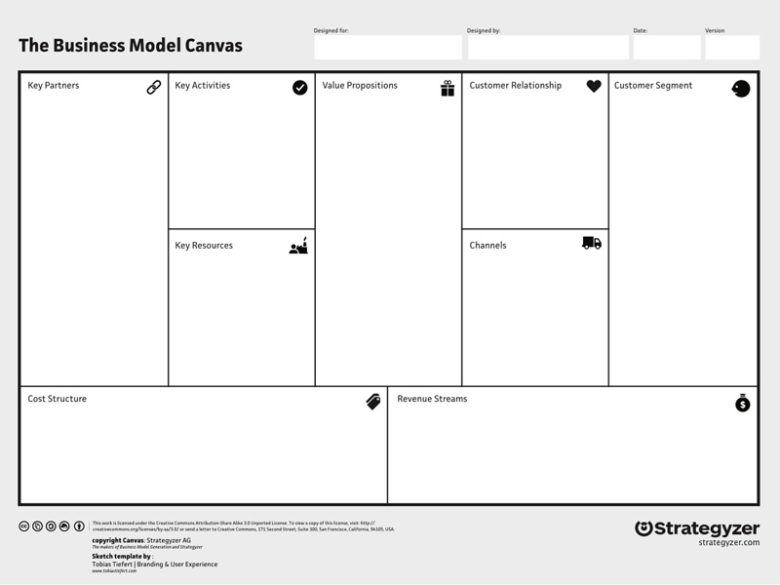
Business Model Canvas © Alexander Osterwalder Lean Canvas © Ash Maurya Potential growth points for designers:
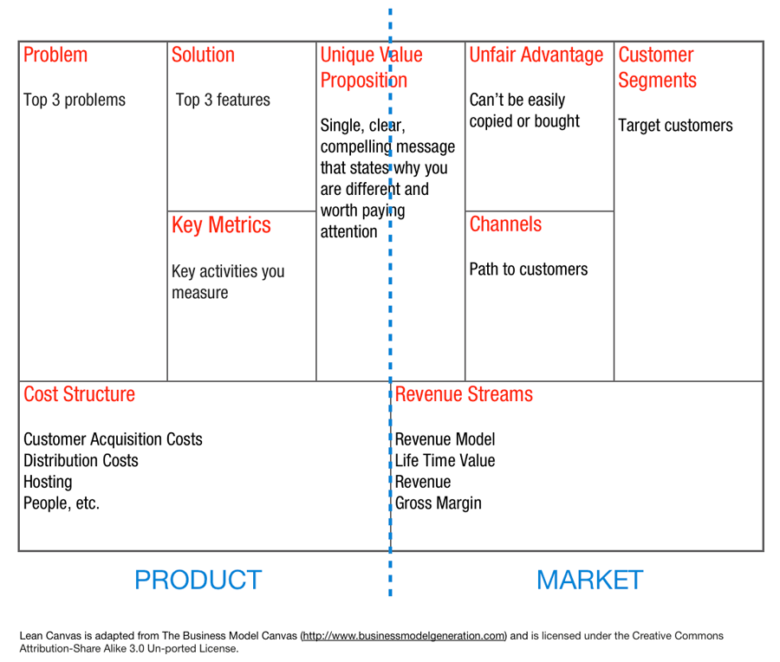
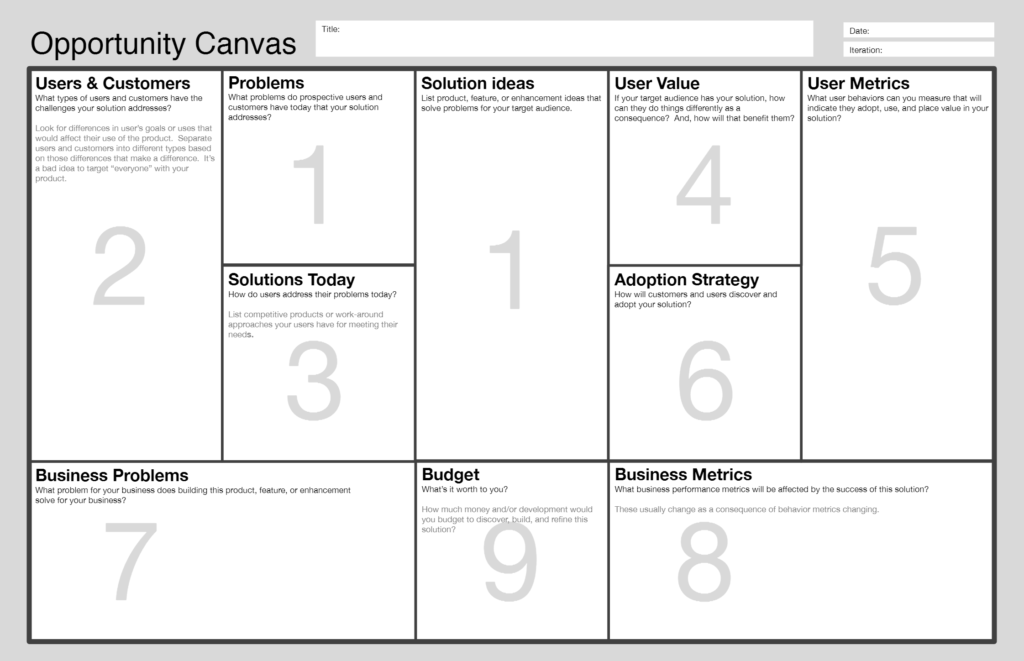
In the section on prioritization, I mentioned the concept of “windows of opportunity” proposed by Anthony Ulwick. In his article for the Harvard Business Review, he provides an excellent example of how this approach helped Cordis significantly expand its market share through innovative solutions. Analysis of windows of possibilities © Anthony Ulwick Opportunity Canvas © Jeff Patton Another interesting way to evaluate the possibilities is offered by John T. Gourville. The success of innovation often depends on how big a change in the current user behavior involves a new solution. If you compare them with changes in the product itself, you can divide the decisions into 4 categories. The complexity of innovation ©
 John T. Gourville
John gives several examples: Changing user behavior for innovative solutions. It is a new way to make it possible to make it possible. ). 9x effect © John T. Gourville
Designers know a lot about users and if we learn to deliver insights to decision makers, it will help us find more opportunities and better assess their importance. Mailchimp and Intuit have successful examples. Mailchimp designers have built a powerful knowledge base that combines knowledge of users from a variety of sources (user research, analytics, feedback, research of competitors and the market, etc.), which allows you to quickly get answers to many questions.
Mailchimp User Knowledge Base
If these opportunities and insights are considered not within the framework of point problems according to the map of user interaction with the product, but in conjunction, i.e. as an improvement in key scenarios entirely - you can go beyond incremental improvements. For this, it is important to have a well-coordinated interaction between roles and divisions, because growth points can relate to various parts of the product. Alex Rawson, Ewan Duncan, and Conor Jones describe many good examples of such system work .
In order for such interdisciplinary interaction to be possible, some companies systematically develop a culture of innovation. Adobe, Intuit and CSAA Insurance Group have created special innovation toolkits for employees who teach methods and practices to search for both incremental improvements and more serious breakthroughs. Innovations of both types are possible only in companies that have created a suitable culture, one of the key features of which is the ability to try and make mistakes without consequences for a career. There are many windows of opportunity for designers in this, both in terms of applying research methods and prototyping beyond the usual framework of the interface, and in terms of the development of the culture itself.
User research and analytics are powerful decision support tools. The more such support comes from us, the better the company's solutions and we are more valuable as designers. And the closer the language of designers to the language of business. After all, with a common language, it will turn out to “marry” the goals of business and users. For product managers, such a language is key business indicators. For designers - interaction cards.
Total:
You will bring even more good to users when you start to choose interface solutions not only with your heart, but also in accordance with business success indicators. People vote with a purse and commercial success is a good indicator of the benefits brought.
PS It is important not to forget your roots and not turn into a soulless metrics optimization machine. We need a healthy compromise in the interests of business and user, commerce and aesthetics. Otherwise, in pursuit of numbers, the quality of the design will fall.
The article is written for the magazine UXmatters (part 2 on the way).
Common language of business and design
Designers defend the rights of the user, but appeal to things that are incomprehensible to managers - best practices, guidelines, someone else's experience, or simply “first, it’s beautiful”. They can not always shift them to their product. Laura Martini makes the correct analogy : accountants do not say they earn money by filling in the tables of incomes and arrivals, and personnel officers say that they get money for calls and letters to candidates; they talk about business value - healthy finances and strengthening teams, respectively. It is better to translate the pain of users into the language of business, rather than continue to argue - then everyone will be happy.
')
One example is the Design Value Index . This is the capitalization index of companies investing in design - in 2015 it grew by 211% more than the S & P 500 stock index.
Design Value Index, 2015 © DMI
Not really. Bloomberg compared the American Customer Satisfaction Index and the market dynamics of 190 leading companies - the opposite is true .
Comparison of American Customer Satisfaction Index and market dynamics of 190 leading companies © Bloomberg
In fact, both are right index. In a competitive B2C market, product and service quality is very important for market success. But if sales are little dependent on the end-user opinion (monopolistic industries, government services, corporate software with centralized procurement), other patterns work. In addition, investments in product quality are aimed at the long term, they will not show a quick result.
Therefore, it is not enough to refer to the success of other companies - their business may work on other principles. You need to soberly assess the current situation and understand where the design can benefit the business. Otherwise, you will remain a pixel engine or a toy in the hands of management.
Solving business problems is the main task of designers after the most basic - assistance in product development. Companies, of course, it is important how well we do our work - the design should not delay the launch of products and their updates to the market, and its quality should be decent. But this is only a small piece. It is even better if designers help businesses make better product decisions. Or even find new opportunities for growth.
This is what will allow the design team to become not just a performer and advance along the maturity model from operational (how well a specialist does his job) and tactical levels (how well the product production process is built) to strategic (where and how successfully the company develops). In the end - to influence what the company is doing and why.
Design should solve business problems
Designers often complain that they are not attracted to the work of defining a product. Requirements come from managers and they just draw pictures. Somewhere this is due to the immaturity of the company and management, somewhere - the weakness and short-sightedness of the designers themselves.
Start with yourself - you need to increase the credibility of the design team and not leave tails, solving basic problems at the operational and tactical levels (I have written enough about this in 2-4 parts). But if you want to influence the product - fight! It is important to show and prove the value of design - we know a lot about users, and this is important for product managers to make decisions. Then you will be invited not only for the production of models and prototypes. WeWork's Bobby Ghoshal says that 80% of design decisions are taken out of pixels — in discussions, presentations, meeting meetings, and so on. - and it is important to be able to argue your ideas.
Melissa Perri and Scott Sehlhorst show that the product manager and designer overlap in many ways. Some of this concerns quite familiar design artifacts that designers have been successfully making for a long time. But the most important thing is user problems. To be able to find them, assess the importance for customers (goals, context, motivation and opportunities) and the business itself (product strategy, competition, organizational potential, etc.), and as a result - the ability to offer and visualize the future in which the problem is solved - here are the key growth points for a design team aiming for a mature UX.
Common language and problems © Melissa Perri
In a mature company with cross-functional teams, designers help product managers make decisions. Where and what? Imagine an idealized process of working on a product:
- Product hypothesis . Search for unresolved user problems that our product could close to increase business performance.
- Preliminary validation . Analytical assessment of how demanded and commercially such a product can be.
- Design and development . Production of a product or functionality at the right time and quality.
- Testing the solution . Preliminary assessment of how the product is suitable for the target audience.
- Distribution of the product . Attracting users through different channels and markets, possibly with different promises and values. Plus the organization of the seamless transition of the user between the channels.
- Feedback from the market and users . The actual assessment of the product and the introduction of changes to it, whether it is the implementation details, the possibilities or the concept / target audience as a whole.
- User support Solving problems arising from the use of the product, with which users contact support services, social networks and other channels of communication with the company.
The idealized process of working on a product or functionality
The model of developing products and their new functions over the past 10–15 years has become increasingly dynamic, so this scheme is rather arbitrary - full of both more iterative and more conservative examples. In addition, in the real world, the first stages are often shortened to the finished product plan. But this does not change the essence.
Lean model of the product or functionality © Jason Evanish
If along the entire chain, designers will always remember why the company solves specific problems and how these decisions affect the business, the focus will shift from project artifacts and methods to product work. And finally, we will not only solve development problems, but will influence key business indicators and, perhaps, even introduce innovative ideas. This transformation of the role of designers consists of three stages:
- Assistance in finding and solving business and user problems.
- Evaluation of maximum exhaust when solving problems.
- Transition from problem solving to innovation
Step 1. Help in finding and solving problems.
If we take product development beyond the brackets, then the product team and its manager have three main tasks:
- Find unsolved user problems (problem space)
- Understand what and how to do to solve a problem (solution space)
- Assess how well the problem is solved (how to develop the product)
They can be represented as a “problem → solution → validation” chain. The product team will go through it more efficiently with the help of tools that UX-specialists have. Many companies are beginning to integrate designers from the last stage, organizing the process of usability testing - it is relatively simple, and the exhaust is immediately clear. But if you join in all three, you can dramatically increase the value of the work of designers.
1. Find unresolved user problems
One of the ways to launch new products and develop existing ones is to go from the still unsolved problems of users. If the potential audience is large enough and there are prospects for monetization, the company can offer them a suitable product. What the product manager does in this case:
- Market assessment (capacity in money and audience, main competing products, typical business models, growth prospects, domain map).
- Competitor research (market share, business models, product functionality, marketing).
- Functional matrix (comparison of functions that are in competing products).
- Evaluation of the target audience (segmentation, preferences, expectations, problems, solvency).
- Building a business model .
The advantage does not always come from the product itself (somewhere a competitive struggle is won by a cheaper price or new distribution channels; someone starts with technology). But if the matter is still in him, then the design team can greatly help the product manager:
- Research users and their needs . Ethnographic research, interviews, surveys, diaries, focus groups, work with analytics will give a lot of useful information about the importance of problems and features of the target audience (segments, behavior, motivation, context, mental and consumption patterns, expectations, fears and prejudices).
- Analysis of competing products . Comparative usability testing, expert and heuristic evaluation and user research methods from the previous paragraph. They will show how well problems are solved by other companies in the market and that users find particularly important.
To formalize user problems, the Jobs to Be Done method is increasingly used. Intercom and James Kalbach are writing a lot about digital products about it now. Job stories show what life situations cause problems for users (functional, emotional, social) for which they are ready to pay. A similar approach to finding and describing potential problems is described by HubSpot .
Job story © Alan Klement
Model Jobs to Be Done: 4 forces © IntercomModel Jobs to Be Done: Life Cycle © Intercom
Model Jobs to Be Done © James Kalbach
Jobs to be Done are also a way to segment users according to their needs. Previously, designers used characters for this, but this tool has recently lost its former glory - few people use them effectively throughout the work on the product, and not just at the beginning. In addition, JTBD has a clear focus on problems, while characters often spend a lot of time describing personal characteristics, moreover, taken from the head, not from user research. Problems are easier to use as a filter for subsequent product decisions. Although the characters are still well pumped empathy to their users from the grocery team. And if the segmentation of the audience of the product is quite clear, the characters in conjunction with JTBD will be an excellent tool.
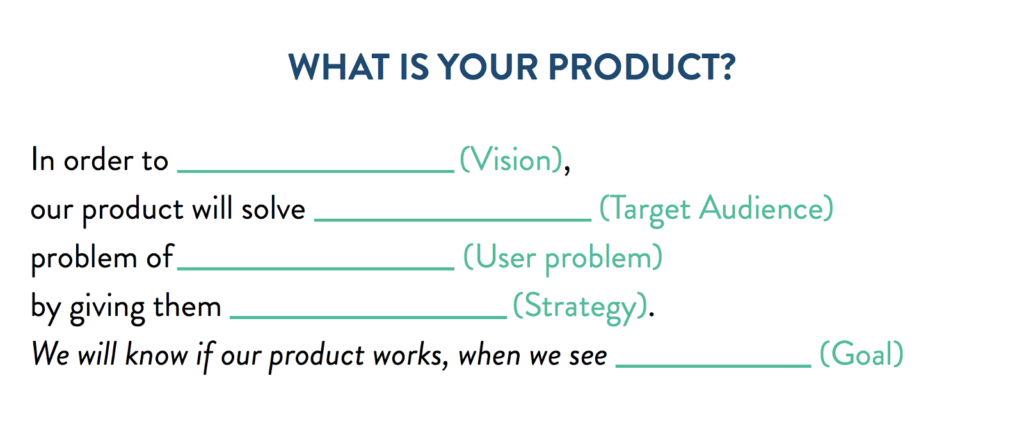
Value Proposition Canvas facilitates the similar task of linking the description of a user's portrait and his problems. This approach shows how a business plans to solve user problems through providing value to them.
The Value Proposition Framework Canvas © Alexander Osterwalder
A good tool for a more detailed analysis of user problems is the customer travel map (product interaction map) and the experience map (a more abstract process of solving a life problem). This is the language of designers, which is useful to teach managers (and the most advanced of them have already tried it out). Although in addition to these two formats, service blueprints are also distinguished (as the company provides service), many experts advise not to be killed about semantic accuracy and pattern matching - the main thing is for the card to help in its work.
Customer Journey Map © Macadamian
Experience Map © Beth Kyle
Such cards show how the user solves his problem now (in a particular product and outside of binding to it), noting the key stages of this scenario, as well as positive and problematic places in them. They may include the full cycle of the client’s purchase of the product from its awareness of the product to active use and recommendations to friends, or interaction with a separate large piece of service. If we are talking about a new product of the company, the map will help to present its main functions; if about existing - will show the bottlenecks, the solution of which will allow to develop it. Moreover, the card affects both the digital product and accompanying services in other channels of user interaction (including offline). And this is a deep look at the problem, giving even more useful information for decision-making.
The interaction map does not have to be complex and spectacular, as in the examples above. The main thing is that it helps to visualize user problems.
Customer Journey Map in a simplified version © Shopify
True, exhaust depends on the complexity of use cases. One-page promotional site is better to include in the general map of interaction with the product that it sells - interaction with the landing itself is too primitive. If the product processes a lot of scenarios, but it is still atomic (for example, an Internet search) - rather complex analytics and behavioral segmentation of users will help.
In reality, companies often come from opportunities in the market, quickly launching a product and iteratively developing it, and the understanding of users comes later. In this case, many angles are cut off and no user studies are performed. But for successful product growth, the need to understand your customers is important, so the product manager will return to these issues sooner or later. Moreover, the focus of mature companies is increasingly shifting from solving problems to finding them, and without an understanding of users, these possibilities are limited.
2. Understand what and how to do to solve the problem
When the problem is studied well enough, and its importance and value to users is large enough, the product manager needs to offer a product solution for the target audience. What the product manager does in this case:
- The vision of the product (how will we solve the problems of users so that the company has commercial success or achieved other goals).
- Product features (functional set, ranked by value for users and business).
- The concept or prototype of the solution (or several alternatives).
- Production, start-up and distribution plan (is it possible to do the first version right away or, first, you need to check the main hypotheses; what team and resources are needed for this).
Here the participation of the design team is more active and we can further help the product manager:
- Evaluation of user attitudes to the product idea . Although at very early stages, when there is not even a prototype, it is difficult for users to assess their interest in the product, there are formats of surveys and interviews in order to probe them.
- Hypothesis testing using a prototype solution . Creating static and interactive prototypes, pseudo-automated services with manual order processing and a lot of what else - there is a large range of cheap solutions. After that, testing: qualitative (interview, usability testing) or quantitative (analytics after launching to a small audience, comparing several solutions) and iterative refinement of the prototype.
Hypothesis testing is a major place for designers to benefit. And thanks to the popularization of the practices of design thinking, companies are increasingly “thinking with their hands”, creating prototypes of solutions. And with the spread of lean approaches, the importance of fast iterative work in the early stages has increased.
Although hypotheses are tested at the next stage, they need to be put at the stage of proposing solutions (and the very formulation of the problem is, in fact, a hypothesis). It is important to understand how we will make sure that the proposed concept really solves the chosen problem of users. To do this, you need to decide on the experiment: the way of testing (as well as which users will see the concept), the success metrics (which statistically significant data from analytics or user research will confirm the hypothesis) and the minimum set of functions (MVP (minimum viable product): which scenarios the concept should work out ). In many ways, this is the task of the product manager, but the design team has many methods for testing hypotheses and, in a mature company, is actively involved in the process.
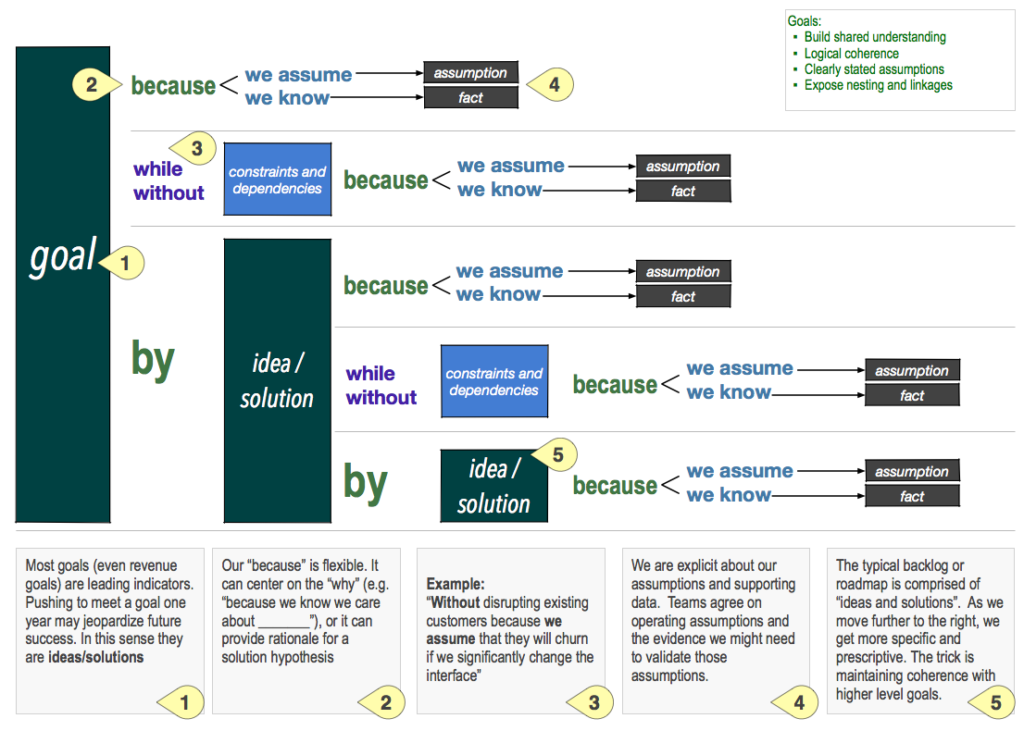
An interesting approach to the description of hypotheses suggests John Cutler.
Hypothesis Description Format © John Cutler
Based on this, it is possible to vary the degree of development of the prototype, depending on the hypothesis itself and the process stage: from a rough demonstration of the key steps in the form of block diagrams of screens to a complete customer journey map on real data, including initial training. The relevance for the current project stage and the depth of understanding of the product and users are important here.
An interesting format for describing a bunch of problems and solutions is offered by Nikkel Blaase.
Format for describing problems and solutions © Nikkel Blaase
3. Assess how well the problem is solved.
When the product approaches the launch and after the release itself, the manager needs to make sure that the quality of the implementation is up to standard, and the users understand how to work with it and are happy with the result. What does he do in this case:
- Verification of the initial hypotheses (whether the product is in demand by the market, whether the business objectives are resolved, how good the basic indicators are, whether the product meets the users' expectations (initial and formed by our marketing)).
- Evaluation of the quality of the implementation of the product (whether everything works, whether important functions or interface elements are forgotten, whether the interface and the conceptual model as a whole are clear to users).
- Product development plan (ranked list of problems and solutions for them; plan for the implementation of improvements).
In a lean environment, the transition from hypothesis and MVP to the early version of the product and its release is not always clear, therefore, steps 2 and 3 can be difficult to separate. But in general, this is a classic task for the design team, when we help the product manager to improve it:
- Search for problems in the product . User testing, expert and heuristic evaluation, analytics allow you to test hypotheses and detect problems.
- . , — , .. — .
- . . , - roadmap.
This is bread and butter for food designers and custom researchers; the first role for which they are involved even in not the most mature companies. The format of the work is simple and straightforward, although it is often not easy to make changes. Young design teams can start from this side, and then get involved in the grocery work deeper. At the same time, it is important to involve product managers in user research and testing themselves as observers. They will see problems in the product with their own eyes and will trust designers more (and you will be interested to see all five stages of making the inevitable).
True, to test and analyze all the hypotheses will not work. It is important to learn how to matchthe amount of new information that the team will receive after the survey, and the time and resources needed for this. Often we can only rely on expert opinion, so the ability to competently communicate their arguments is no less important skill. Ed Catmull says that the rubber stamp “you can't control what you don't measure” is taken too literally by many - too many hidden patterns and interdependencies exist in any data set, so we must realize that often even on the basis of the data we build assumptions.
Very good thoughts on this subject are expressed by Taylor Palmer ( continued): any design activity should be correctly perceived as “learning activity”, and therefore design tools - primarily “learning tools”. Meena Kothandaraman and Zarla Ludin offer a good map of research methods for specific tasks : Map of user research methods © Meena Kothandaraman and Zarla Ludin
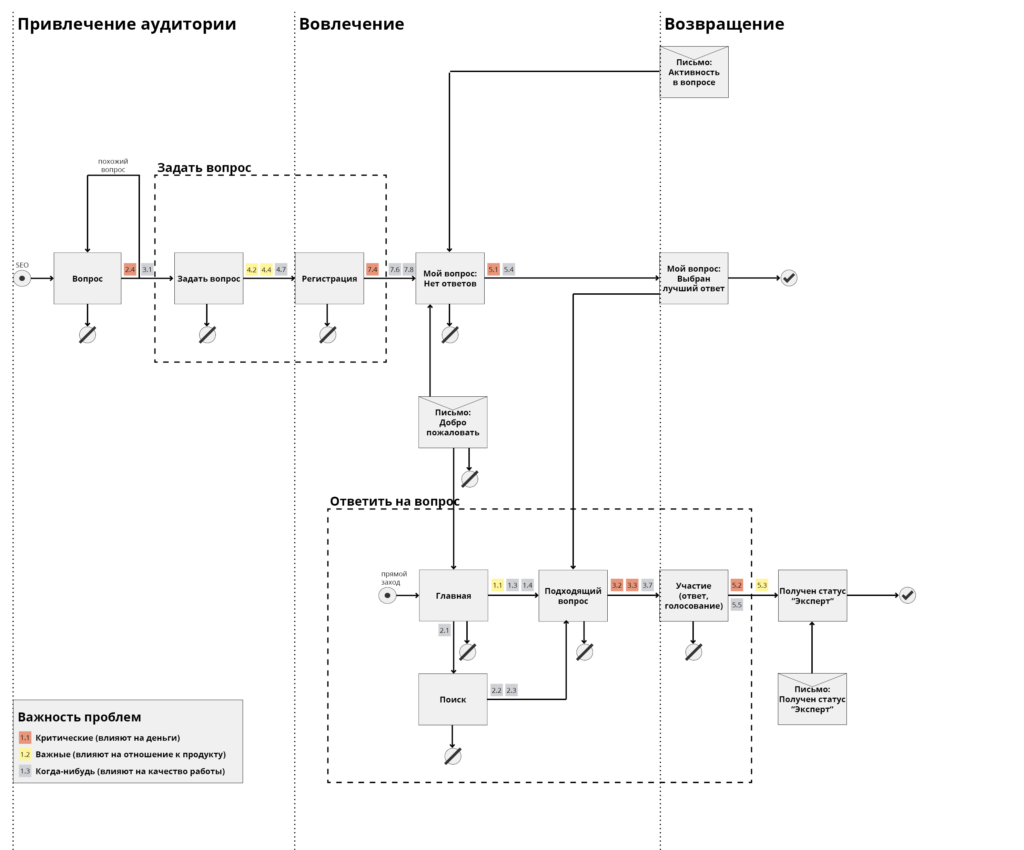
For greater clarity of how the product works and what problems it is worth solving, first of all, the customer journey map comes in handy again. Product problems can be shown along the user's work scenarios — it will make the choice to solve specific ones easier. It's great if you mark problems and insights on the map (as you initially create it) with the product manager - this will give a general understanding of how the product works. Scott Sehlhorst and 3M have helpful thoughts on this .
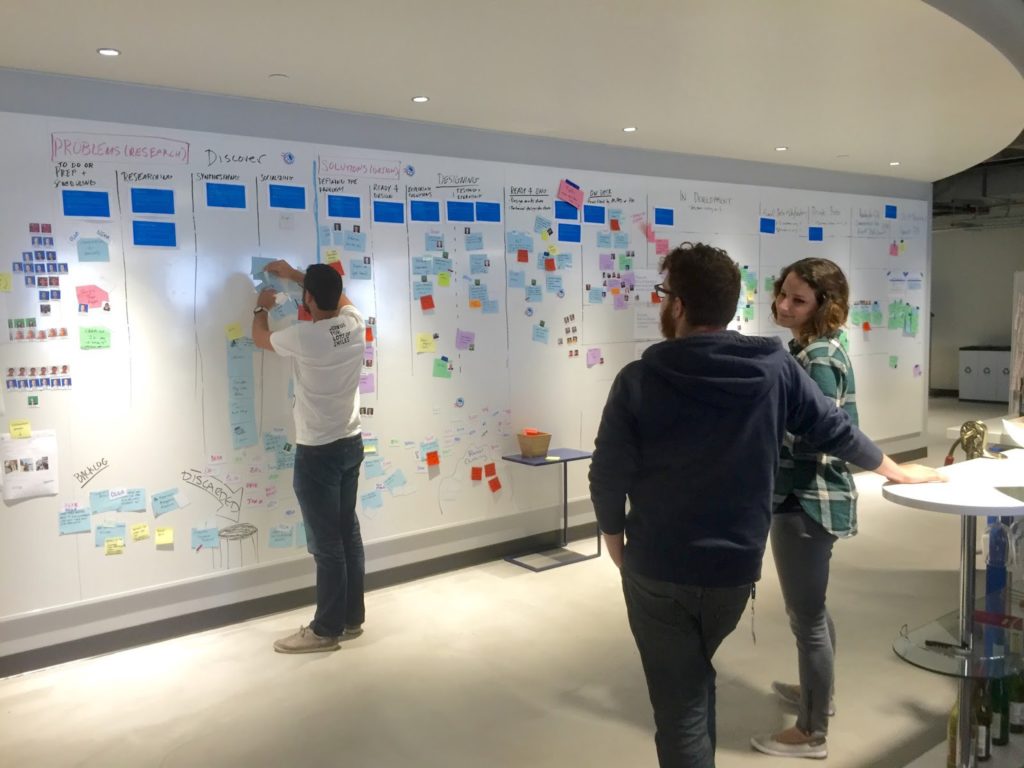
Interaction map showing problems in the interface
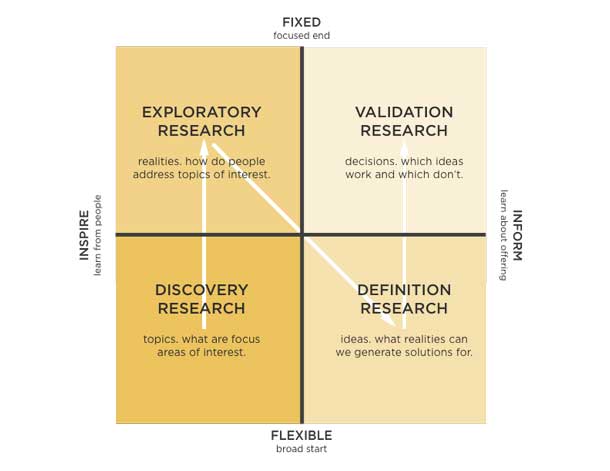
A good way to organize the internal work of the design team along the entire chain from finding problems to proposing and checking solutionsOptimizely offers. They organized a special kanban board, showing a gradual deepening of the problem and solution: Optimizely Kanban Board And Atul Handa and Kanupriya Vashisht show an excellent format for planning research activities in modern dynamic projects . They divide them into three types: strategic (helping to form a product vision, strategic goals and a roadmap, and also segmenting the target audience), tactical (helping to work on specific functions and complex interactions) and validation (testing hypotheses, evaluating design decisions, searching problems). Research in the agile process © Atul Handa and Kanupriya Vashisht
Step 2. Evaluation of maximum exhaust when solving problems
After the design team has helped the product manager to find unresolved user problems and product solutions for them, you need to monitor the roadmap for fixes and verify that the problems have been resolved.
True, absolutely all the problems, bugs and shortcomings of the product can not be fixed. This is an endless process, which, moreover, takes resources from the introduction of new functions. The task of the designers is to evaluate together with the product manager what improvements will give the maximum benefit for business and users.
If you look at the work of the company as a business as a whole, then the overall picture will show where it moves and what problems it faces. In addition to understanding the prerequisites that guide the top management and product managers, the design team will be able to offer directions for the development of services. In the first part of the series I described the contexts of the life of companies - they have different problems, tasks and needs. At each we can be useful in our own way, and our role (as well as tools and methods of work) should be different:
- Search for a suitable market, product solution and business model for its monetization. The product is simply obliged to change often and maybe even drastically for the company to survive.
- / . , .
- . — , , , , .
- . , — . , .
- , , — - . , — .
Each of these contexts has its own indicators of the health of the company and its products. If designers help to improve them, they will become even more valuable. And if, in addition to solving business problems, to find and use opportunities for its growth, respect for the design team will become even stronger.
In this context, the prism “problem → solution → validation” will become more complete - “business targets → opportunity on the market (user problem or product flaw) → solution → validation → business growth”. And this is a common language in which designers will always understand management - many interface changes can be tied to business values.
In addition to the life cycle stage, it is important to understand the business model of the product (direct sales, subscription, freemium, open source, advertising, partner club, mediation, franchising, crowdsourcing, auction and reverse auction, leasing, etc.), level of competition, type of market (B2C, B2B, business with the state or non-profit organizations), its condition (existing, new, regional clone) and segmentation (by price or niche). This greatly influences distribution and marketing, the choice of metrics, and hence the focus on user and business issues. What ultimately determines what value the company expects from designers.
Product and business metrics
There are a number of metrics for assessing the health of a business as a whole and specific products. They will show whether the product has problems to solve. These metrics display the current status and help assess growth prospects. In the general sense, “ metric ” is a collected and measurable assessment that allows you to track the effectiveness of a certain criterion of a product or business over time. The metric says that something happens, and its analysis - why it happens.
Metrics can relate to the entire user base, as well as to specific segments of the audience. Understanding the percentage and absolute number of users whose problem is solved by a new function or improvement of an existing one is another important part of the common language between the designer and the product manager. Abstract improvements for abstract people are harder to sell.
1. Money
The most direct indicator of the success of a commercial product. Depending on the business model, stage of business development and product features, you can consider earned, spent and saved money:
- LTV (lifetime value, also found as CLV and CLTV) - the average amount of money that the client brings for the entire time the product is used.
- Conversion - what percentage of potential purchases, subscriptions, or other key actions are performed in reality.
- Advertising Profit - how well does media, contextual and native advertising work?
- The cost of attracting a client - how much money is spent on distribution per user.
- Savings - savings in service support, reducing the time required to perform key operations using the product.
Their calculation is the subject of a separate article. I touched on some of this in my publication on UXmatters a few years ago . And although design decisions often influence them only indirectly, it is important to always remember about monetary metrics.
2. Attitude of users to the product
The attitudes of users are often indirect indicators, but they reflect well the attitude towards the company and products. If you follow their changes, you can predict monetary metrics.
- (retention ) — ( — ).
- (churn) — .
- (MAU (monthly active users) and DAU (daily active users)) — .
- — .
- NPS (Net Promoter Score) — .
- — . , , , . CLI (Customer Loyalty Index).
- — . UGC, , , ( ).
- — ( : , ).
If satisfaction is tracked with a delay and shows rather the long-term health of the product, then engagement and retention rates are more dynamic and well suited for tracking the response to improvements. The chain is approximately like this: “involvement → recurrence → satisfaction → recommendation”. At the same time, involvement is rather a collective name for a broad group of metrics that are often unique to a particular product. Many large services groped their criteria for user activity leading to long-term use. Oleg Yakubenkov gives several examples :
Facebook , 7 10 . Twitter 30 . Dropbox — , . , , , . , , .
An interesting experiment was verified by Yammer product managers. It would seem that by simplifying the process of achieving a certain goal, we maximize the share of those who will reach this goal. In general, everything is exactly the same, but the maximum number of those who do not mean that this approach maximizes the proportion of those who continue to use the product. Experimenting with the registration process, they found that removing unnecessary steps at which users just made their first small investments increases the tutorial's conversion, while worsening the service usage metrics in the medium and long term.
Invesp write that 44% of companies focus on attracting users against only 18% of companies focusing on recurrence . While the cost of raising exceeds the cost of withholding five times. This is a useful reminder for designers to focus on. Samuel Hulick shows how to build onboarding for better return . And many growth hacking experts advise focusing on the analysis of those users who stayed and not gone - this gives a clue about the value and those usage scenarios that should be developed and made more explicit.
Other interesting examples include Fjord, which use the Love Index to assess brand attitudes, consisting of five aspects of FRESH (Fun, Relevant, Engaging, Social, Helpful). Using ethnographic research and user surveys, they assess how users perceive key product use scenarios.
Love index fjord
However, we must understand that the struggle for satisfaction does not always lead to an increase in profits and market share - this is evident from the comparison of the Design Value Index graphs and the analysis of the American Customer Satisfaction Index from Bloomberg at the beginning of the article. Paradoxically, but quite often the opposite is true - money spent on increasing loyalty and satisfaction, not only does not give predictable returns, but also worsens the position of the company. Indeed, in competition, a product can win by price, assortment, and other factors. Therefore, I note once again that it is important to understand the peculiarities of your company's business, before taking ready-made recipes.
User satisfaction and profitability © MIT Sloan
The importance of user satisfaction for different types of companies © MIT Sloan
A similar problem with your favorite designers "delightful details", seeking to cause delight and increase loyalty. The article by Matthew Dixon, Karen Freeman, and Nicholas Toman gives disappointing facts - exceeding expectations, for example, in the form of free delivery or a gift, makes customers little more loyal than just the usual fulfillment of obligations. If you take two conditional cakes with things that increase and decrease loyalty, respectively - the product and brand will dominate the first (despite the fact that the service takes up a small part of it). But in the second, the quality of service is the main reason for the negative attitude. But this is the topic of the next group of metrics.
3. The quality of the product
Internal indicators of the stability of the product and the quality of its implementation for all components - functionality, marketing, support. Indirectly affect the attitude of users to it and, ultimately, the money.
- Technical stability of work - how often the service is inoperable and how many users this affects.
- Efficiency of use - how much time and effort does the user have to complete the task in the product?
- Quality of support and CES (Customer Effort Score) - how quickly problems of users are solved, whether it is necessary to contact to solve the problem again.
- The number of found bugs - how many errors in the work of the product the user encounters.
- Compliance with standards - whether interface solutions depart from the best practices and checklists of usability, accessibility.
- SUS (System Usability Scale) and SUPR-Q (Standardized User Experience Percentile Rank Questionnaire) are standardized methods for assessing usability through 10 questions about working with the product.
- SUM (Single Usability Measure) - combined usability assessment by test results.
The integrated usability indicators work well here, which take into account several factors at once. Either standardized, like SUS , SUPR-Q, and SUM , or tailored to the needs of specific companies, like ICU / ICU (Integral Criteria of Usability) from UIDG or TPI (Cisco Task Performance Indicator) from Cisco. The principles of the latter are well described in the article Gerry McGovern . They can be tracked over time in order to assess the improvement in consumer qualities of the product, or to compare with competitors in order to assess competitiveness. By the way, for the interest you can see the classic integral quality metric RATER (initially SERVQUAL ) - reliability, assurance, tangibles, empathy, responsiveness.
Cisco Task Task Indicator © Gerry McGovern
In the previous group of metrics, I ended up with the fact that the quality of the service is capable of greatly dropping user loyalty. Harvard Business Review talks about CES (Customer Effort Score) , which affects repeat purchases more than satisfaction and NPS. It shows how easily the client solved his problem with the product. Designers need to remember that in addition to the main interface of the product there is support, distribution and other components of interaction with the company that affect the business.
The impact of quality support, NPS and satisfaction on repeat purchases © HBR
4. Market as a whole
Metrics that talk about the long term company. If there is simply no space for growth, then the overall strategy needs to be changed - otherwise product improvements will bring little benefit.
- Market capacity - an assessment of the solvency of the audience in money.
- Competition - the market share of competitors in percent, as well as an assessment of the growth prospects of each of these companies.
- Market saturation is a potential audience not yet covered by the products of the company and its competitors.
As applied to startups, they often talk about the importance of getting a product into the market. Marc Andreesen writes that a strong market with a large number of potential customers is able to pull the product out . He divides the life of a startup into two stages - before entering the market (when it is necessary to adjust the concept, the team and the choice of the market often and quickly) and after (when there is a normal development of the company). Andy Rachleff says that the main killer of companies is the lack of a market and it doesn’t matter whether a strong team works in a weak market or a weak one in a strong one - only the market is important.
This is also important for mature companies - the market may collapse or become too competitive. Christina Wodtke gives a matrix of markets for the importance of customer problems and the frequency of its occurrence: the ocean (it is easy to achieve profitability, although it is important to find your niche), a swamp (many people without special preferences, so you need powerful marketing), a well (high margin, but small volumes) and desert (little chance). Designers need to understand where the company is located and what problems it will bring to its solution.
Market Matrix © Christina Wodtke
5. Brand values
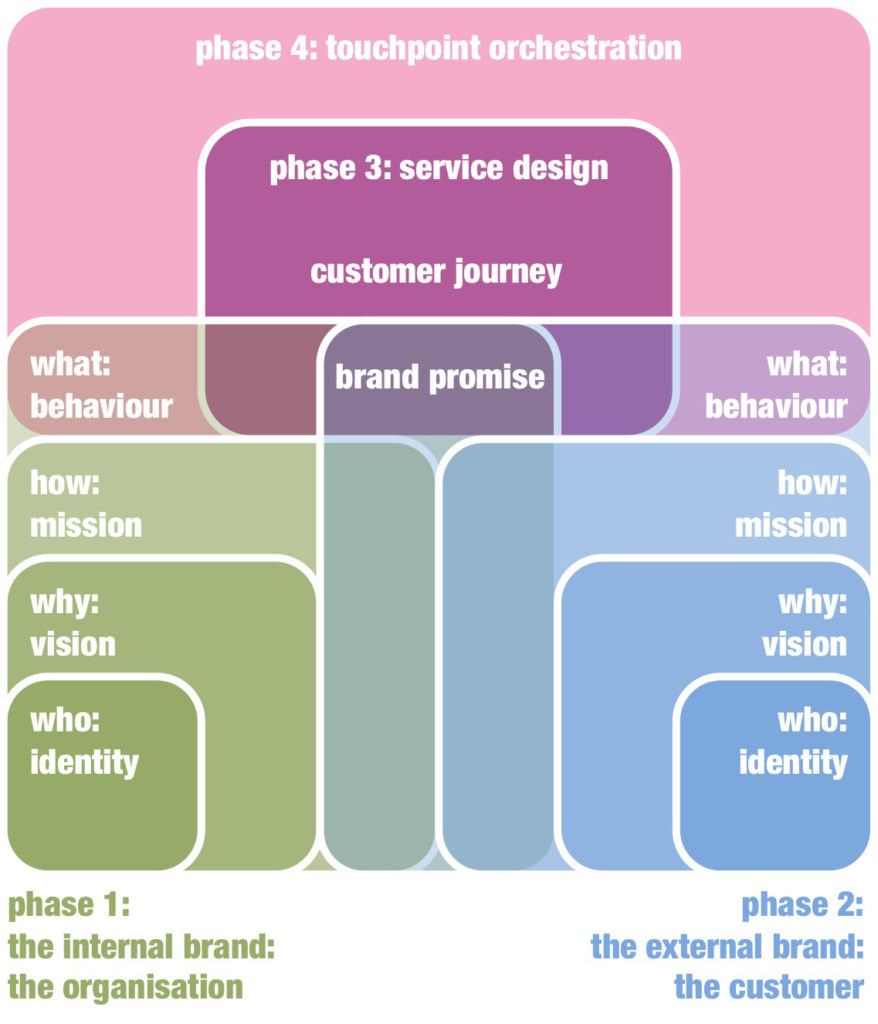
In addition to metrics, there are common brand values — principles, a manifesto, and other ways to describe why a company exists. This is a high-level filter that helps to choose among all initiatives those that are close to the brand in spirit and competence. And then - and specific solutions to problems. Otherwise, entry into the market may become too expensive and risky.
Erik Roscam Abbing and his company Zilver Innovation consider all initiatives and solutions from the point of view of the brand :
Innovations coming from the brand © Zilver Innovation
Take a look at Facebook and Google: who is better at creating devices, and who has social networks?
Interconnection of metrics
Between these five groups of metrics is approximately the following link:
Chain of metrics
You can track changes in this chain along three sections:
- Growth and health indicators . How much key metrics have changed during the reporting period. Their fall speaks of problems, and growth speaks of successful changes in the product.
- Comparison with competitors . Comparison of indicators and absolute values help to understand how well the company is competing in the market. Is there a threat to its current position and whether to push it.
- Key milestones . Desired absolute values of key metrics (for example, monthly active audience). Overcoming them indicates that a business has reached a certain scale.
The first cut is the main working tool. You set the period for which the metric changes. Then see what effect the changes in the interface gave. For example, did the return rate increase in a month or did the number of registrations increase in a week. Small products need more time for the number of users in the experiment to become statistically significant. Whatsapp Monster gets about 700 registrations per minute and can conduct tests almost in real time. By the way, statistical significance is important in all dimensions. And also a sober assessment of growth opportunities - somewhere an increase of 20% will not be noticeable, but somewhere + 2% will give an explosive effect.
It is also useful to have counter-metrics for key indicators - so you make sure that you do not harm the product. For example, the number of registrations may increase due to a new distribution channel, but the involvement of these users may be too low.
It is also necessary to distinguish metrics from signals like the number of page views per day. They are needed when conducting experiments (for example, whether we began to view the movie page more when adding a link to it on the news page) when we are solving a specific task. Or if the company's critical indicator is built on such a signal (I gave the above example of Facebook , where a potentially active user adds 10 friends in the first 7 days). But in any case, our main task is to improve the key indicator and in another experiment we will need other signals. Therefore, do not give them too much attention, otherwise you will dig in the flow of useless information. Or even worse - you will start to solve problems like a high failure rate in panic, without understanding the broader picture of the user interaction with the product .
How design ideas can get into the product plan
Ultimately, designers want their proposals to fall into the design plan. True, many have met one of the following reactions of the product manager to product development proposals :
- I do not consider this problem critical.
- These are not the product development opportunities that I am considering.
- It would be worth exploring other issues altogether.
- The offer is not very convincing.
Common language and problem visualization are part of the answer to such objections. The second part is participation in the selection of priorities for product development and the preparation of a product plan (roadmap). It is good when the whole team has access to it and understands the criteria for evaluating the functions falling into it. This will allow designers to independently check whether their ideas have a chance for implementation.
There is no single standard for product plans, but, as a rule, there are two tools:
- A table of product ideas in which each row is assessed by several parameters (impact on key metrics, technical complexity, timeframe and cost of implementation, consumer qualities, volume of potential audience, competition). Each of the parameters is given its own weight, so that the result is a total score. The table is sorted by this score.
- Roadmap in the form of a ranked list of specific functions from the table of product ideas. Depending on the development process, this may simply be backlog (the team takes functions from top to bottom), or a pre-agreed release plan or quarterly plan. Ideas come here as they are worked out, although many of them will remain ideas.
Mature in terms of design, the company takes into account among the parameters of assessment and consumer qualities. There are several common ways to evaluate them.
The Kano model allows you to divide product ideas into five categories: attractive (exceed expectations), work efficiency (key characteristics that compare competitors), mandatory (without them, the product cannot be sold), unimportant (do not affect user choice) and negative (in minus product). The most valuable fall into the upper right corner. For the evaluation of ideas and the subsequent placement on the scale can be used to survey users.
Model Kano © UIE
The window of opportunity helps to assess the potential of product ideas due to the difference between the importance of the problem for the user and satisfaction with the current solution. The importance and satisfaction are assessed on a 9-point scale, the total score is obtained by the formula “importance + (importance - satisfaction) = window of opportunity”.
Calculation principle Opportunity gap © James Kalbach
Evaluation, again, can be done through a user survey. It is important to correctly describe the product ideas - in terms of the ultimate value for the user. The most valuable problems for the user fall into the upper left corner:
Most Valuable Issues © James Kalbach
Another way to visualize this approach is Jeff Sauro:
Analysis of key drivers © Jeff Sauro
A great example of passing through the whole chain from finding problems to visualizing and prioritizing them is described by Niall O'Connor.
A bunch of user and business issues © Niall O'Connor
Interaction Map with Problem Designation © Niall O'Connor
Roadmap with the evaluation of food ideas on key parameters © Niall O'Connor
Problem visualization
The set of the most important indicators now depends on the type of product, the stage of its life cycle and the market - tracking all possible metrics at once is useless. When looking for a suitable market, a grocery solution and a business model for its monetization, recurrence is critical - is it valuable enough? In a period of growing user base and / or profits, it is important to reduce the outflow by optimizing the entire interaction map. In short, key metrics should answer the right questions about the current state and business plans (there is even the concept of Minimum Viable Metrics ). They can be used in the prism “business targets → opportunity on the market (user problem or product flaw) → solution → validation → business growth”.
Prism to evaluate solutions
In order to make work on solving problems more systematic and visual, you can tie key metrics to the interaction map. It will show improvements with the greatest exhaust.
Example of binding metrics to the interaction map
A smart example of using an interaction map to select the most valuable problems to solve is described by Jake Causby from Westpac. At the bank’s office there is a huge map for the whole wall, on which they mark business objectives and highlight key metrics that can be pumped in various ways. These analysts are also marked on the map - they help to find ideas for product improvements. Moreover, the ideas and solutions of competing banks were also noted there. Concepts and prototypes of new interfaces that solve the selected problem can also be placed here. The result is a powerful tool for finding problems and choosing the most effective points of application of effort, which is used by the whole team and shows the whole picture of the client's interaction with the company.
You can log in on the other hand and use the pirated metrics of AARRR (Acquisition, Activation, Retention, Revenue, Referral) of Dave McClure - they show the user's life cycle in terms of the effect on business:
- Acquisition (increment of user base, evaluation of channels to attract users)
- Activation (total number of users, rate of user activation, number of active users)
- Retention (outflow, NPS, engagement)
- Revenue (LTV, ARPU, frequency of purchases, time of return on user acquisition costs)
- Referral
Pirated AARRR Metrics © Dave McClure
In his book Build Better Products, Laura Klein offers a similar model:
Product Life Cycle Funnel Funnel © Laura Klein
Another model that visually represents the health of the product is HEART (Happiness, Engagement, Adoption, Retention, Task Success) in the prism of “goals → signals → metrics” from Google Ventures. It takes into account not only money, but also the attitude of the user to the product.
HEART Framework © Google Ventures
Version of the framework HEART © Pamela Pavlichak
Pamela Pavliscak in his master class at UXSTRAT 2014 presented in a similar form a few more models - CX-metrics from Forrester and Super 3 from Change Science. The Forrester model , proposed by Daniel Brousseau, places particular emphasis on the user's perception of the brand and the entire interaction map. Pamela presented them in the prism “events → metrics → sources”. These metrics are more abstract, but can be useful. Forrester CX Metrics in the prism of “events → metrics → sources” © Pamela Pavliscak Model of Super 3 metrics © Pamela Pavliscak Intuit uses an interesting approach with its SUCCESSion . Intuit SUCCESSion metrics model Our own model is also used by frog design : Model for assessing the impact of investment in design on business © frog design Another well-known framework “
See, Think, Do, Care offers Avinash Kaushik. First, users have a potential audience for your market, then they start exploring products on it, then they buy it, and in the end they become loyal customers:
- See (discussions in social media, brand awareness, percentage of new users)
- Think (CTR, depth of view, micro-conversion)
- Do (loyalty, failure rate in the order process, conversion, profit)
- Care (repeat purchases, willingness to recommend, LTV)
See, Think, Do, Care © Avinash Kaushik
AIDA and other models from the world of marketing and advertising are hardly applicable to interfaces, but it is useful to know them:
- AIDA - attention (awareness), interest, desire, action;
- CAB - cognition, affect, behavior;
- TIREA — thought, interest, risk, engagement, action;
- REAN — reach, engage, activate, nurture;
- NAITDASE — need, attention, interest, trust, desire, action, satisfaction, evaluation.
These models are rather a reference point, you always need to know the specifics of your product. The initiative for choosing a ready-made model (or creating one’s own) should come from the product manager - he is the main responsibility for success. Although the design team also has the right to vote, because it must understand the metrics and use them in the work on the design. The main thing - the health indicators of the product will become clearer.
It is important not to overdo it - metrics help make decisions, but do not always dictate them. Data has its limitations and can not answer all the questions. You will always need to balance between analytics and user research, as well as just expert opinion. But this is another important step to ensure that the design speaks with the business in the same language.
ROI design?
A common question that many design managers are asking is: how to show and prove the design ROI? If we talk about the activities of the team as a whole, then I wrote about this in the fourth part of the series . These are both general indicators of the quality of work (whether we are in plans, whether there are complaints about quality), and the value brought to the company (whether products and attitudes to the brand have become better, what insights about users we give to product managers).
If we express this in a more specific value for a product, we can take metrics from two groups as a basis: the user's attitude to the product (recurrence and outflow, satisfaction and NPS, involvement, brand awareness) and the quality of the product (compliance, SUS, integral metrics usability). Although, as Mauro Porcini of PepsiCo says,As the level of maturity of UX increases, designers need to prove their value less and less - a company with a strong design culture understands its importance.
Leah Buley is already conducting a second study of design teams on how their work is different in companies with different levels of UX maturity (the original was done within Forrester). The graph shows that everything starts with simple things like saving resources and efficiency, but the real impact on the company's strategy is the metrics from the “money” group and the “user's attitude to the company”. How do companies of different degrees of maturity UX see the effect of design on key indicators © Leah Buley
Step 3. Move from problem solving to innovation
When all the low-hanging fruits are torn off and simple ideas no longer give a break from competitors, and standard patterns for solving problems show less and less effect, there comes a need for innovation.
In the mass consciousness, “innovations” are understood as major technological breakthroughs with a large wow effect, even if they are not widely spread. If behind this there is also a genius-inventor, mythology only enhances the cliché, and the designers salivate and disable critical thinking. While the routine and not very impressive-looking work on the creation and maintenance of infrastructure often brings people much more benefit.
Real innovations are solutions to complex problems, made commercially successful for the first time. They directly affect the lives of millions of people. Therefore, you need to look in the direction of frequent gradual improvements. After all, they ultimately add up to breakthroughs and, if you put them on stream, you will more often accomplish mini-revolutions in the industry.
In this section, innovations can relate to completely different things - new functionality or technology, a breakthrough interface, unexpected ways of distribution, price reduction and costs, alternative ways of monetization, and entry into new markets. Potential breakthrough points can be seen on the Alexander Osterwalder business model map or its numerous variations. It is designed for new companies and products, but will help to analyze existing ones.
Business Model Canvas © Alexander Osterwalder Lean Canvas © Ash Maurya Potential growth points for designers:
- Technology or functionality . We are perfectly able to humanize nekatannye technology, make functions understandable and “marry” mental models of users with non-trivial solutions. Don Norman says innovative breakthroughs are often driven by technology. And only then the design helps to adapt them for comfortable use.
- Market . Understanding how to adapt a product to an audience in a new market is a feasible task for user research.
- Business model . Here our role is less obvious, but the increase in cash metrics due to interface optimization is our strong point.
- . , — . , — .
- . , , , - — .
In the section on prioritization, I mentioned the concept of “windows of opportunity” proposed by Anthony Ulwick. In his article for the Harvard Business Review, he provides an excellent example of how this approach helped Cordis significantly expand its market share through innovative solutions. Analysis of windows of possibilities © Anthony Ulwick Opportunity Canvas © Jeff Patton Another interesting way to evaluate the possibilities is offered by John T. Gourville. The success of innovation often depends on how big a change in the current user behavior involves a new solution. If you compare them with changes in the product itself, you can divide the decisions into 4 categories. The complexity of innovation ©
John T. GourvilleJohn gives several examples: Changing user behavior for innovative solutions. It is a new way to make it possible to make it possible. ). 9x effect © John T. Gourville
General design knowledge
Designers know a lot about users and if we learn to deliver insights to decision makers, it will help us find more opportunities and better assess their importance. Mailchimp and Intuit have successful examples. Mailchimp designers have built a powerful knowledge base that combines knowledge of users from a variety of sources (user research, analytics, feedback, research of competitors and the market, etc.), which allows you to quickly get answers to many questions.
Mailchimp User Knowledge Base
If these opportunities and insights are considered not within the framework of point problems according to the map of user interaction with the product, but in conjunction, i.e. as an improvement in key scenarios entirely - you can go beyond incremental improvements. For this, it is important to have a well-coordinated interaction between roles and divisions, because growth points can relate to various parts of the product. Alex Rawson, Ewan Duncan, and Conor Jones describe many good examples of such system work .
In order for such interdisciplinary interaction to be possible, some companies systematically develop a culture of innovation. Adobe, Intuit and CSAA Insurance Group have created special innovation toolkits for employees who teach methods and practices to search for both incremental improvements and more serious breakthroughs. Innovations of both types are possible only in companies that have created a suitable culture, one of the key features of which is the ability to try and make mistakes without consequences for a career. There are many windows of opportunity for designers in this, both in terms of applying research methods and prototyping beyond the usual framework of the interface, and in terms of the development of the culture itself.
findings
User research and analytics are powerful decision support tools. The more such support comes from us, the better the company's solutions and we are more valuable as designers. And the closer the language of designers to the language of business. After all, with a common language, it will turn out to “marry” the goals of business and users. For product managers, such a language is key business indicators. For designers - interaction cards.
Total:
- Benefit throughout the process of working on the product, not only in its development.
- It is important to understand not only users, but also the company's business.
- Consider interface solutions in terms of “business targets → opportunity on the market (user problem or product flaw) → solution → validation → business growth”.
- Clearly show problems in the work of users with the product using the interaction map.
- Look at innovations more broadly, then the company will be able to issue them more often.
You will bring even more good to users when you start to choose interface solutions not only with your heart, but also in accordance with business success indicators. People vote with a purse and commercial success is a good indicator of the benefits brought.
PS It is important not to forget your roots and not turn into a soulless metrics optimization machine. We need a healthy compromise in the interests of business and user, commerce and aesthetics. Otherwise, in pursuit of numbers, the quality of the design will fall.
Source: https://habr.com/ru/post/326448/
All Articles