Data Visualization: Oracle BI Data Discovery
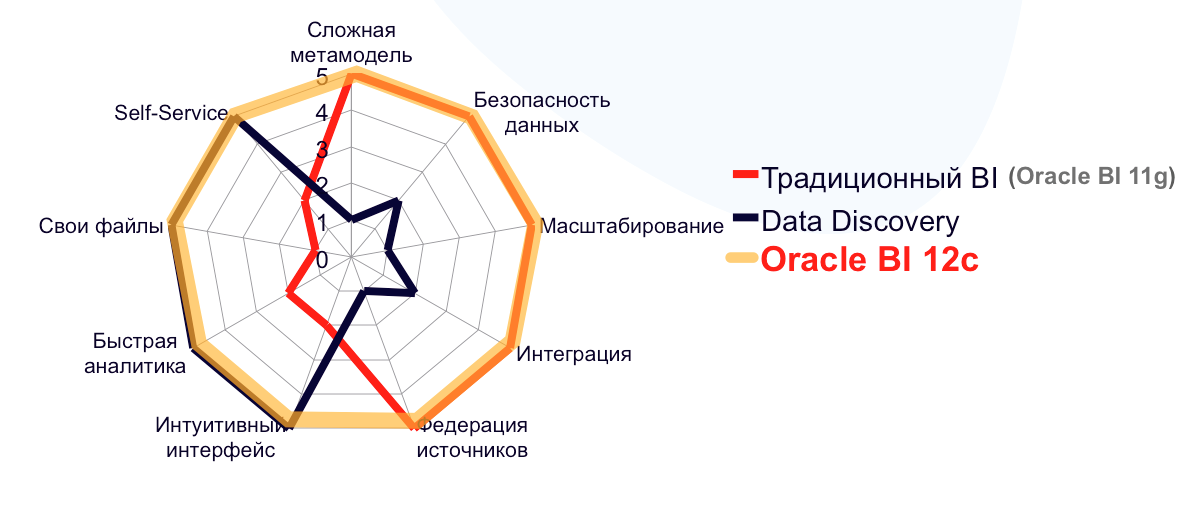
Until recently, the Oracle BI business intelligence solution had a purely classical architecture, characterized by a single platform with a high level of data security and centralized management of access rights. Also, classic BI allows you to work with complex data models, ETL tools and a variety of data sources.
But at the end of 2015, with the release of Oracle BI 12c, the architecture of this solution was supplemented with functions of Data Discovery class systems (read more about Data Discovery ). Namely: a new visualization component was developed - Data Visualization , in which not only qualitatively improved data visualization, but also a self-service function appeared. In-memory processing has also been optimized to maximize the use of resources and analyze more local data, department-level data, corporate data and BigData. And along with simplified administration and an optimized update process, the new version of the platform allows companies to significantly improve TCO (Total Cost of Ownership) and ROI (Return on Investment) indicators for implementation, as IT costs are reduced and time to create new reports is reduced.
Oracle Data Visualization (hereinafter referred to as DV) is a key innovation in Oracle BIEE 12c . DV meets the most current requirements for BI tools - self-service (allows business users to connect new data sources and build new visualizations without the participation of IT specialists), intuitive graphics, a user-friendly interface that allows you to build reports and charts in seconds.
DV is presented both in the traditional Oracle server web version (Visual Analyzer as part of BIEE), and in the desktop version, which allows working autonomously. When using Desktop DV, the user adds his sources — databases of various formats, pre-configured reports of the Oracle BI server applications and, of course, Excel files. The server version also allows you to connect to pre-configured BI subject areas. The list of supported source types is displayed on the Desktop DV interface screenshot:
')

The DV interface is fairly simple to learn, and it is easy for a user who has experience building charts in Excel.
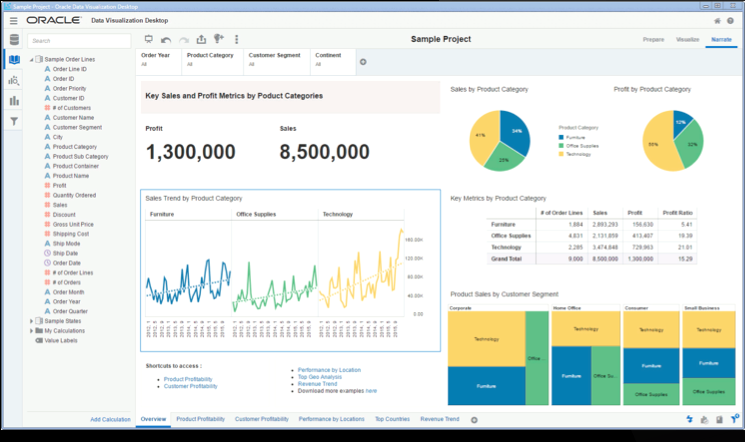
To build visualizations, drag'n'drop is used. The user marks the required attributes and indicators on the left side of the screen (elements of the Oracle BI subject area or the fields of external source tables) and transfers them to the plot area. In this case, DV automatically selects the type of visualization and builds a diagram. Further, the user can perform edits himself: change the type of chart, selected attributes, add new calculated fields if necessary, apply filters, or set the formatting and color scheme of chart elements. When working with the current visualization, it is possible to make a drill-down on any indicator of the model and get the necessary detail. The interface of the main form of visualization allows you to create several bookmarks and quickly move between panels. At the same time, all visualizations are saved as projects that can be uploaded and transferred to a colleague (in the case of the desktop version) as a model for building - without adjusting external sources or data (if files are used) or with them.
DV has a useful “history of analysis” function, which allows you to undo recent changes to views if you accidentally “broke” something. It is possible to take a snapshot of the current analysis, add comments to it and, if you make a series of such analysis snapshots, you can play them later at the presentation, saving the user from the routine repetitions of setting parameters.
The standard DV set contains more than two dozen chart types and has the function of connecting external plug-ins among interesting chart types - thermal matrix, sunkey, tree structure, sales funnel, Gantt chart, geographic representations with connecting your own maps (this can be not only maps of territories, but and floor plans or elements of mechanisms). To connect your own layers of maps DV supports GeoJSON.

DV allows you to build reports "on the fly" on the search query terms from the data model. For example, “profit” is entered in the search bar - an incremental search is triggered and the indicator name is substituted, then DV displays the total profit for a given period. Then we enter “group” - a bar-based visualization is built by product groups, etc., until we get a report of the required detail. At the same time, DV itself chooses the type of diagram, based on the specified set of parameters, and, of course, the report constructed in this way is immediately ready for any changes by the user, as if it were created via standard drag'n'drop.

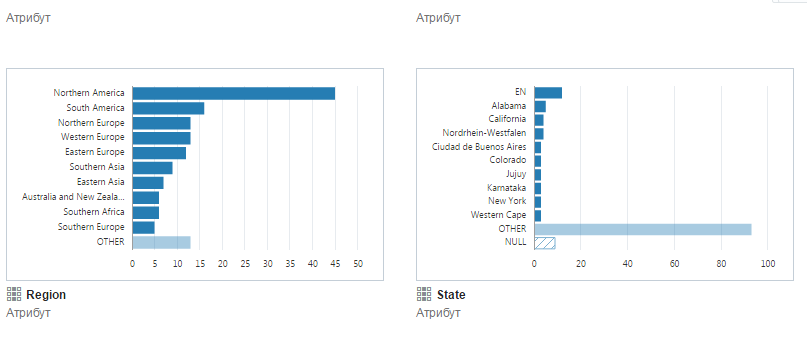
DV offers a profiling function for assessing the quality of the data analyzed: summary charts for each attribute.
Among the built-in functions are extensions for predictive analytics. You can quickly build forecasts, determine trends or outliers. Of course, you can supplement the built-in functions with external ones or develop your own (in the R language).

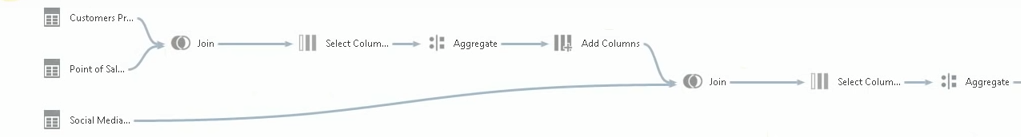
Separately, I would like to mention the useful function of Data Flow. It allows you to pre-process the connected data in steps, for example: select some of the fields from the original data set, then merge with another data set, add computable indicators, apply filters, and finally group the data. At the output we get a data set, ready for visualization. You can also use this function to segment your customer base.
Separately, we would like to note an adequate pricing policy for DV - the cost of 1 license starts from $ 1,300.
Let's sum up. Oracle Data Visualization as a separate analysis tool can certainly be useful, but this feature is most likely relevant for small companies. Fully DV functionality is revealed when used in conjunction with classic Oracle BI by connecting to pre-configured external data subject areas and using server computing power. Among the drawbacks of the desktop version, we note the absence of the current version under OS X and the delays in loading large Excel files (tested with 3000 rows and 80 columns). In the first case, the problem is compensated by the web version, and in the second, when working with large external files, you must perform preliminary data preparation: remove excess analytics, group rows or, finally, split tables into several different report groups. And for this, DV already provides Data Flow functionality.
The material was prepared by Denis Krylov, business analyst of Jet Infosystems.
But at the end of 2015, with the release of Oracle BI 12c, the architecture of this solution was supplemented with functions of Data Discovery class systems (read more about Data Discovery ). Namely: a new visualization component was developed - Data Visualization , in which not only qualitatively improved data visualization, but also a self-service function appeared. In-memory processing has also been optimized to maximize the use of resources and analyze more local data, department-level data, corporate data and BigData. And along with simplified administration and an optimized update process, the new version of the platform allows companies to significantly improve TCO (Total Cost of Ownership) and ROI (Return on Investment) indicators for implementation, as IT costs are reduced and time to create new reports is reduced.
Oracle Data Visualization (hereinafter referred to as DV) is a key innovation in Oracle BIEE 12c . DV meets the most current requirements for BI tools - self-service (allows business users to connect new data sources and build new visualizations without the participation of IT specialists), intuitive graphics, a user-friendly interface that allows you to build reports and charts in seconds.
DV is presented both in the traditional Oracle server web version (Visual Analyzer as part of BIEE), and in the desktop version, which allows working autonomously. When using Desktop DV, the user adds his sources — databases of various formats, pre-configured reports of the Oracle BI server applications and, of course, Excel files. The server version also allows you to connect to pre-configured BI subject areas. The list of supported source types is displayed on the Desktop DV interface screenshot:
')
The DV interface is fairly simple to learn, and it is easy for a user who has experience building charts in Excel.
To build visualizations, drag'n'drop is used. The user marks the required attributes and indicators on the left side of the screen (elements of the Oracle BI subject area or the fields of external source tables) and transfers them to the plot area. In this case, DV automatically selects the type of visualization and builds a diagram. Further, the user can perform edits himself: change the type of chart, selected attributes, add new calculated fields if necessary, apply filters, or set the formatting and color scheme of chart elements. When working with the current visualization, it is possible to make a drill-down on any indicator of the model and get the necessary detail. The interface of the main form of visualization allows you to create several bookmarks and quickly move between panels. At the same time, all visualizations are saved as projects that can be uploaded and transferred to a colleague (in the case of the desktop version) as a model for building - without adjusting external sources or data (if files are used) or with them.
DV has a useful “history of analysis” function, which allows you to undo recent changes to views if you accidentally “broke” something. It is possible to take a snapshot of the current analysis, add comments to it and, if you make a series of such analysis snapshots, you can play them later at the presentation, saving the user from the routine repetitions of setting parameters.
The standard DV set contains more than two dozen chart types and has the function of connecting external plug-ins among interesting chart types - thermal matrix, sunkey, tree structure, sales funnel, Gantt chart, geographic representations with connecting your own maps (this can be not only maps of territories, but and floor plans or elements of mechanisms). To connect your own layers of maps DV supports GeoJSON.
DV allows you to build reports "on the fly" on the search query terms from the data model. For example, “profit” is entered in the search bar - an incremental search is triggered and the indicator name is substituted, then DV displays the total profit for a given period. Then we enter “group” - a bar-based visualization is built by product groups, etc., until we get a report of the required detail. At the same time, DV itself chooses the type of diagram, based on the specified set of parameters, and, of course, the report constructed in this way is immediately ready for any changes by the user, as if it were created via standard drag'n'drop.
DV offers a profiling function for assessing the quality of the data analyzed: summary charts for each attribute.
Among the built-in functions are extensions for predictive analytics. You can quickly build forecasts, determine trends or outliers. Of course, you can supplement the built-in functions with external ones or develop your own (in the R language).
Separately, I would like to mention the useful function of Data Flow. It allows you to pre-process the connected data in steps, for example: select some of the fields from the original data set, then merge with another data set, add computable indicators, apply filters, and finally group the data. At the output we get a data set, ready for visualization. You can also use this function to segment your customer base.
Separately, we would like to note an adequate pricing policy for DV - the cost of 1 license starts from $ 1,300.
Let's sum up. Oracle Data Visualization as a separate analysis tool can certainly be useful, but this feature is most likely relevant for small companies. Fully DV functionality is revealed when used in conjunction with classic Oracle BI by connecting to pre-configured external data subject areas and using server computing power. Among the drawbacks of the desktop version, we note the absence of the current version under OS X and the delays in loading large Excel files (tested with 3000 rows and 80 columns). In the first case, the problem is compensated by the web version, and in the second, when working with large external files, you must perform preliminary data preparation: remove excess analytics, group rows or, finally, split tables into several different report groups. And for this, DV already provides Data Flow functionality.
The material was prepared by Denis Krylov, business analyst of Jet Infosystems.
Source: https://habr.com/ru/post/326338/
All Articles