First steps to the web SCADA-system. We animate the mnemonic in the browser using AngularJS
Today we will talk about displaying mimic diagrams of technological objects in the browser through such technologies as SVG, JavaScript, etc.
We describe what we want to get:
SCADA-system (or rather its server part) allows you to add custom html-pages. I will not manually type the page code, and draw a simple diagram in the editor , then I will show what happened and how it works.
Here is the mnemonic:
')

Power and current will be tied to variables
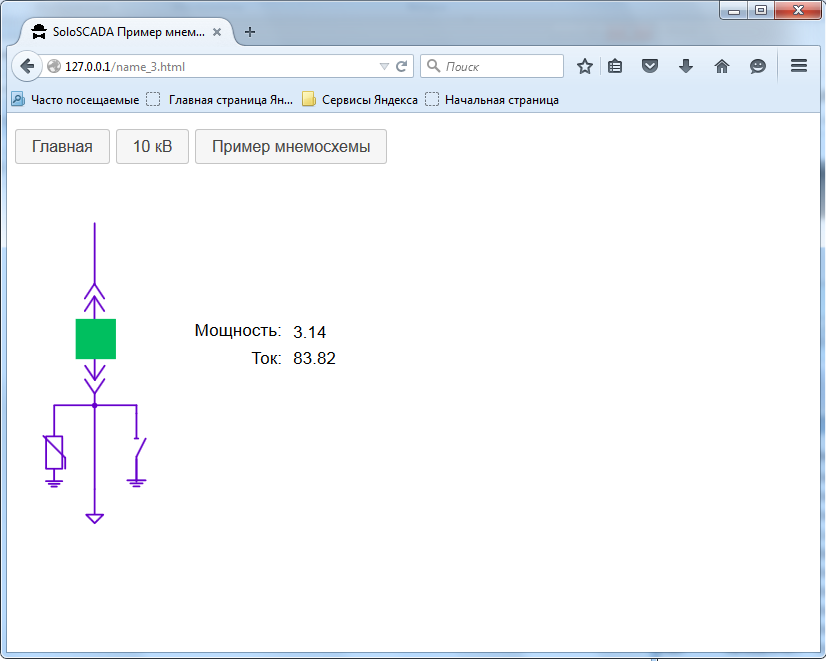
Let's save the scheme, restart the service, open 127.0.0.1 in the browser, get the following:
Press ctrl + u in the browser, we will see the source code of the page (unbound lines are omitted):
We analyze in order:
connect jquery:
We enable jquery-ui for the dialog to enable / disable:
we connect angularjs:
we connect an auxiliary script.
Next, create a controller. The values of the variables are taken from the file all.json, we request it from the server when the page is loaded and once a second with the help of
If the file all.json is requested successfully, it is executed:
We update the data. If not successful, we display the message No server connection at the top ! on
Json-file should be in this format:
The SVG file is embedded directly in the body of the page:
In the text box we display the value of the variable I_10_111 as follows:
The main thing here is the record
The on state is displayed with a red rectangle:
The opacity property depends on the variable V_10_111 with the format_on filter applied. When the value is 1, the rectangle is visible (opacity: 1). When the value is 0, the rectangle is invisible (opacity: 0). When the state is undefined (this is passed by the question marks in the Json file “V_10_111”: “??”) applying the format_on filter gives 0, i.e. the rectangle is invisible.
The disabled state is displayed with a green rectangle:
The opacity property depends on the variable
When you click on the rectangle with a mouse, the
For the window, the jquery-ui library is used. We send the command to the server using the post method:
Command to disable:
The dialog box is connected in the html-file:
We try in different browsers!
Firefox:

So:

SVG automatically scales to different screen resolutions and browser screen sizes.
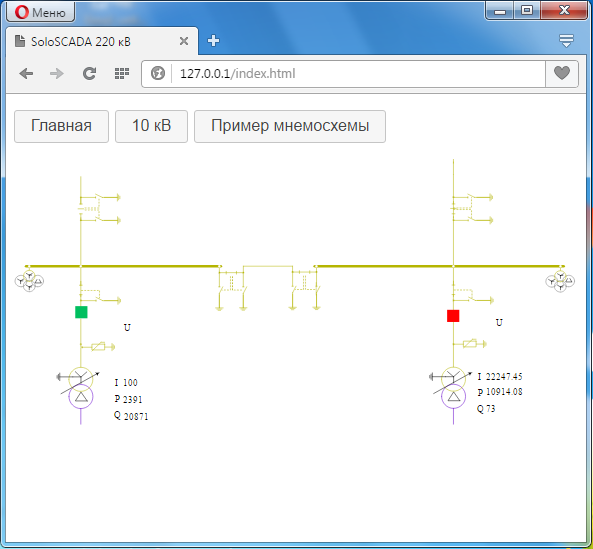
Opera:
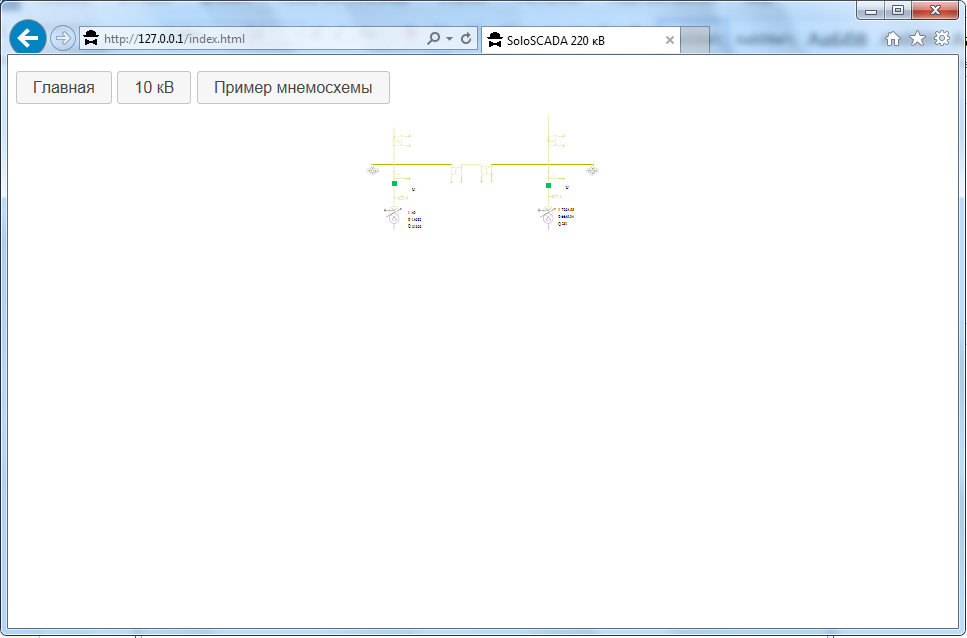
Internet explorer as usual gave a surprise.
Why is it so far not figured out. To independently feel an example you need to download the SCADA system , install it, then connect the html file in the configurator. The file itself is put in the web_main folder.
We describe what we want to get:
- The mnemonic opens in a browser. Graphics - SVG.
- At the top of the mimic buttons for the transitions to other mimic diagrams.
- Data is updated once per second.
- By clicking on the switch image, a window appears from which it can be turned on or off.
SCADA-system (or rather its server part) allows you to add custom html-pages. I will not manually type the page code, and draw a simple diagram in the editor , then I will show what happened and how it works.
Here is the mnemonic:
')
Power and current will be tied to variables
P_10_111 and I_10_111 respectively. The on state of the switch is tied to the red rectangle (it is hidden under the green rectangle), disconnected to the green one.Let's save the scheme, restart the service, open 127.0.0.1 in the browser, get the following:
Press ctrl + u in the browser, we will see the source code of the page (unbound lines are omitted):
Page source
<!DOCTYPE html> <html ng-app="countryApp"> <head> <meta name="Content-Type" content="text/html; charset=utf-8"> <meta http-equiv="Content-Type" content="text/html; charset=utf-8"> <title>SoloSCADA </title> <link rel="stylesheet" href="./css/jquery-ui.css"> <script src="./js/jquery.js"></script> <script src="./js/jquery-ui.js"></script> <script src="/js/angular.min.js"></script> <script src="/js/scada.js"></script> <script> var countryApp = angular.module('countryApp', []); countryApp.controller('CountryCtrl', function ($scope, $http, $interval){ $http.get('all.json').success(function(data) { $scope.val = data.val; }); $interval(function(){ $http.get('all.json').success(function(data) { $scope.val = data.val; $( "#label_err" ).text( "" ); }).error(function(data, status) { console.error('Error occurred:', data, status); $( "#label_err" ).text( ' !' ); }); },1000); }); countryApp.filter('format_off', function(){ return function(text){ if(text.indexOf("0")===0){ return "1"; } else{ return "0"; } } }); countryApp.filter('format_on', function(){ return function(text){ if(text.indexOf("1")===0){ return "1"; } else{ return "0"; } } }); </script> </head> <body ng-controller="CountryCtrl"> <div id="dialog-confirm" title=" "> <label id="label2">444VG</label> </div> <p> <button type="button" class="ui-button ui-widget ui-corner-all" onClick="javascript:window.location='index.html'"></button> <button type="button" class="ui-button ui-widget ui-corner-all" onClick="javascript:window.location='ps10.html'">10 </button> <button type="button" class="ui-button ui-widget ui-corner-all" onClick="javascript:window.location='name_3.html'"> </button> <label id="label_err"></label> </p> <svg xmlns="http://www.w3.org/2000/svg" xmlns:xlink="http://www.w3.org/1999/xlink" version="1.1" viewBox="0 0 930 504" xml:space="preserve"> <desc>Created with Fabric.js 1.7.3</desc> <defs> </defs> <g transform="translate(260.61 175.8) matrix(1 0 0 1 0 0) "> <text font-family="helvetica" font-size="20" font-weight="normal" style="stroke: none; stroke-width: 1; stroke-dasharray: none; stroke-linecap: butt; stroke-linejoin: miter; stroke-miterlimit: 10; fill: rgb(1,1,1); fill-rule: nonzero; opacity: 1;" > <tspan x="-50.88" y="6.3" fill="rgb(1,1,1)">:</tspan> </text> </g> <g transform="translate(293.54 208.8) matrix(1 0 0 1 0 0) "> <text font-family="helvetica" font-size="20" font-weight="normal" style="stroke: none; stroke-width: 1; stroke-dasharray: none; stroke-linecap: butt; stroke-linejoin: miter; stroke-miterlimit: 10; fill: rgb(1,1,1); fill-rule: nonzero; opacity: 1;" > <tspan x="-18.04" y="6.3" fill="rgb(1,1,1)">:</tspan> </text> </g> <rect id="V_10_111_on" x="-25" y="-25" rx="0" ry="0" width="50" height="50" style=" cursor:pointer; stroke: none; stroke-width: 1; stroke-dasharray: none; stroke-linecap: butt; stroke-linejoin: miter; stroke-miterlimit: 10; fill: rgb(255,0,0); fill-rule: nonzero; opacity:{{val.V_10_111 | format_on}};" transform="translate(94.34 185.86) scale(0.94 0.94) matrix(1 0 0 1 0 0) " onclick="tmcontrol('V_10_111','-10-111')" title=" -10-111"/> <g id="P_10_111" transform="translate(397.54 177.8) matrix(1 0 0 1 0 0) "> <text font-family="helvetica" font-size="20" font-weight="normal" style="stroke: none; stroke-width: 1; stroke-dasharray: none; stroke-linecap: butt; stroke-linejoin: miter; stroke-miterlimit: 10; fill: rgb(1,1,1); fill-rule: nonzero; opacity: 1;" > <tspan x="-73.04" y="6.3" fill="rgb(1,1,1)">{{val.P_10_111}}</tspan> </text> </g> <g id="I_10_111" transform="translate(393.65 208.8) matrix(1 0 0 1 0 0) "> <text font-family="helvetica" font-size="20" font-weight="normal" style="stroke: none; stroke-width: 1; stroke-dasharray: none; stroke-linecap: butt; stroke-linejoin: miter; stroke-miterlimit: 10; fill: rgb(1,1,1); fill-rule: nonzero; opacity: 1;" > <tspan x="-69.15" y="6.3" fill="rgb(1,1,1)">{{val.I_10_111}}</tspan> </text> </g> <rect id="V_10_111_off" x="-25" y="-25" rx="0" ry="0" width="50" height="50" style=" cursor:pointer; stroke: none; stroke-width: 1; stroke-dasharray: none; stroke-linecap: butt; stroke-linejoin: miter; stroke-miterlimit: 10; fill: rgb(0,191,95); fill-rule: nonzero; opacity:{{val.V_10_111 | format_off}};" transform="translate(94.28 185.78) scale(0.94 0.94) matrix(1 0 0 1 0 0) " onclick="tmcontrol('V_10_111','-10-111')" title=" -10-111"/> </svg> </body> </html> We analyze in order:
<script src="./js/jquery.js"></script> connect jquery:
<script src="./js/jquery-ui.js"></script> We enable jquery-ui for the dialog to enable / disable:
<script src="/js/angular.min.js"></script> we connect angularjs:
<script src="/js/scada.js"></script> we connect an auxiliary script.
Next, create a controller. The values of the variables are taken from the file all.json, we request it from the server when the page is loaded and once a second with the help of
$interval(function(){ },1000); If the file all.json is requested successfully, it is executed:
Code
$http.get('all.json').success(function(data) { $scope.val = data.val; $( "#label_err" ).text( "" ); }). We update the data. If not successful, we display the message No server connection at the top ! on
label_err .this script
.error(function(data, status) { console.error('Error occurred:', data, status); $( "#label_err" ).text( ' !' ); }); Json-file should be in this format:
{ "val":{ "V_10_111": "0", "I_10_111": "55.88", "P_10_111": "9.11" } } The SVG file is embedded directly in the body of the page:
<svg xmlns="http://www.w3.org/2000/svg" xmlns:xlink="http://www.w3.org/1999/xlink" version="1.1" viewBox="0 0 930 504" xml:space="preserve"> </svg> In the text box we display the value of the variable I_10_111 as follows:
spoiler
<g id="I_10_111" transform="translate(393.65 208.8) matrix(1 0 0 1 0 0) "> <text font-family="helvetica" font-size="20" font-weight="normal" style="stroke: none; stroke-width: 1; stroke-dasharray: none; stroke-linecap: butt; stroke-linejoin: miter; stroke-miterlimit: 10; fill: rgb(1,1,1); fill-rule: nonzero; opacity: 1;" > <tspan x="-69.15" y="6.3" fill="rgb(1,1,1)">{{val.I_10_111}}</tspan> </text> </g> The main thing here is the record
{{val.I_10_111}}. Angularjs itself searches for such records and replaces them with the value I_10_111.The on state is displayed with a red rectangle:
On state
<rect id="V_10_111_on" x="-25" y="-25" rx="0" ry="0" width="50" height="50" style=" cursor:pointer; stroke: none; stroke-width: 1; stroke-dasharray: none; stroke-linecap: butt; stroke-linejoin: miter; stroke-miterlimit: 10; fill: rgb(255,0,0); fill-rule: nonzero; opacity:{{val.V_10_111 | format_on}};" transform="translate(94.34 185.86) scale(0.94 0.94) matrix(1 0 0 1 0 0) " onclick="tmcontrol('V_10_111','-10-111')" title=" -10-111"/> The opacity property depends on the variable V_10_111 with the format_on filter applied. When the value is 1, the rectangle is visible (opacity: 1). When the value is 0, the rectangle is invisible (opacity: 0). When the state is undefined (this is passed by the question marks in the Json file “V_10_111”: “??”) applying the format_on filter gives 0, i.e. the rectangle is invisible.
The disabled state is displayed with a green rectangle:
Disconnected state
<rect id="V_10_111_off" x="-25" y="-25" rx="0" ry="0" width="50" height="50" style=" cursor:pointer; stroke: none; stroke-width: 1; stroke-dasharray: none; stroke-linecap: butt; stroke-linejoin: miter; stroke-miterlimit: 10; fill: rgb(0,191,95); fill-rule: nonzero; opacity:{{val.V_10_111 | format_off}};" transform="translate(94.28 185.78) scale(0.94 0.94) matrix(1 0 0 1 0 0) " onclick="tmcontrol('V_10_111','-10-111')" title=" -10-111"/> The opacity property depends on the variable
V_10_111 with the format_off filter format_off . When the variable value is 0, the rectangle is visible ( opacity: 1 ). When the value is 1, the rectangle is invisible ( opacity: 0 ).When you click on the rectangle with a mouse, the
tmcontrol('V_10_111','-10-111') script tmcontrol('V_10_111','-10-111') . It is described in the scada.js file.tmcontrol
function tmcontrol(perem,rusname) { elem = perem; $( "#label2" ).text( rusname ); dialog.dialog( "open" ); }; $( "#label2" ).text( rusname ); - text label on the dialog displays the name of the element on which the command is executed.dialog.dialog( "open" ); - show the dialog box.Dialog box function:
$( function() { dialog = $( "#dialog-confirm" ).dialog({ autoOpen: false, resizable: false, height: "auto", width: 400, modal: true, buttons: { "": function() { $.post("control.php", elem+'&1'); $( this ).dialog( "close" ); }, "": function() { $.post("control.php", elem+'&0'); $( this ).dialog( "close" ); }, "": function() { $( this ).dialog( "close" ); } } }); $( "#create-user" ).button().on( "click", function() { dialog.dialog( "open" ); }); } ); For the window, the jquery-ui library is used. We send the command to the server using the post method:
$.post("control.php", elem+'&1'); Command to disable:
$.post("control.php", elem+'&0'); The dialog box is connected in the html-file:
<div id="dialog-confirm" title=" "> <label id="label2"> </label> </div> We try in different browsers!
Firefox:
So:
SVG automatically scales to different screen resolutions and browser screen sizes.
Opera:
Internet explorer as usual gave a surprise.
Why is it so far not figured out. To independently feel an example you need to download the SCADA system , install it, then connect the html file in the configurator. The file itself is put in the web_main folder.
Source: https://habr.com/ru/post/326330/
All Articles