RStudio Connect - Shiny "facelift" for corporate use
Enough time has passed from the mention in a previous publication about the use of RStudio Connect in combat conditions in order to share the results. Brief summary - “give two!”. And think about the optimization of the "analysts" department. Below are the details.
As an additional reading, I recommend to look at the detailed publication “Data at GDS (Government Digital Service). Reproducible Analytical Pipeline ” in the blog of the UK government analytical service on a similar topic.
What is RStudio Connect
RStudio Connect is a slightly paid product for publishing analytical information both within the company and for the rest of the world. Analytical processing and preparation of reporting views is performed by means of R. The server runs on-premise on the * nix platform, which automatically eliminates 3 reasons for the headache: no clouds, no licensing of the Win Server (and even suddenly SQL) and no problems with Unicode.
I deliberately wrote “analytical information” because the representations generated by R + RStudio Connect are very far from the classic reports like Jasper \ BO ... The main practically useful published results (reports) can be attributed to three main classes:
- Interactive html reports;
- Static pdf reports;
- Shiny applications.

Reports
html and pdf documents are formed in the literate programming paradigm of R Markdown source files containing a text description and inclusion of code for dynamic calculation and visualization of the results of these calculations in the form of tables, figures and interactive js widgets. In the latest release of RStudio Connect, reports can be parameterized (as long as there was no need to check), which adds additional flexibility.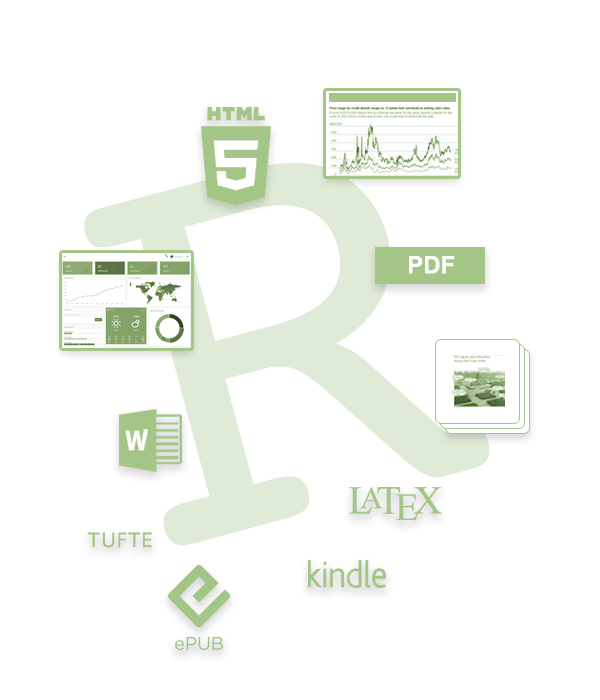
The advantages of this approach are obvious:
- Different forms of presentation are obtained from a single source .Rmd file, which eliminates multiple duplications of source and intermediate data, calculations, and views;
- manual copy-paste and associated labor costs and unreliable results are completely excluded;
- results are reproducible and can be executed on demand / schedule;
- dynamic js-elements in a compact form provide detailed information. Examples available in R htmlwidgets can be seen here .
Since RStudio Connect is enterprise-oriented, the database has all the required functions:
- Authorization of users with the ability to bind to LDAP;
- Flexible system of rights;
- Generate reports on a schedule;
- E-mail notifications;
- Means of self-diagnosis and monitoring;
- Load management;
- Logging actions;
- Creation of local repositories of R packages for each application;
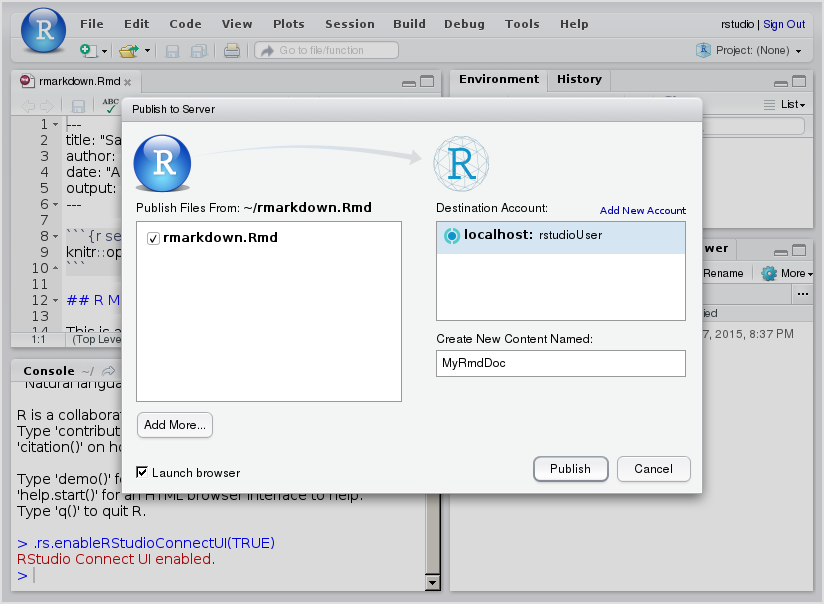
- Publish documents from RStudio IDE in one click;
- Versioning support for published documents;
- and so forth
Each published document may have different access rights. Starting from "only author" and ending with "viewing to everyone who knows the link."
And that's why the term "reports" is used in quotes. An interesting following conclusion from the bundle of functions is the scheduled launch of + literate programming + e-mail notifications as follows:
in fact, we can, according to the schedule, execute any R scripts embedded by executable blocks in .Rmd files. These scripts can perform absolutely any actions, for example, take data from files \ DB, deal with web scrapping \ conduct calculations, publish data to external systems \ run external scripts, etc., while conducting a detailed “story-log” in the form combinations of text, tables, graphs. And this “story-log” upon completion of work can be automatically sent to interested parties. Those. The system in the now popular genre of "comics" can report on the results of the work of very complex processes!
In fact, the ideal tool for the practical implementation of the concept of operational analytics.

I attach the PDF file itself . Bead letters are in the Adobe Reader and in the tables created by the insertion of R-code, and in the figures and in the text.
From a technical point of view, the pdf version is prepared using the R markdown → LaTeX → PDF chain. So the output is a polygraphically high-quality document with great possibilities for customization.
Applications and Dashboards
It's simple. Built-in Shiny Server with enterprise functions. Everything that was written about Shiny was previously available in full.
And publishing applications in a “one click” allows you to easily and easily make all kinds of dashboards, interactive applications, including online analytics on the server and custom views for any employee for his current needs.
There are no restrictions on the number of published applications. No administrator is needed for publishing. No need to write to the queue to the developers. Take it and do it.
Moreover, integration with corporate LDAP makes it easy to manage the visibility of these applications.
Despite the fact that the product was released recently, it is essentially an enterprise wrapper for repeatedly approved Shiny + RMarkdown + R + LaTeX cubes.
In industrial operation, he showed himself excellently. Moreover, the question “why do we need other n + 1 established 'reporting systems'” hung on the air to which convincing answers have not yet been found.
PS
- All the screenshots are taken from a test bench and in principle do not contain real business indicators.
- The publication is informational, not educational. As practice shows, there is not enough time to figure out the essence of the mass of interesting and useful things. RStudio Connect deserves to get to know him, at least briefly. If you cook correctly, you can greatly reduce the company's current expenses for the analytical unit.
Previous post: "The 'Fifth Element' in the R. Ecosystem. WYSIWYG Interface for Analysts"
')
Source: https://habr.com/ru/post/326238/
All Articles