Millions of queries per second: a peaceful battle between PostgreSQL and MySQL with today's workload requirements
We have already mentioned that this year the topic of the PG Day'17 Russia conference has expanded significantly. Together with Percona, we formed a separate stream of speeches on MySQL / NoSQL . In addition to reports from leading experts in open databases and no sql solutions, the conference will also include 2 exclusive master classes from leading Percona experts - Peter Zaitsev and Sveta Smirnova .

The master classes will cover a variety of topics related to MySQL databases: creating and using a test server, debugging subtleties of slow queries, features of locking systems, the impact of equipment and configuration on performance, data collection with minimal server load.
')
Today we bring to your attention a translation of a small review in which Sveta Smirnova , a senior engineer of Percona technical support and Anastasia Raspopina , a marketing specialist, compare how PostgreSQL and MySQL cope with millions of queries per second.
On July 5, for the participants of PG Day'17, Svetlana will tell in more detail about the MySQL server architecture and the specifics of working with its various parts, such as the optimizer, table engines, locking systems.
Anastasia : Can open source databases handle a million requests per second? Many open source advocates will say yes. However, the allegations are not sufficient for substantiated evidence. That is why in this article we share the test results from Alexander Korotkov (director of development, Postgres Professional ) and Sveta Smirnova (chief maintenance engineer, Percona). A comparative performance study of PostgreSQL 9.6 and MySQL 5.7 will be especially useful for environments with multiple databases.
The idea of this study is to provide an honest comparison of two popular DBMSs. Sveta and Alexander wanted to test the latest versions of MySQL and PostgreSQL using the same tool with the same complex workloads and using the same configuration settings (where possible). However, since the PostgreSQL and MySQL ecosystems evolved independently of each other, with the standard testing tools ( pgbench and SysBench ) used for each database, it was not easy.
The task lay on the database experts with many years of practical experience. Sveta worked as a senior technical support engineer at the MySQL support team error checking team at Oracle for more than eight years, and since 2015 she has been working as a chief maintenance engineer for Percona. Alexander Korotkov is one of the main PostgreSQL developers and developers of a number of PostgreSQL functions, including the CREATE ACCESS METHOD command, a common WAL interface, a non-blocking Pin / UnpinBuffer, an index search for regular expressions, and much more. So, we got a pretty decent cast for this play!
Sveta : Dmitry Kravchuk regularly publishes detailed test results for MySQL, so the task was not to confirm that MySQL can execute millions of queries per second. As our graphs show, we have already overcome this mark. As a support engineer, I often encounter clients working in a heterogeneous environment with different databases, and I wanted to understand the influence of transferring tasks from one database to another. So I was pleased to be able to work with Postgres Professional and identify the strengths and weaknesses of these two databases.
We wanted to test both databases on the same hardware using the same tools and tests. We were going to test the basic functionality and then work on more detailed comparisons. Thus, we could compare various real-life usage scenarios and their most popular variations.
Spoiler : We are far from the final results. This is the beginning of a series of articles.
Open source databases on large machines, series 1: “It was close ...”
Postgres Professional with Freematiq provided two powerful modern machines for tests.
Equipment configuration:
Please note that machines with a smaller number of processor cores and faster disks are more often used for MySQL installations than machines with a larger number of cores.
The first thing we needed to agree on was which tool to use. A fair comparison only makes sense if the workloads are as close as possible.
The standard PostgreSQL tool for performance testing is pgbench , and for MySQL, SysBench . SysBench supports several database drivers and scripts for tests in the Lua programming language, so we decided to use this tool for both databases.
The initial plan was to convert the pgbench tests to the SysBench syntax on Lua, and then run the standard tests for both databases. After receiving the first results, we changed our tests to better explore the specific features of MySQL and PostgreSQL.
I converted the pgbench tests to the SysBench syntax and placed the tests in the open-database-bench repository on the GitHub.
And then we both faced difficulties.
As I wrote, I also ran tests on a Percona machine. For this converted test, the results were almost identical:
Percona machine:
Freematiq machine:
I began to understand. The only thing Percona was superior to Freematiq was the speed of the disk. Therefore, I started to run the read-only pgbench test, which was identical to the point select test of the SysBench with a full set of data in memory. But this time, SysBench used 50% of the available CPU resources:
Alexander, in turn, had problems with SysBench, which could not create a high load on PostgreSQL when using the prepared statements:
We contacted the author of SysBench Alexey Kopytov, and he proposed the following solution for MySQL:
• use SysBench with the parameters --percentile = 0 and --max-requests = 0 (reasonable CPU usage);
• use the concurrency_kit branch (best concurrency and Lua processing);
• rewrite Lua scripts to support prepared statements (pull request: github.com/akopytov/sysbench/pull/94 );
• run both SysBench and mysqld with the jemalloc or tmalloc library preloaded.
PostgreSQL fix is coming up. At the moment, Alexander has converted the standard SysBench test into the pgbench format , and we are stalled. Not so much for MySQL, but at least we had a starting point for comparison.
The next difficulty I encountered is the default operating system settings. In short, I changed them to recommended (described below):
The same parameters were better for PostgreSQL performance. Alexander set up his car in the same way.
After solving these problems, we learned and implemented the following:
• we cannot use one tool (yet);
• Alexander wrote a test for pgbench, imitating standard SysBench tests;
• we still cannot write custom tests because we use different tools.
But we could use these tests as a starting point. After the work done by Alexander, we are stuck in the standard tests SysBench. I converted them to use prepared statements , and Alexander converted them to the pgbench format .
It is worth mentioning that I could not get the same results as Dmitry, for the Read Only and Point Select tests. They are similar, but a little slower. We need to figure out whether this is the result of using different hardware or a lack of performance testing skills on my part. Read-Write test results are the same.
There was another difference between the PostgreSQL and MySQL tests. MySQL users usually have many connections. Setting the max_connections variable to limit the total number of parallel connections to thousands is not uncommon these days. Although not recommended, people use this function even without the thread pool plugin . In real life, most of these compounds are inactive. But there is always a chance that they will all be involved in the event of an increase in the activity of the website.
For MySQL, I conducted tests for up to 1024 connections. I used the powers of two and the multipliers of the number of cores: 1, 2, 4, 8, 16, 32, 36, 64, 72, 128, 144, 256, 512 and 1024 threads.
For Alexander it was more important to conduct the test in smaller steps. He started with one thread and increased by 10 threads until he reached 250 parallel threads. Thus, you will see a more detailed graph for PostgreSQL, but there are no results after 250 threads.
Here are the results of the comparison.
Point select
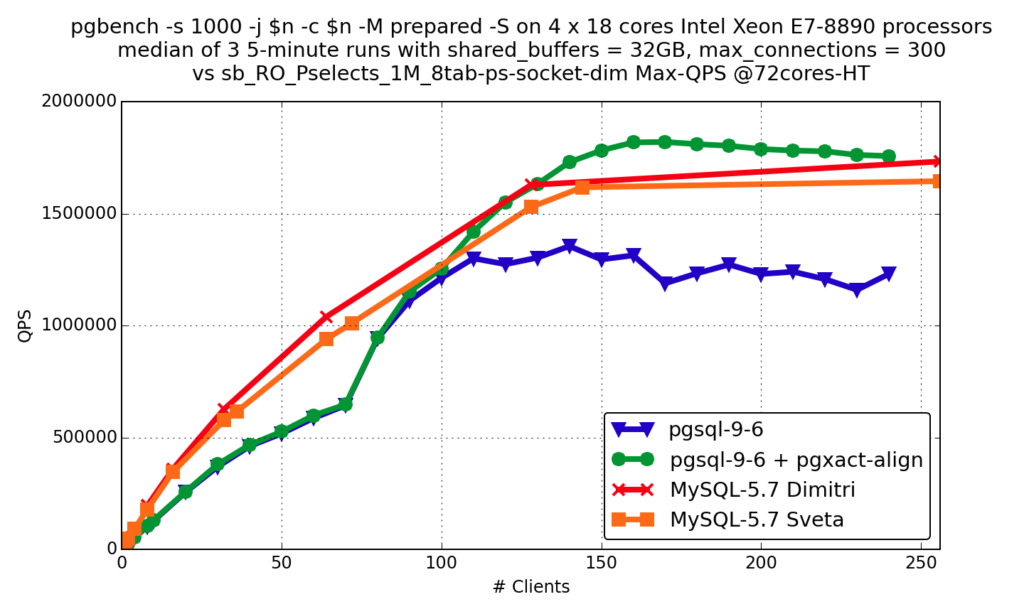
pgsql-9.6 - standard PostgreSQL
pgsql-9.6 + pgxact-align - PostgreSQL with this patch (more can be read in this article )
MySQL-5.7 Dimitri - Oracle MySQL Server
MySQL-5.7 Sveta - Percona 5.7.15 server
OLTP RO

OLTP RW
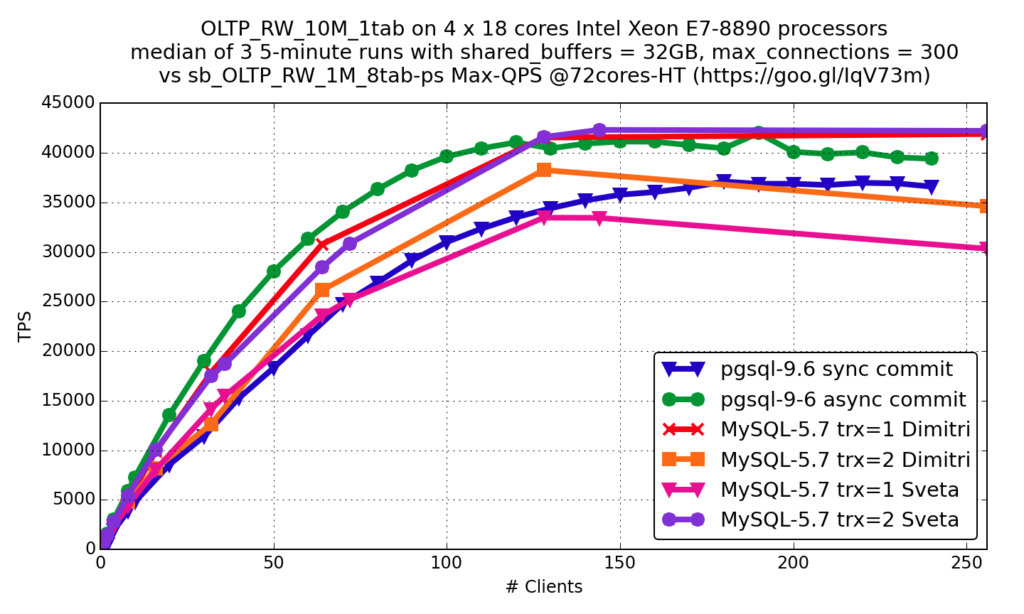
The synchronous transaction confirmation function (sync commit) in PostgreSQL is similar to innodb_flush_log_at_trx_commit = 1 in InnoDB, and the asynchronous commit is similar to innodb_flush_log_at_trx_commit = 2 .
You can see that the results are very similar: both databases develop very quickly and work well with modern equipment.
MySQL results that show 1024 streams for reference.
Point SELECT and OLTP RO
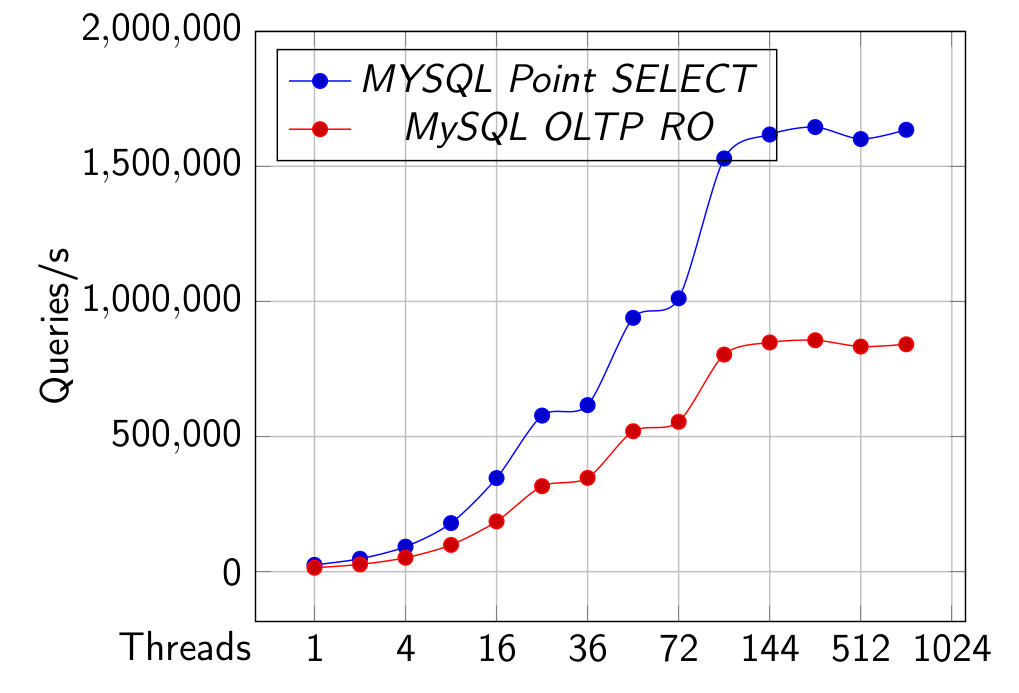
OLTP RW with innodb_flush_log_at_trx_commit set to 1 and 2

Having obtained these results, we conducted several special tests, which will be discussed in separate articles.
MySQL options for OLTP RO and Point SELECT tests:
MySQL options for OLTP RW:
MySQL SysBench options:
PostgreSQL pgbench options:
Functions in MySQL 5.7 that significantly improved performance:
Anastasia : The initial results of this study were made public at Percona Live Amsterdam 2016 . New interesting results were added to the second version of the same speech, which was presented at Moscow HighLoad ++ 2016 .
Further versions of the study will be available to all participants in the master class of Sveta at PG Day'17. If you have questions and suggestions on what aspects of PostgreSQL and MySQL performance you would like to know more, leave comments, we will take into account your wishes!
The master classes will cover a variety of topics related to MySQL databases: creating and using a test server, debugging subtleties of slow queries, features of locking systems, the impact of equipment and configuration on performance, data collection with minimal server load.
')
Today we bring to your attention a translation of a small review in which Sveta Smirnova , a senior engineer of Percona technical support and Anastasia Raspopina , a marketing specialist, compare how PostgreSQL and MySQL cope with millions of queries per second.
On July 5, for the participants of PG Day'17, Svetlana will tell in more detail about the MySQL server architecture and the specifics of working with its various parts, such as the optimizer, table engines, locking systems.
Anastasia : Can open source databases handle a million requests per second? Many open source advocates will say yes. However, the allegations are not sufficient for substantiated evidence. That is why in this article we share the test results from Alexander Korotkov (director of development, Postgres Professional ) and Sveta Smirnova (chief maintenance engineer, Percona). A comparative performance study of PostgreSQL 9.6 and MySQL 5.7 will be especially useful for environments with multiple databases.
The idea of this study is to provide an honest comparison of two popular DBMSs. Sveta and Alexander wanted to test the latest versions of MySQL and PostgreSQL using the same tool with the same complex workloads and using the same configuration settings (where possible). However, since the PostgreSQL and MySQL ecosystems evolved independently of each other, with the standard testing tools ( pgbench and SysBench ) used for each database, it was not easy.
The task lay on the database experts with many years of practical experience. Sveta worked as a senior technical support engineer at the MySQL support team error checking team at Oracle for more than eight years, and since 2015 she has been working as a chief maintenance engineer for Percona. Alexander Korotkov is one of the main PostgreSQL developers and developers of a number of PostgreSQL functions, including the CREATE ACCESS METHOD command, a common WAL interface, a non-blocking Pin / UnpinBuffer, an index search for regular expressions, and much more. So, we got a pretty decent cast for this play!
Sveta : Dmitry Kravchuk regularly publishes detailed test results for MySQL, so the task was not to confirm that MySQL can execute millions of queries per second. As our graphs show, we have already overcome this mark. As a support engineer, I often encounter clients working in a heterogeneous environment with different databases, and I wanted to understand the influence of transferring tasks from one database to another. So I was pleased to be able to work with Postgres Professional and identify the strengths and weaknesses of these two databases.
We wanted to test both databases on the same hardware using the same tools and tests. We were going to test the basic functionality and then work on more detailed comparisons. Thus, we could compare various real-life usage scenarios and their most popular variations.
Spoiler : We are far from the final results. This is the beginning of a series of articles.
Open source databases on large machines, series 1: “It was close ...”
Postgres Professional with Freematiq provided two powerful modern machines for tests.
Equipment configuration:
Processors: physical = 4, cores = 72, virtual = 144, hyperthreading = yes
Memory: 3 TB
Disk speed: about 3K IOPS
OS: CentOS 7.1.1503
File System: XFS
I also used a less productive Percona machine.
Equipment configuration:
Processors: physical = 2, cores = 12, virtual = 24, hyperthreading = yes
Memory: 251.9 GB
Disk speed: about 33K IOPS
OS: Ubuntu 14.04.5 LTS
File System: EXT4
Please note that machines with a smaller number of processor cores and faster disks are more often used for MySQL installations than machines with a larger number of cores.
The first thing we needed to agree on was which tool to use. A fair comparison only makes sense if the workloads are as close as possible.
The standard PostgreSQL tool for performance testing is pgbench , and for MySQL, SysBench . SysBench supports several database drivers and scripts for tests in the Lua programming language, so we decided to use this tool for both databases.
The initial plan was to convert the pgbench tests to the SysBench syntax on Lua, and then run the standard tests for both databases. After receiving the first results, we changed our tests to better explore the specific features of MySQL and PostgreSQL.
I converted the pgbench tests to the SysBench syntax and placed the tests in the open-database-bench repository on the GitHub.
And then we both faced difficulties.
As I wrote, I also ran tests on a Percona machine. For this converted test, the results were almost identical:
Percona machine:
OLTP test statistics: transactions: 1000000 (28727.81 per sec.) read/write requests: 5000000 (143639.05 per sec.) other operations: 2000000 (57455.62 per sec.) Freematiq machine:
OLTP test statistics: transactions: 1000000 (29784.74 per sec.) read/write requests: 5000000 (148923.71 per sec.) other operations: 2000000 (59569.49 per sec.) I began to understand. The only thing Percona was superior to Freematiq was the speed of the disk. Therefore, I started to run the read-only pgbench test, which was identical to the point select test of the SysBench with a full set of data in memory. But this time, SysBench used 50% of the available CPU resources:
PID USER PR NI VIRT RES SHR S %CPU %MEM TIME+ COMMAND 4585 smirnova 20 0 0,157t 0,041t 9596 S 7226 1,4 12:27.16 mysqld 8745 smirnova 20 0 1266212 629148 1824 S 7126 0,0 9:22.78 sysbench Alexander, in turn, had problems with SysBench, which could not create a high load on PostgreSQL when using the prepared statements:
93087 korotkov 20 0 9289440 3,718g 2964 S 242,6 0,1 0:32.82 sysbench 93161 korotkov 20 0 32,904g 81612 80208 S 4,0 0,0 0:00.47 postgres 93116 korotkov 20 0 32,904g 80828 79424 S 3,6 0,0 0:00.46 postgres 93118 korotkov 20 0 32,904g 80424 79020 S 3,6 0,0 0:00.47 postgres 93121 korotkov 20 0 32,904g 80720 79312 S 3,6 0,0 0:00.47 postgres 93128 korotkov 20 0 32,904g 77936 76536 S 3,6 0,0 0:00.46 postgres 93130 korotkov 20 0 32,904g 81604 80204 S 3,6 0,0 0:00.47 postgres 93146 korotkov 20 0 32,904g 81112 79704 S 3,6 0,0 0:00.46 postgres We contacted the author of SysBench Alexey Kopytov, and he proposed the following solution for MySQL:
• use SysBench with the parameters --percentile = 0 and --max-requests = 0 (reasonable CPU usage);
• use the concurrency_kit branch (best concurrency and Lua processing);
• rewrite Lua scripts to support prepared statements (pull request: github.com/akopytov/sysbench/pull/94 );
• run both SysBench and mysqld with the jemalloc or tmalloc library preloaded.
PostgreSQL fix is coming up. At the moment, Alexander has converted the standard SysBench test into the pgbench format , and we are stalled. Not so much for MySQL, but at least we had a starting point for comparison.
The next difficulty I encountered is the default operating system settings. In short, I changed them to recommended (described below):
vm.swappiness=1 cpupower frequency-set --governor performance kernel.sched_autogroup_enabled=0 kernel.sched_migration_cost_ns= 5000000 vm.dirty_background_bytes=67108864 vm.dirty_bytes=536870912 IO scheduler [deadline] The same parameters were better for PostgreSQL performance. Alexander set up his car in the same way.
After solving these problems, we learned and implemented the following:
• we cannot use one tool (yet);
• Alexander wrote a test for pgbench, imitating standard SysBench tests;
• we still cannot write custom tests because we use different tools.
But we could use these tests as a starting point. After the work done by Alexander, we are stuck in the standard tests SysBench. I converted them to use prepared statements , and Alexander converted them to the pgbench format .
It is worth mentioning that I could not get the same results as Dmitry, for the Read Only and Point Select tests. They are similar, but a little slower. We need to figure out whether this is the result of using different hardware or a lack of performance testing skills on my part. Read-Write test results are the same.
There was another difference between the PostgreSQL and MySQL tests. MySQL users usually have many connections. Setting the max_connections variable to limit the total number of parallel connections to thousands is not uncommon these days. Although not recommended, people use this function even without the thread pool plugin . In real life, most of these compounds are inactive. But there is always a chance that they will all be involved in the event of an increase in the activity of the website.
For MySQL, I conducted tests for up to 1024 connections. I used the powers of two and the multipliers of the number of cores: 1, 2, 4, 8, 16, 32, 36, 64, 72, 128, 144, 256, 512 and 1024 threads.
For Alexander it was more important to conduct the test in smaller steps. He started with one thread and increased by 10 threads until he reached 250 parallel threads. Thus, you will see a more detailed graph for PostgreSQL, but there are no results after 250 threads.
Here are the results of the comparison.
Point select
pgsql-9.6 - standard PostgreSQL
pgsql-9.6 + pgxact-align - PostgreSQL with this patch (more can be read in this article )
MySQL-5.7 Dimitri - Oracle MySQL Server
MySQL-5.7 Sveta - Percona 5.7.15 server
OLTP RO
OLTP RW
The synchronous transaction confirmation function (sync commit) in PostgreSQL is similar to innodb_flush_log_at_trx_commit = 1 in InnoDB, and the asynchronous commit is similar to innodb_flush_log_at_trx_commit = 2 .
You can see that the results are very similar: both databases develop very quickly and work well with modern equipment.
MySQL results that show 1024 streams for reference.
Point SELECT and OLTP RO
OLTP RW with innodb_flush_log_at_trx_commit set to 1 and 2
Having obtained these results, we conducted several special tests, which will be discussed in separate articles.
Additional Information
MySQL options for OLTP RO and Point SELECT tests:
# general table_open_cache = 8000 table_open_cache_instances=16 back_log=1500 query_cache_type=0 max_connections=4000 # files innodb_file_per_table innodb_log_file_size=1024M innodb_log_files_in_group=3 innodb_open_files=4000 # Monitoring innodb_monitor_enable = '%' performance_schema=OFF #cpu-bound, matters for performance #Percona Server specific userstat=0 thread-statistics=0 # buffers innodb_buffer_pool_size=128000M innodb_buffer_pool_instances=128 #to avoid wait on InnoDB Buffer Pool mutex innodb_log_buffer_size=64M # InnoDB-specific innodb_checksums=1 #Default is CRC32 in 5.7, very fast innodb_use_native_aio=1 innodb_doublewrite= 1 #https://www.percona.com/blog/2016/05/09/percona-server-5-7-parallel-doublewrite/ innodb_stats_persistent = 1 innodb_support_xa=0 #(We are read-only, but this option is deprecated) innodb_spin_wait_delay=6 #(Processor and OS-dependent) innodb_thread_concurrency=0 join_buffer_size=32K innodb_flush_log_at_trx_commit=2 sort_buffer_size=32K innodb_flush_method=O_DIRECT_NO_FSYNC innodb_max_dirty_pages_pct=90 innodb_max_dirty_pages_pct_lwm=10 innodb_lru_scan_depth=4000 innodb_page_cleaners=4 # perf special innodb_adaptive_flushing = 1 innodb_flush_neighbors = 0 innodb_read_io_threads = 4 innodb_write_io_threads = 4 innodb_io_capacity=2000 innodb_io_capacity_max=4000 innodb_purge_threads=4 innodb_max_purge_lag_delay=30000000 innodb_max_purge_lag=0 innodb_adaptive_hash_index=0 (depends on workload, always check) MySQL options for OLTP RW:
#Open files table_open_cache = 8000 table_open_cache_instances = 16 query_cache_type = 0 join_buffer_size=32k sort_buffer_size=32k max_connections=16000 back_log=5000 innodb_open_files=4000 #Monitoring performance-schema=0 #Percona Server specific userstat=0 thread-statistics=0 #InnoDB General innodb_buffer_pool_load_at_startup=1 innodb_buffer_pool_dump_at_shutdown=1 innodb_numa_interleave=1 innodb_file_per_table=1 innodb_file_format=barracuda innodb_flush_method=O_DIRECT_NO_FSYNC innodb_doublewrite=1 innodb_support_xa=1 innodb_checksums=1 #Concurrency innodb_thread_concurrency=144 innodb_page_cleaners=8 innodb_purge_threads=4 innodb_spin_wait_delay=12 Good value for RO is 6, for RW and RC is 192 innodb_log_file_size=8G innodb_log_files_in_group=16 innodb_buffer_pool_size=128G innodb_buffer_pool_instances=128 #to avoid wait on InnoDB Buffer Pool mutex innodb_io_capacity=18000 innodb_io_capacity_max=36000 innodb_flush_log_at_timeout=0 innodb_flush_log_at_trx_commit=2 innodb_flush_sync=1 innodb_adaptive_flushing=1 innodb_flush_neighbors = 0 innodb_max_dirty_pages_pct=90 innodb_max_dirty_pages_pct_lwm=10 innodb_lru_scan_depth=4000 innodb_adaptive_hash_index=0 innodb_change_buffering=none #can be inserts, workload-specific optimizer_switch="index_condition_pushdown=off" #workload-specific MySQL SysBench options:
LD_PRELOAD=/data/sveta/5.7.14/lib/mysql/libjemalloc.so /data/sveta/sbkk/bin/sysbench [ --test=/data/sveta/sysbench/sysbench/tests/db/oltp_prepared.lua | --test=/data/sveta/sysbench/sysbench/tests/db/oltp_simple_prepared.lua ] --db-driver=mysql --oltp-tables-count=8 --oltp-table-size=10000000 --mysql-table-engine=innodb --mysql-user=msandbox --mysql-password=msandbox --mysql-socket=/tmp/mysql_sandbox5715.sock --num-threads=$i --max-requests=0 --max-time=300 --percentile=0 [--oltp-read-only=on --oltp-skip-trx=on] PostgreSQL pgbench options:
$ git clone https://github.com/postgrespro/pg_oltp_bench.git $ cd pg_oltp_bench $ make USE_PGXS=1 $ sudo make USE_PGXS=1 install $ psql DB -f oltp_init.sql $ psql DB -c "CREATE EXTENSION pg_oltp_bench;" $ pgbench -c 100 -j 100 -M prepared -f oltp_ro.sql -T 300 -P 1 DB $ pgbench -c 100 -j 100 -M prepared -f oltp_rw.sql -T 300 -P 1 DB Functions in MySQL 5.7 that significantly improved performance:
- InnoDB: transaction list optimization:
- InnoDB: decrease contention for lock_sys_t :: mutex:
- InnoDB: fix contention index-> lock:
- InnoDB: accelerated and parallel page dumping to disk:
- MDL scalability (Meta-Data Lock):
- removing THR_LOCK :: mutex for InnoDB: Wl # 6671 ;
- partitioned LOCK_grant;
- the number of partitions is constant;
- use stream ID to assign partition:
- Non-blocking MDL lock for DML:
Anastasia : The initial results of this study were made public at Percona Live Amsterdam 2016 . New interesting results were added to the second version of the same speech, which was presented at Moscow HighLoad ++ 2016 .
Further versions of the study will be available to all participants in the master class of Sveta at PG Day'17. If you have questions and suggestions on what aspects of PostgreSQL and MySQL performance you would like to know more, leave comments, we will take into account your wishes!
Source: https://habr.com/ru/post/326204/
All Articles