Google Benchmark Library

Not so long ago I wrote about C ++ libraries for microbenchmarking. I talked about three libraries: Nonius, Hayai and Celero. But in reality, I wanted to talk about the fourth. My Windows then did not support the Google Benchmark library, so I could not test it. Fortunately, from the comments on the previous post I learned that the library is now available in Visual Studio!
Let's see how you can use it.
Library
→ Main github repository
→ Discussion
')
Thanks to KindDragon: Support MSVC on appveyor , we can build the library in Visual Studio. I easily downloaded the latest code from the repository, generated the solution files using CMake and compiled the required version. To use the library in your project, it remains only to include the library itself and one header file.
Simple example
In the original article, I conducted two experiments:
IntToStringConversionTest(count)- converts integers from the range 0 ... count-1 into strings and returns the vector of these strings.DoubleToStringConversionTest(count)- converts 0.12345 ... count-1 + 0.12345 into strings and returns a string vector.
An example of benchmarks entirely:
#include "benchmark/benchmark_api.h" #include "../commonTest.h" void IntToString(benchmark::State& state) { while (state.KeepRunning()) { benchmark::DoNotOptimize( IntToStringConversionTest(state.range_x()) ); } } BENCHMARK(IntToString)->Arg(TEST_NUM_COUNT1000); void DoubleToString(benchmark::State& state) { while (state.KeepRunning()) { benchmark::DoNotOptimize( DoubleToStringConversionTest(state.range_x()) ); } } BENCHMARK(DoubleToString)->Arg(TEST_NUM_COUNT1000); BENCHMARK_MAIN() Beautiful and simple! The
BENCHMARK macro is used to define the benchmark, then you can add call parameters. In the example above, I used the Arg method. The parameter in this method is passed to the state object, which is available to the benchmark function. In our example, we get this value using state.range_x() . It is then used as the size of the output row vector.Inside the benchmark function in the while loop, the main code is executed. The library will automatically select the number of iterations.
Typically, an application runs in the console and displays the following result:
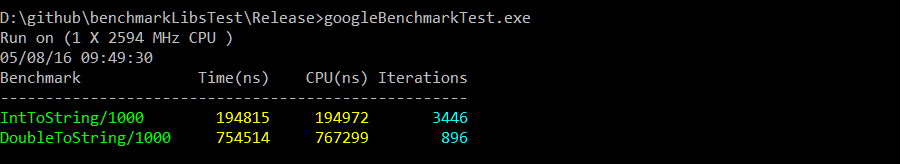
The conclusion is very simple: the name of the benchmark, the time in nanoseconds (can be changed using the
Unit() method), the CPU time, the number of iterations performed.Why is this library so good?
- You can easily change the parameters: Arg, ArgPair, Range, RangePair, Apply.
- Values can be obtained using
state.get_x(),state.get_y() - So you can create benchmarks for tasks in one- and two-dimensional space.
- Values can be obtained using
- Fixture
- Measurements in multiple streams
- Manual time management: useful when code is executed on a GPU or other device where the standard CPU time is not applicable.
- Output formats: as table, CSV, Json
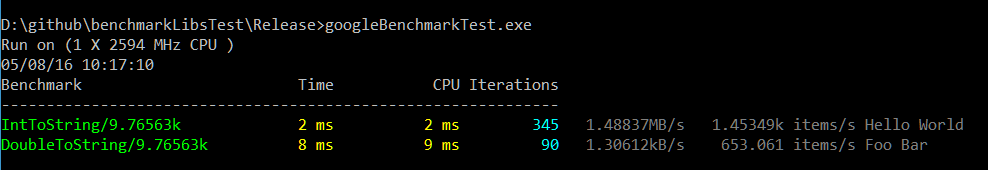
- The ability to add your own labels using
state.SetLabel() - Tags for processed objects and processed bytes, thanks to
state.SetItemsProcessed()andstate.SetBytesProcessed()
This is how the output of the benchmark with bytes per second, objects per second, labels and modified time units looks like.
Complicated example
In another post about libraries for micro-benchmarking, I tested the libraries with a slightly more complex example. This is my usual benchmark - a vector of pointers against the vector of objects. See if we can implement this example using Google Benchmark.
Customization
Here is what we are going to test:
- The class Particle (particle) - contains 18 float attributes: 4 to indicate movement (pos), 4 to designate speed (vel), 4 to accelerate (acceleration), 4 for color (color), 1 for time (time), 1 for rotation (rotation). We will also have a buffer, also of type float, with a variable number of elements in it.
- The standard particle is 76 bytes.
- Increased particle - 160 bytes
- We want to measure the speed of the Update method on the particle vector.
- We will use five types of containers:
vector<Particle>vector<shared_ptr<Particle>>- with randomization in memoryvector<shared_ptr<Particle>>- without memory randomizationvector<unique_ptr<Particle>>- with randomization in memoryvector<unique_ptr<Particle>>- without memory randomization
Some code
Sample code for
vector<Particle> : template <class Part> class ParticlesObjVectorFixture : public ::benchmark::Fixture { public: void SetUp(const ::benchmark::State& st) { particles = std::vector<Part>(st.range_x()); for (auto &p : particles) p.generate(); } void TearDown(const ::benchmark::State&) { particles.clear(); } std::vector<Part> particles; }; But the benchmark:
using P76Fix = ParticlesObjVectorFixture<Particle>; BENCHMARK_DEFINE_F(P76Fix, Obj)(benchmark::State& state) { while (state.KeepRunning()) { UpdateParticlesObj(particles); } } BENCHMARK_REGISTER_F(P76Fix, Obj)->Apply(CustomArguments); using P160Fix = ParticlesObjVectorFixture<Particle160>; BENCHMARK_DEFINE_F(P160Fix, Obj)(benchmark::State& state) { while (state.KeepRunning()) { UpdateParticlesObj(particles); } } BENCHMARK_REGISTER_F(P160Fix, Obj)->Apply(CustomArguments); With this code, we test two types of particles: small - 76 bytes and more - 160 bytes. The CustomArguments method generates the number of particles for each iteration of the benchmark: 1k, 3k, 5k, 7k, 9k, 11k.
results
In this post we focused on the library itself, but I would like to answer the question I was asked earlier - the question about the different particle sizes. So far I have used only two types: 76-byte and 160-byte.
Results for 76 bytes:

Randomized pointers are almost 76% slower than object vectors.
Results for 160 bytes:
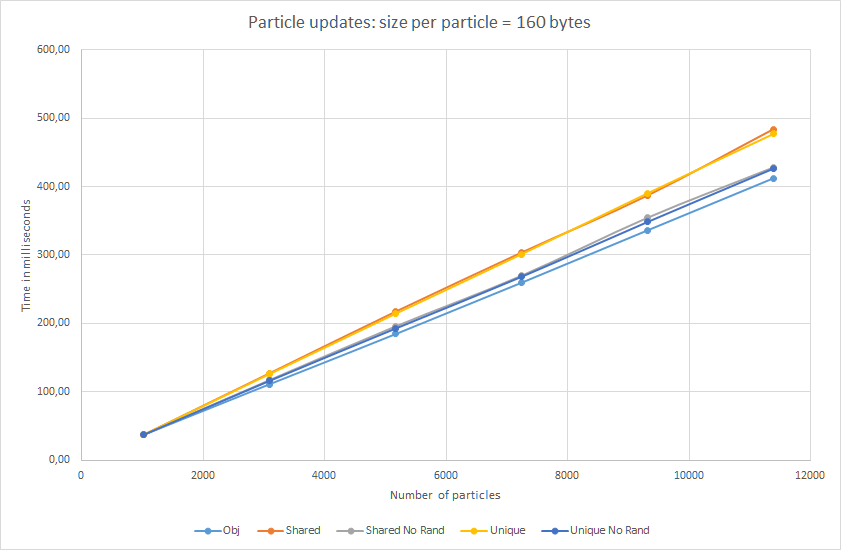
Almost straight lines in the case of large particles! Randomized pointers are only 17% slower ... Well, let them not quite straight :)
In addition, we tested and
unique_ptr . As you can see, in terms of update (data access), the speed is almost the same as that of shared_ptr . Therefore, indirect handling is a smart pointer problem, not an inevitable overhead.Total
Repository with code examples
I had no difficulty using the Google Benchmark library. You can learn the basic principles of writing benchmarks in a few minutes. Multi-threaded benchmarks, fixture, automatic selection of the number of iterations, output in CSV or Json format - that’s all the basic functions. Personally, I like most the flexibility of passing parameters to the benchmark code. The rest of the libraries I checked had problems in order to transfer the parameters of the problem area to the benchmark. The simplest from this point of view was Celero.
It lacks, perhaps, only an expanded display of results. The library shows us only the average time to perform iterations. Although in most cases this is enough.
From the point of view of the experiment, I obtained interesting results for particles of different sizes. This can be the basis for a future final test. I will try to rewrite my examples with a wide variety of object sizes. I expect to see a huge difference in the results for small objects and a slight one for large ones.
Oh, and come to work with us? :)wunderfund.io is a young foundation that deals with high-frequency algorithmic trading . High-frequency trading is a continuous competition of the best programmers and mathematicians of the whole world. By joining us, you will become part of this fascinating fight.
We offer interesting and challenging data analysis and low latency tasks for enthusiastic researchers and programmers. Flexible schedule and no bureaucracy, decisions are quickly made and implemented.
Join our team: wunderfund.io
Source: https://habr.com/ru/post/325634/
All Articles