Second honorary. Notes of the participant of the contest Dstl Satellite Imagery Feature Detection

Recently, the Dstl Satellite Imagery Feature Detection Machine Learning Competition ended in which as many as three Avito employees took part. I want to share the experience of participation on my behalf and talk about the decision.
Task Description
The task was to develop an algorithm for segmentation of objects on satellite images.

')
Given multispectral images taken in different wavelength ranges. The pictures also differ in resolution and due to the nature of the shooting, some channels are slightly offset relative to each other.
You need to predict objects of 10 classes:
Class 1: Buildings (just buildings, nothing remarkable)
Class 2: Structures (fences that are even a few pixels wide even on the largest shots)
Class 3: Roads (asphalt roads and highways)
Class 4: Dirt Roads
Class 5: Trees (can grow both singly and in groups)
Class 6: Fields (distinguished by growing something on them)
Class 7: Fast water (rivers, fragments of the sea, large bodies of water)
Class 8: Slow water (lakes, dry rivers)
Class 9: Large transport (trucks, buses)
Class 10: Small transport (cars and motorcycles).
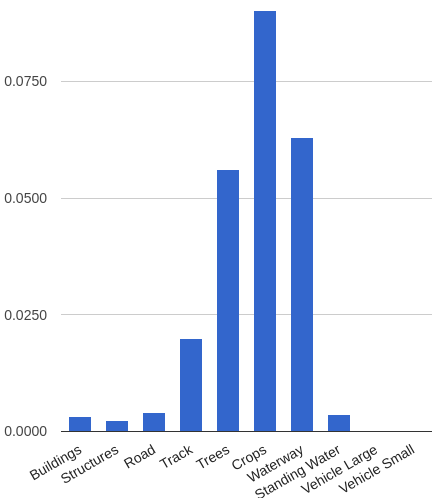
The metric is the Average Jaccard Index averaged over all classes, which is defined as the ratio of the intersection area to the area of the union. In this case, intersection and union are class masks. At the same time, each class made the same contribution to the general metric, but the areas of each class were very different. The histogram shows the proportion of the area of each class relative to the entire area. For class 6 (fields), the area share was 0.6, and for the last two classes, 0.0001.
Separately, it is worth noting the amount of data. We were given 25 marked areas. While there were 425 of them in the test. Of these, the public leaderboard was built at 19% each, and the rest was 81% private. As usual, the public served as a matter of fact in order to check his decision and compare the result with other participants. And the final rating was made only for the private part. However, it was obvious to me that once in public 81 shots, this check is much safer than any local validation of 25 shots, and if I got a discrepancy between the metrics on the local check and the leaderboard, I trusted the leaderboard. How wrong I was ... But about that closer to the end.
Lyrical digression
There were quite a few participants in the competition and I understand perfectly why, because I myself could not decide to participate for a long time, because there were a lot of problems in the organization. First, the orgs gave out the masks not in the form of pictures, but in the form of polygons in the csv file and it was necessary to convert them into the required size. Secondly, each time to predict 425 pictures of the test is a long time. Thirdly, it was necessary to send the organizers not masks in the form of pixels, as the algorithm usually produces, but the same csv file with polygons as from the training set. And each stage affects the final metric, and since this is a contest, you will have to lick each procedure. But I still decided for three reasons:
- work colleague Dmitry Tsybulevsky has already participated and told that the contest is interesting, it allows you to try many tricks and experiment with the architecture of the neural networks (well, even solving problems with converting masks is more interesting than just teaching xgboost on top of obfuscated features);
- also Vladimir Iglovikov aggressively agitated to participate in ODS Slack and argued that there would be a struggle for something meaningful, and not for the 4th decimal in the metric (how wrong he was ...);
- Well, in the end, I made the final decision when Konstantin Lopukhin laid out a script that solved the last problem with converting masks into polygons.
Baseline
Before rushing to clone repositories with State of the Art segmentation solutions, I decided to make a simple solution that could continuously improve. In my opinion, this is a good practice not only for almost any competition, but in general for any machine learning task.
Accordingly, I chose the scripts posted on the forum and collected the following pipeline from them:
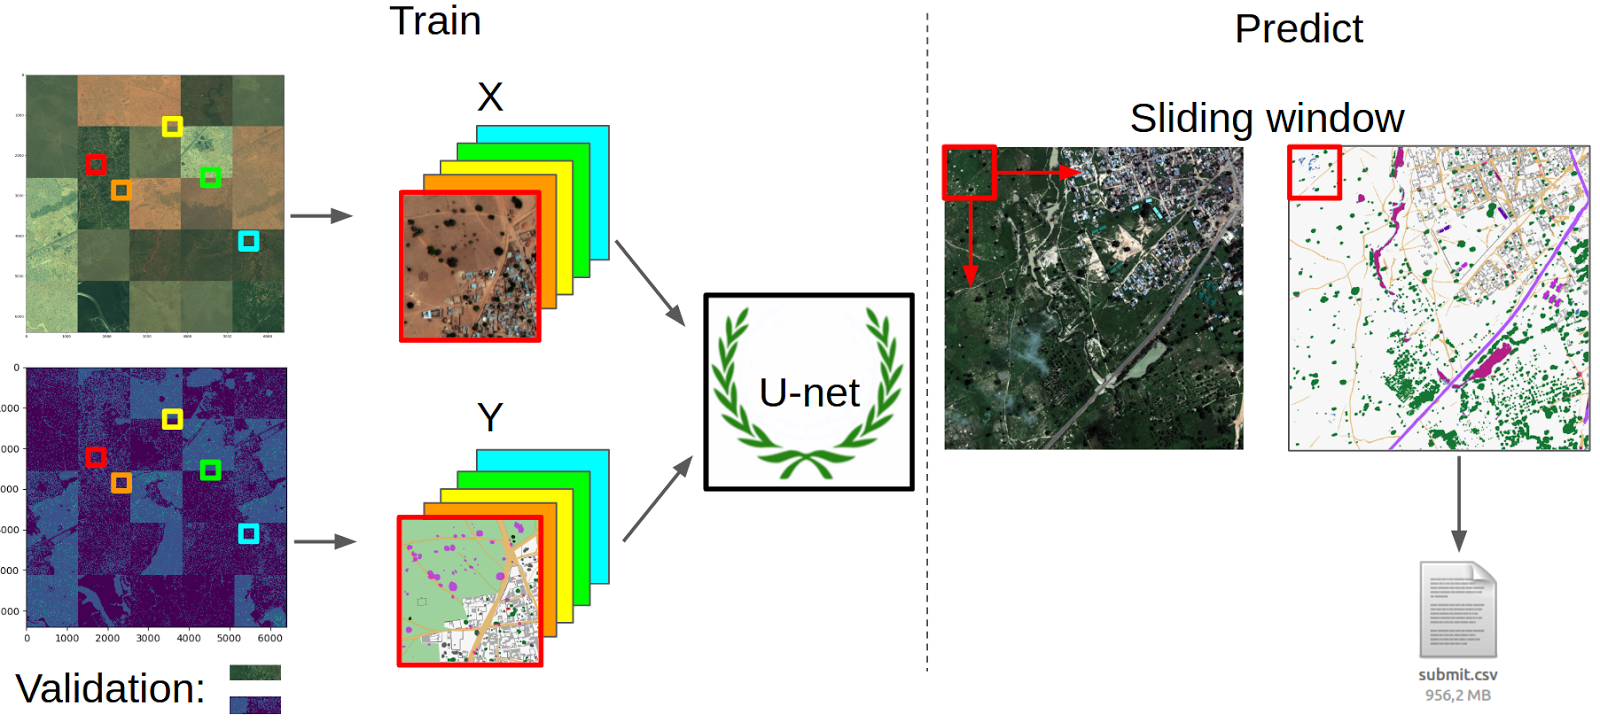
Preprocessing and data preparation
I took all the images from the M-band, scaled them to the same size for convenience (with the resize being no more than 1%) and collected a large 5x5 mosaic of them. He did the same with masks. Then, from the same for the image and the mask of random places, I cut crocs with the size of a network input and output (128 x 128 pixels), thereby forming a queue for learning. However, not all samples were taken, but only those with a fraction of the class mask area of the total area above the threshold. I picked up the thresholds for each class with my hands so that sampling was more or less evenly. Then the images in each queue were brought to the range (-1, 1). Also for validation, I cut a small strip from the picture, which contained all the classes and replaced it with a copy of the next piece of the picture in the train.
Neural network training
As a neural network, I chose U-net . This neural network is similar in structure to a normal encoder-decoder, but with forwarding features from the encoder-part to the decoder at stages corresponding in size.

U-net performed well in another Kaggle contest with nerve segmentation. In addition, I found the code with her for Keras. As a loss function, the target metric approximation was used. The optimizer was taken by Adam, because as a rule, I got good results with him in tasks, when it is not clear by what criterion to reduce the learning rate.
Predictions
To predict the mask, I used a regular sliding window. Those. each dough picture is cut into patches, they are predicted and then collected back. By construction, the neural network gives the probability that each class is in a particular pixel. Accordingly, in order to get a binary mask, you need to select a threshold, which I did on the basis of the maximum metric on local validation. Predicting the masks, I used the Bones script and received my submit.
As a result, Caggle even accepted it. I decided that it was a success and ran to form my code in the form of kernel . At that time, no one laid out the full pipeline from the beginning to the end, so the script was adopted very positively. And then for several days I saw new people appear on the leaderboard with about my speed. Well, the kernel got the most votes and comments in this competition.

However, my joy was short-lived. I had an objectively low speed, and I could not understand the reason. She was found by Rasim Akhunzyanov. For some reason, after bringing all the images to the range (0, 1), I translated floats into ints. This fact was noted in the comments to the script and from that moment on anyone could get a working version of the script.
However, I did not fix the bug in the code. Firstly, it is instructive to read at least the comments, and even better to understand the code, and not to run mindlessly a 4-page canvas. Secondly, even with a bug, the code perfectly performed its function, namely: attracting new participants. Thirdly, even with a bug, it still fit into the concept of a simple solution that can be continuously improved.
An example of successful use of the script is the result of Misha Kamenshchikov . In Avito, he is engaged in recommendations and I decided to plant him on the DL, having sold this contest to him. Misha fixed bugs, over the weekend he trained his model with minor modifications and used another public script for water . This allowed him to finish in 46th place and get the first silver medal.
My decision
Generally speaking, my decision was not very different from Baseline in terms of the overall campaign, but I made a number of significant improvements.
- Conv + ReLu → Conv + BN + ReLu.
In vanilla U-net, the normalization batch layer was not used. I added it. And so did almost all the participants. He improved the convergence of all. - Augmentation: rotation at an arbitrary angle, vertical and horizontal flip. The obvious thing, without which training of picture neural networks is now complete.
- Hard negative mining.
It is worth staying in more detail. I refused to sample patches with a fraction of the class mask above the threshold and decided to take all the samples. But after learning the neural network on the sample set, I predicted the masks on it. And for each class I chose the top 100 samples, where there is a class mask and where the metric is the worst. And then add these samples to the next iteration. Thus, I killed two birds with one stone: Now in each era there were samples of each class and in each era there were "difficult" samples. I didn’t make a direct comparison, but it felt like the network converged much faster.
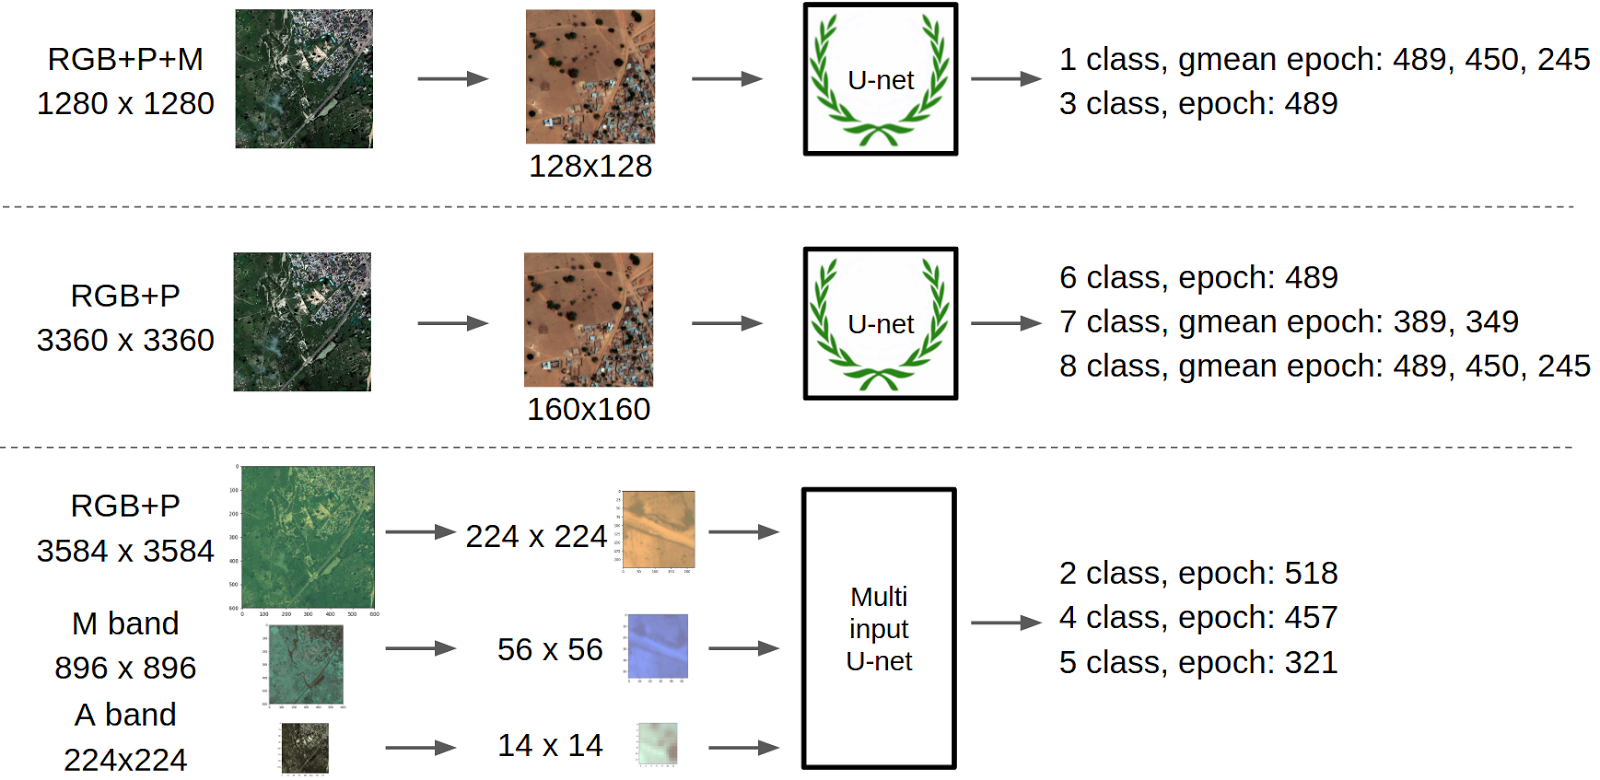
With such improvements, I trained two more networks that entered the final ensemble. But the best, in my opinion, find was a network with three entrances:
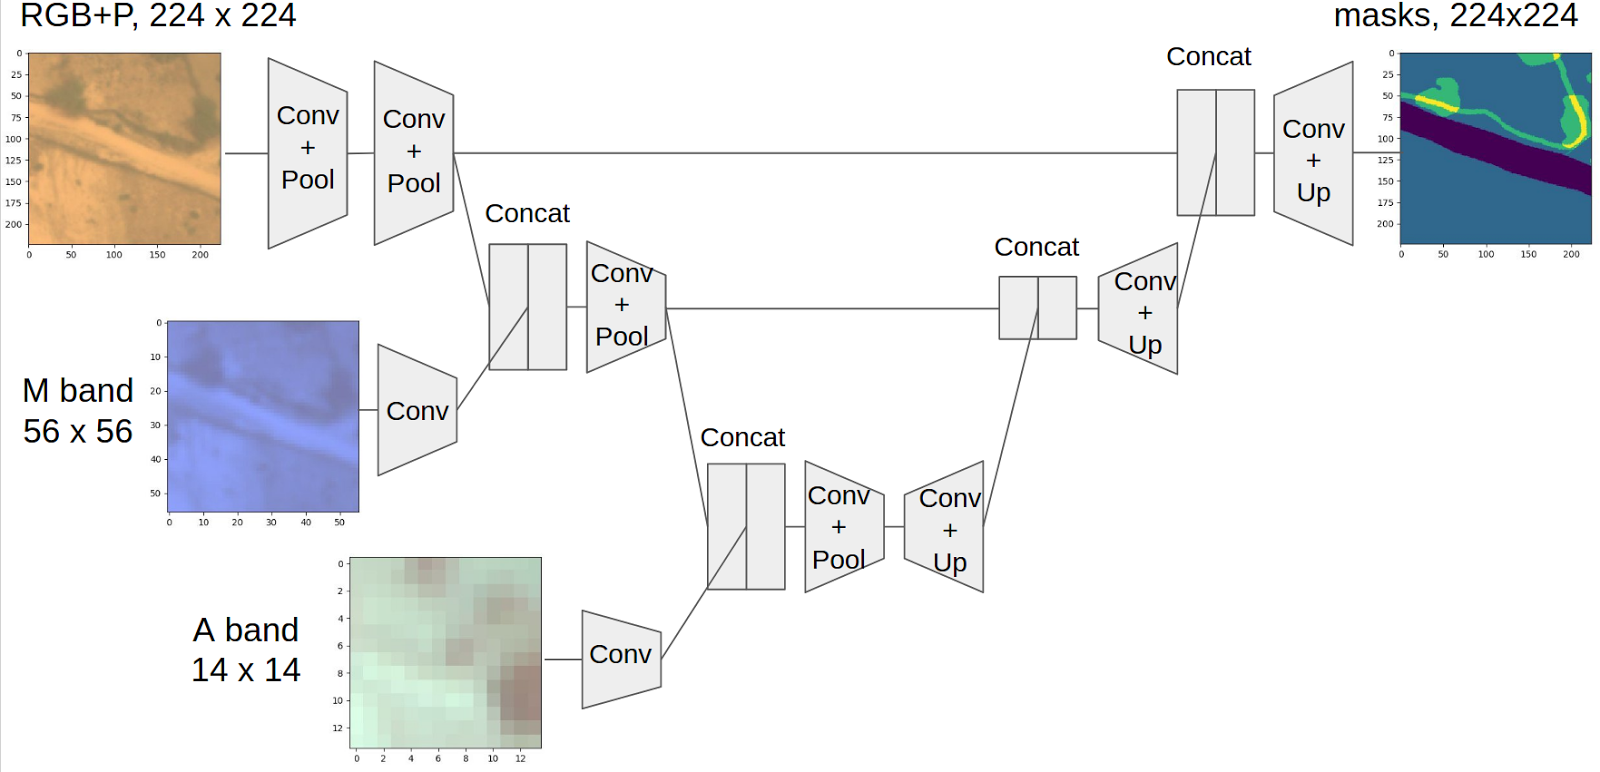
This concept was born in the process of discussion with Dmitry Tsybulevsky. The problem with pictures in this contest is that different channels have very different resolutions and if you want to use all the information, then you need to bring everything to the same size. But if you decrease it, the resolution is lost and such classes as man-made structures will disappear altogether. Well, if you bring everything to the largest size, then you need to increase, say, A-band by 20 times, which looks extremely unwise. On the other hand, the image when passing through a neural network after each layer with pulling becomes effectively smaller.
Accordingly, the idea was born to add new pictures as the size of the main brunch of the U-net encoder part decreases. To do this, RGB and P-bands in the size of 224x224 were fed to the first output, after two pullings, the main branch was concatenated with the M-band and then after two more A-band pulling. At the same time, all the bands had the same physical area. To do this, I still had to increase the smallest channel 1.5 times, but this is acceptable. Each channel concocted after a layer of convolution. This was done in order not to concatenate the grid view and the raw images as features of different nature. In this regard, I received a fair criticism that this is still not enough, because the picture in the main branch went through more layers of bundles than the picture from the second and especially the third entry. And, most likely, this is true, and the architecture with large numbers of bundles for each subsequent input will work better, but I did not do this kind of optimization of hyperparameters. Complete scheme
Features of training
As a rule, the learning process of deep convolutional neural networks for image recognition is quite understandable. Especially after the weights of the State of Art Architecture with Imagenet were developed and laid out. However, in this task it was not easy to just take and train a neural network so that it flew smoothly into the global minimum. First, for a long time in ODS Slack no one could offer a reliable local validation scheme that would give an unambiguous correspondence with the leaderboard, and in the end we learned why. Secondly, the network was quite loose from epoch to epoch, and sometimes neighboring epochs for one architecture differed more in the quality of predictions than the predictions of another neural network.
If you build a learning log on local validation, it looks like this:
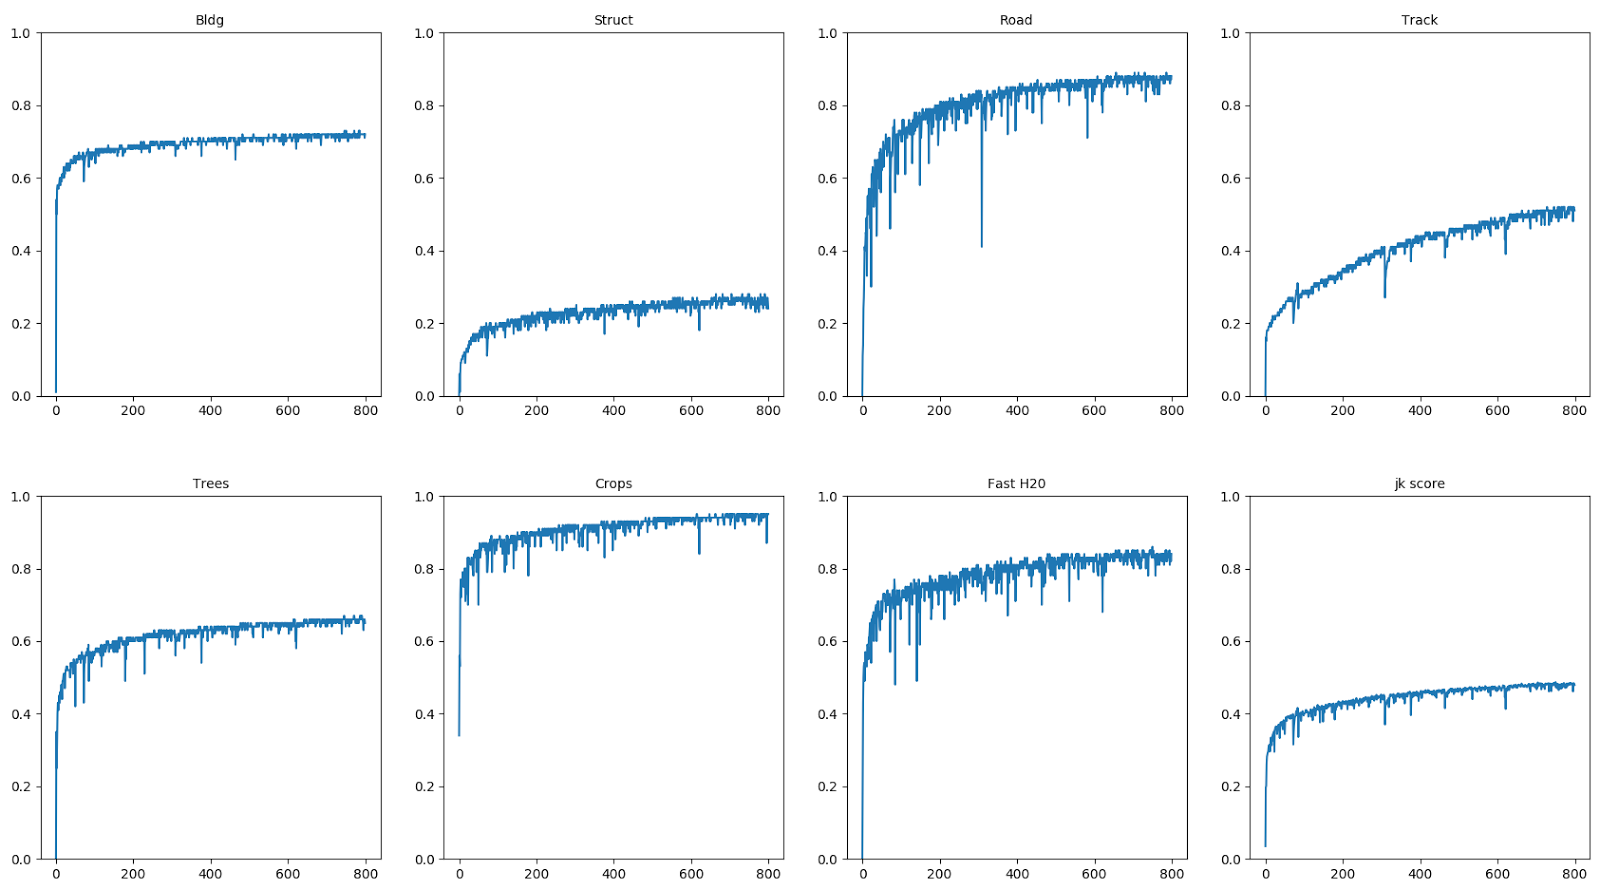
The diagrams are jacquard for the first 7 classes and on the bottom right is the average metric for all classes. It can be seen that different classes are trained for a different number of iterations, even with the alignment of samples, since all the same the areas of some classes are larger than others. Dips and waits are also visible. I was interested to know what happens to the predictions, and for each era I visualized them for validation. From these predictions Roman Soloviev made a wonderful video:
The video shows how the predictions of each class vary from era to era. The colors are marked: blue - class mask (False Negative), green - incorrect predictions (False Positive), blue - correct predictions (intersection of the mask and predictions) (True Positive). I personally like the moments when the network first predicts something irrelevant, and then clarifies its predictions, such as, for example, with fast water and highway classes. Also, in all classes, there is a wobble in the predictions. You can also notice the artifacts associated with the fact that the entire mask is predicted by a sliding window. Well, the main conclusion that I made for myself - a visual analysis of the results solves.
So I did such a thing.
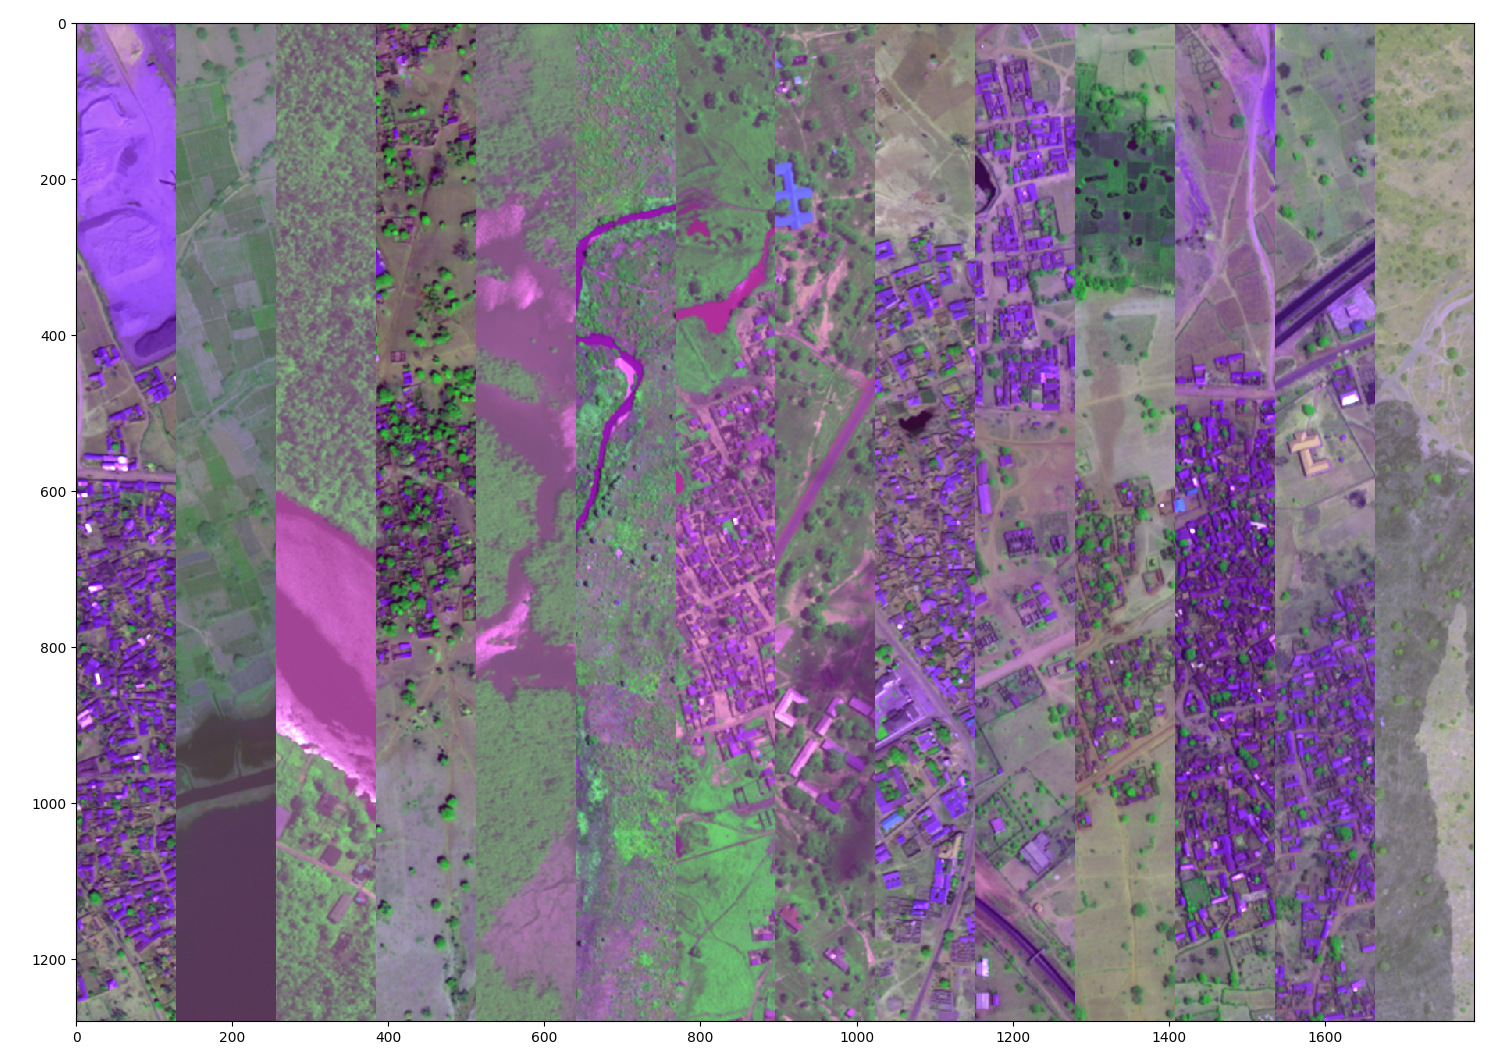
This is a mosaic of stripes of images from dough, which seemed to me difficult for one reason or another. I spent the whole evening to pautatirovat pictures of the test and prediction, so these colors. For example, the leftmost part contains houses and quarries, which often gave false positives to houses and water. Then comes a piece of the sea with water of such a hue that was not in the training set. Next comes a piece of a large river with ripples on the water, respectively, such large rivers and ripples were not there either. I also chose difficult sections of the highway that were poorly defined.
And then, at each epoch, besides the train pool (for complex examples) and validation, I also predicted this piece of test. Then I selected the best epochs visually and then checked them on the leaderboard and if they gave a profit, then I averaged their predictions in order to stabilize the solution. The averaging trick also gave an increase, but I did not manage to check many epochs in this way.
The final pipeline before merging with Roman looks like this:
But then Roman wrote to me and offered to unite. It seemed to me that it was extremely reasonable, because we both used Keras with Theano as a backend and direct combining our results with the best classes gave top2 results even without averaging or combining the predictions for individual classes. About my decision, I hope, Roman will write a separate post.
Afterword
About the data. What was my surprise and surprise of all the participants of ODS Slack, when, after the end of the competition, the orgs were informed that in fact they had only marked 32 snapshots from the test. The rest were just fake. Well, respectively, public is 6 shots, and private 26. It is precisely because of this that we can assume that the competition had to some extent the nature of a lottery. Well, it also explains the frequent discrepancies between local validation and public, because they were often comparable in size.
About the organizers. According to the description, the contest was supposed to end on March 7th at 3 nights in Moscow. I personally waited for this moment much more than any new year. And you can imagine the level of burnout of ODS Slack participants when the results were not published, and a message appeared on the forum that we are all great and the results will be in a week. Like, due to the fact that customers are preparing a press release. A week later, a press release appeared in which it was reported that the data was already being analyzed (yeah, of course, because no one had sent the decision yet). And Dstl also liked the format of the competition so much that they decided to file their Kaggl with drones and topic modeling. Two contests have already been launched on this site, but do not rush to rub the radiators of video cards and import xgboost'y. Only citizens of countries with a corruption index higher than 37 (Transparency International's Corruption Perceptions Index 2014) can apply for prizes in this contest. Accordingly, the citizens of Zambia and Burkina Faso can participate, but the Russians can not. Any competition has its zest, and it seems that Dstl found it - it burns.
About the overall experience of participation. Despite the fact that I killed a lot of time for this contest, I definitely liked it and I got a lot of profit even without a prize. This experience of working with image segmentation, a bunch of tricks for learning neural networks, do not forget about new acquaintances with people who are also interested in participating in competitions. Avito will soon hold its competition, which will be dedicated to recommender systems . I urge everyone to take part in it!
Record from training:
Presentation of the report here .
UPD:
In anticipation of the post from Roman, I decided to make a picture with our common pipeline:

UPD2:
Post Vladimir about the same competition
Source: https://habr.com/ru/post/325632/
All Articles