Zabbix for DevOps: how we implemented the monitoring system in the development and testing processes

We continue the cycle of publications on the implementation of DevOps tools and practices in our company. Recently, we talked about how we analyze vulnerabilities using neural networks and fuzzy logic , and today we will talk about the implementation of the Zabbix monitoring system in the development and testing processes.
Typical testing problems
One of the serious problems that we wanted to solve with the help of the implementation of DevOps practices was the organization of monitoring of IT systems. Prior to that, it was not actively implemented. This led to a number of difficulties. For example, we could lately notice that the place on the disk of the necessary machine ran out, problems were signaled by interruptions in the work of services and applications. All these are acute problems for the development and testing process, since due to such errors the product may be unstable, and it becomes more difficult to catch bugs in it.
')
When testing a product, it is necessary to analyze a variety of indicators: logs, server load, availability of internal and external services, etc. In addition, from version to version, the list of observed parameters may vary.
To solve all these problems, we decided to integrate the Zabbix monitoring system into the development and testing processes. That's how we did it, and what happened in the end.
How we implemented Zabbix
In general, monitoring systems are divided by function and type. The division by function can be described as:
- Situation monitoring - notification of critical events and errors (the classic situation is “SMS at 2 nights”).
- Trend monitoring - information is collected for further analysis.
- Performance monitoring - tracking system performance.
Monitoring by type is divided into:
- System monitoring - analyzes the state of the OS and system services.
- Application Monitoring - implemented within the application.
- Business metrics - implemented within the application.
The mechanism we use allows us to “close” all these functions and carry out system monitoring in full, and application monitoring in part.
To optimize the testing process, we decided to delimit the areas of responsibility between the DevOps team, developers and testers, wrote our own tools for interacting with Zabbix (zabbixtools) and switched to using the “monitoring as code” approach.
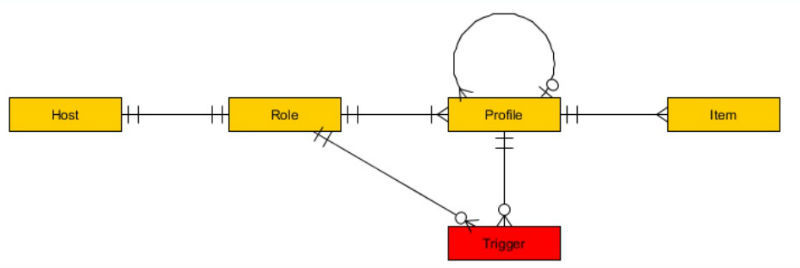
The division of responsibility looks like this - if we have a host that needs to be monitored, then the tester assigns him a certain role. Each host can have only one role in which there can be several profiles - they are provided by the DevOps team. Profiles can be different - for monitoring processes, services, API, etc.
The zabbixtools package includes Python and Powershell scripts ( project repository on GitHub ), which extend the functionality of the Zabbix system in the following parts:
- custom checks on Zabbix agents and external checks on the server;
- customization of alerts - integration with various services and workflow;
- work through the API - for example, mass editing of hosts and other entities;
- Configuring monitoring when deploying a product or tests.
The monitoring system should be flexible and easily configurable, which cannot be said about the Zabbix web interface. Therefore, to simplify the configuration, it was decided to implement a system in which Zabbix had to take as much data as possible about the observed indicators from the target server. To simplify setup, zabbixtools uses Low Level Discovery (LLD) functionality.
This allows you to make any monitoring settings on the monitored server itself, and not in the Zabbix admin panel.
The approximate scheme of the implementation of this function is presented in the diagram:
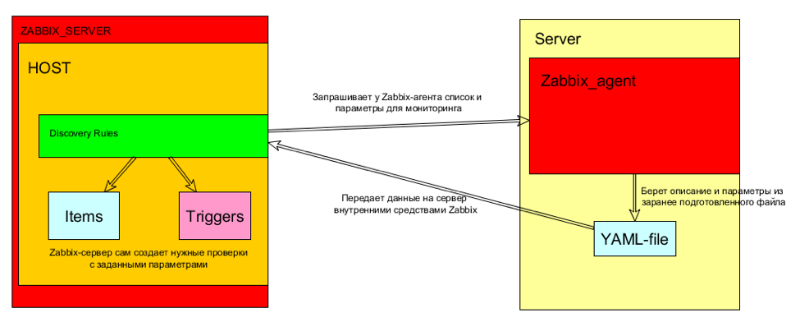
Here's how it works:
- LLD requests a monitoring configuration from Zabbix agent (with the required parameters). For example, lists of services, available sites or disks with the required amount of space.
- The Zabbix agent provides the parameters, in fact, it takes them from a yaml-format file.
- LLD creates the required Item and Trigger on the host. Moreover, the trigger trigger conditions can also be set on the agent side.
Thus, to set up a new host with certain rules, the teams do not need to learn the administrative interface; it is enough just to add the necessary set of profiles to the role that will be associated with this server. The web interface will only be used to view current status / historical information.
An example of embedding a monitoring system in the development / testing processes
The problem of monitoring during the development and testing of a product is a list of observed parameters that varies from version to version.
For example, it is possible that for two releases we need to monitor the following indicators:
1. Release N.0- We monitor the availability of resource A via HTTP
- Monitor Service B
- Monitor Service C
- For resource X set the critical value of Y
2. Release N+1.0- We monitor the availability of resource A via HTTPS
- Monitor Service C (but its name has changed)
- Monitor service D
- For resource X, set the critical value Z
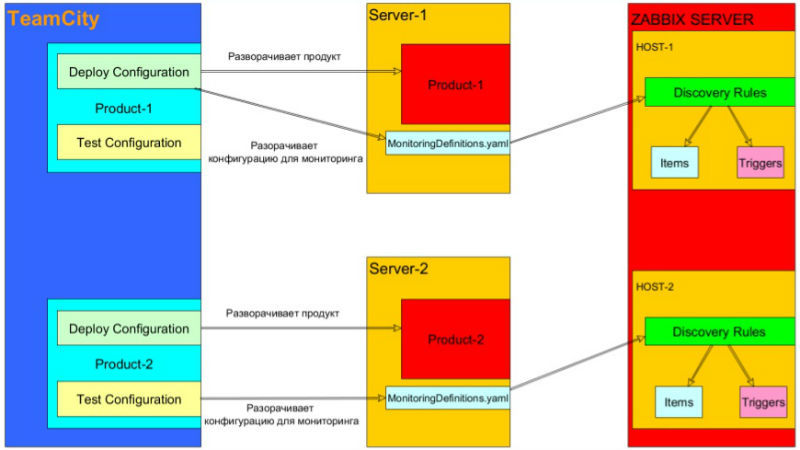
And today, at the SERVER-1 stand, one version of the product will be deployed, and tomorrow - the other should be deployed. In monitoring systems, any changes are made manually in the web interface with static preset parameters.
zabbixtools with LLD allows you to solve this problem in two possible ways:
1. The monitoring configuration (yaml files) is deployed when the product is deployed (files are taken from the same repository as the source code of the product).
- Maintaining the relevance of monitoring configuration remains a task for developers.
- The monitoring configuration varies from branch to branch / from feature to feature.
- SMOKE testing is already underway when a product is deployed, even if there is no need to run tests.
2. The monitoring configuration (yaml files) is deployed when testing the product (files are taken from the same repository as the code for the test).
- Maintaining the relevance of monitoring configuration is the task of testers.
- SMOKE tests can be performed by the monitoring system.
This scheme allows you to customize monitoring depending on the product release and keep it under version control. We can also implement SMOKE testing using the monitoring system itself. In addition, this configuration allows for the division of responsibilities between the DevOps, development and testing teams - in particular, programmers and testers do not need to deal with the work of Zabbix and its API.
As a result, the participation of different teams is required only at certain intervals. For example, when deploying a product, developers are responsible for maintaining the relevance of the monitoring configuration, the monitoring configuration is different from branch to branch and from feature to feature, and SMOKE testing is performed during deployment even without running tests.
When testing a product, testers are responsible for maintaining the relevance of the monitoring configuration, SMOKE tests can be performed by the monitoring system.
Work examples
Below are sample configurations for monitoring sites, services, processes and folder sizes.
Consider a situation in which we need to monitor the availability of internal and external sites - from them we should receive an HTTP 200 OK response. To do this, simply add the lines to the
websites.yaml file. If it is required to monitor the work of services (services should be included), they should be added to services.yaml .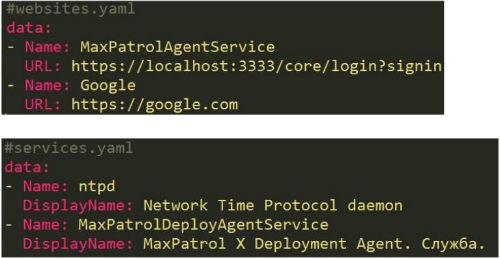
In case you need to monitor the memory consumption of certain processes, you can do this with a few lines in process.yaml.
Another useful feature of this tool is the ability to set different threshold values for metrics. If, for example, it is important for us that the size of the Cache folder is small, and the logs can grow in size, then you can simply add different
CriticalSize folders in foldersize.yaml .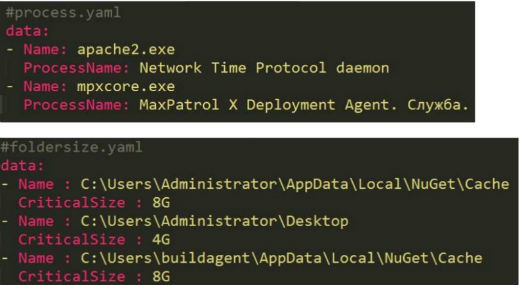
PS The story about our experience of integrating monitoring with the help of Zabbix into the development and testing processes was presented as part of the DevOps mitap, which took place in the fall of 2016 in Moscow.
Video:
Slides
The link presents presentations of 16 reports presented during the event. All presentations and video presentations are added to the table at the end of this topic .
Author : Alexey Burov
Source: https://habr.com/ru/post/325276/
All Articles