Reincarnation of the PIX graphics debugger for DirectX 12
 I love graphical debuggers. I also like ordinary ones, but graphic ones - more. They give the feeling of looking backstage at a theater during a performance: “Yeah, this decoration is fixed like this, and this ray of light falls from here, and this cabinet has no back wall ...”. The graphical debugger forwards the bridge of understanding between the text code of the application and the resulting beautiful picture.
But the industry does not indulge us with an abundance of similar tools. There are graphical debuggers from Intel, NVidia and AMD, but they do not work on competing chips and are intended not so much for development / debugging as for benchmarks and bragging with their video cards. They tell not bad WHAT and WHEN it happened, but they explain poorly WHY and HOW TO FIX.
In another camp is my favorite RenderDoc, about which I have already written . A wonderful utility written by the guys from Crytek for themselves and people. Open source, support for all vendors, DirectX11 (with plans for Vulcan and DirectX12), a bunch of small useful things.
')
The second representative was once PIX - a utility for analyzing the performance of DirectX9. It was conceived as a development tool for XBox (the name itself is an abbreviation of Performance Investigation for XBox), but it worked well for desktop applications. Until then, until she died (with the release of DirectX 10/11 and new versions of Windows). Microsoft, which once again marketers defeated engineers, announced the only visual graphics debugging tool for Visual Studio, in which it was for these purposes that there was a lot of excess, there was not enough, and something was completely impossible. A studio is a great tool for programming, but far from being such a good thing to study, profile and debug graphic code (especially someone else's).
All of this discouragement lasted for several years, until Microsoft engineers won a temporary victory, and in January 2017, Microsoft announced the launch of a beta of a fully updated version of PIX for DirectX 12!
Let's see what we got.
Setting up the environment
You will need Windows 10 (to use DirectX 12). The PIX itself can be downloaded from here . Well, you also need an application that draws something using DirectX 12. For example, you can take, for example, the official examples from Microsoft, here they are on GitHub . To build them, you will need Visual Studio (2015 or newer, the free community is fine) and the Windows 10 SDK .
Download and install all of the above, collect examples, run the PIX.
Beginning of work
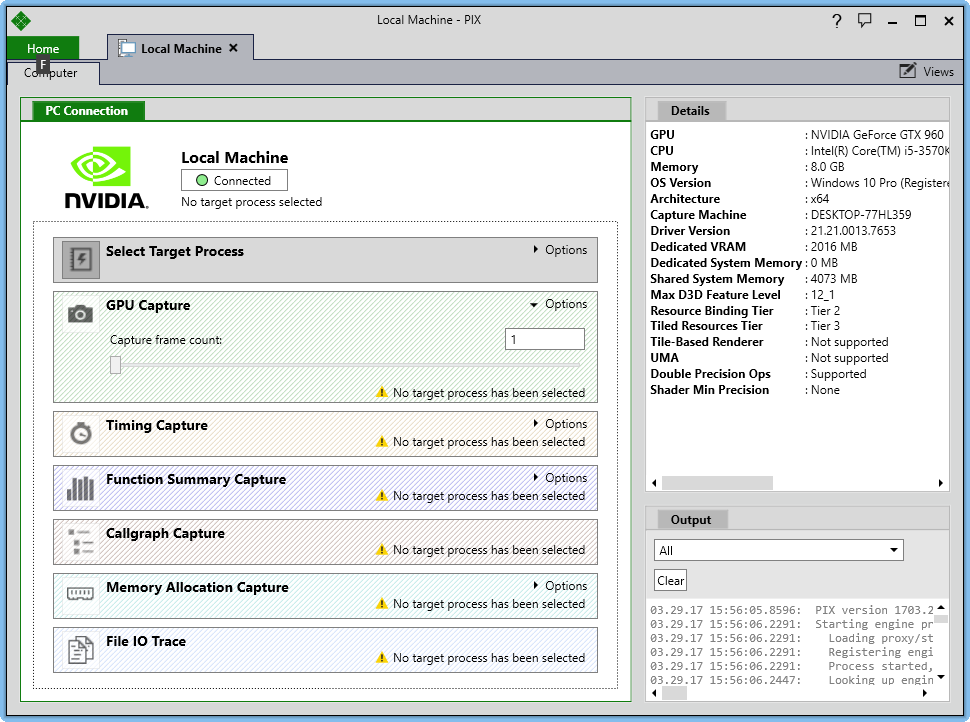
The PIX start window looks good. There is something from the latest versions of Office, something from Visual Studio and very little from the fashionable Microsoft-style UWP applications now. Immediately, we are offered to take one of six actions to choose from: GPU Capture and Timing Capture relate to the graphics adapter, the remaining points - to the usual profiling, which is of little interest to us in the context of this article.
The need for two GPU Capture and Timing Capture points, as explained by one of the PIX developers in the presentation, is dictated by the fact that there is no way to know the detailed state of the graphics pipeline at the same time and to keep the timings unchanged, because access to one thing changes the second The Heisenberg equation was given as an illustration :)). Therefore, in each case, you will have to choose whether we now want to debug performance or drawing accuracy.
For performance measurements, we have vendor utilities, so let's focus on GPU Capture. We are offered to either launch one of the UWP applications installed on this computer, or specify the path to the normal binary. There is also an Attach tab, but it is not to our liking - it works only for regular profiling, but graphical debugging will turn on only for the application launched from under the PIX. This, by the way, creates a problem with the launchers (which, for example, has been solved in Renderdoc). Well, maybe someday they will be fixed here.
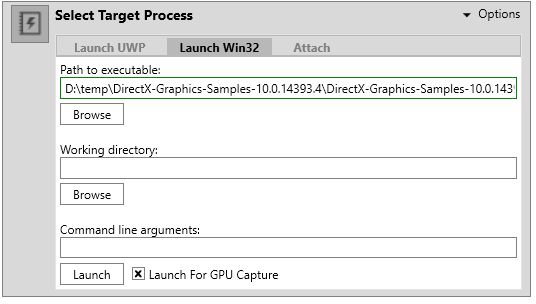
I took this example for experimentation - it is as simple as a door, and at the same time allows me to demonstrate everything I need, because it makes quite a few draw calls.
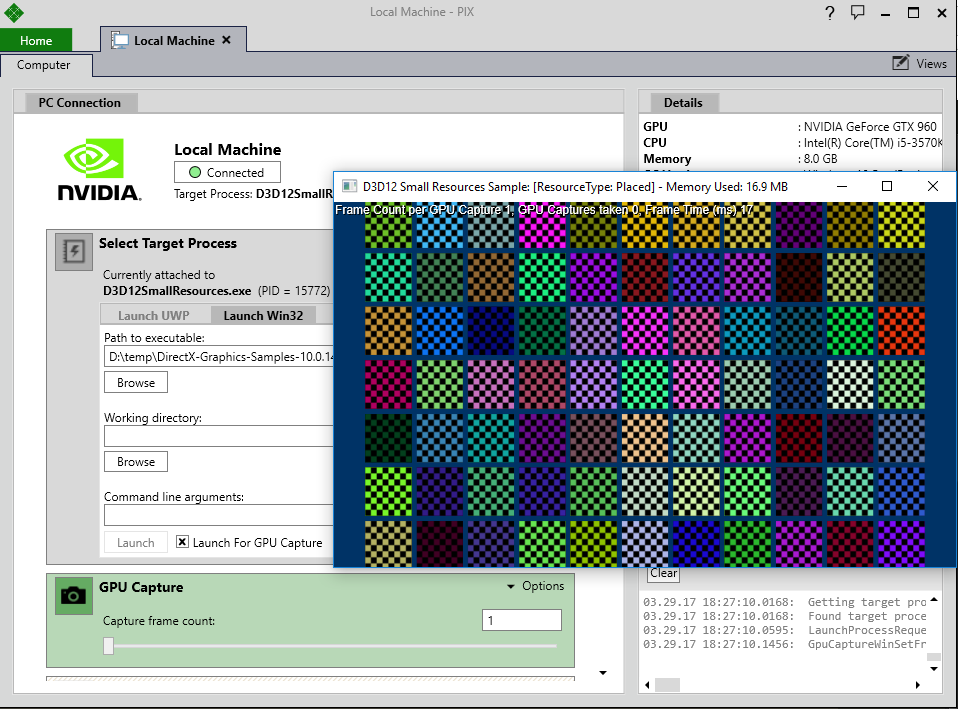
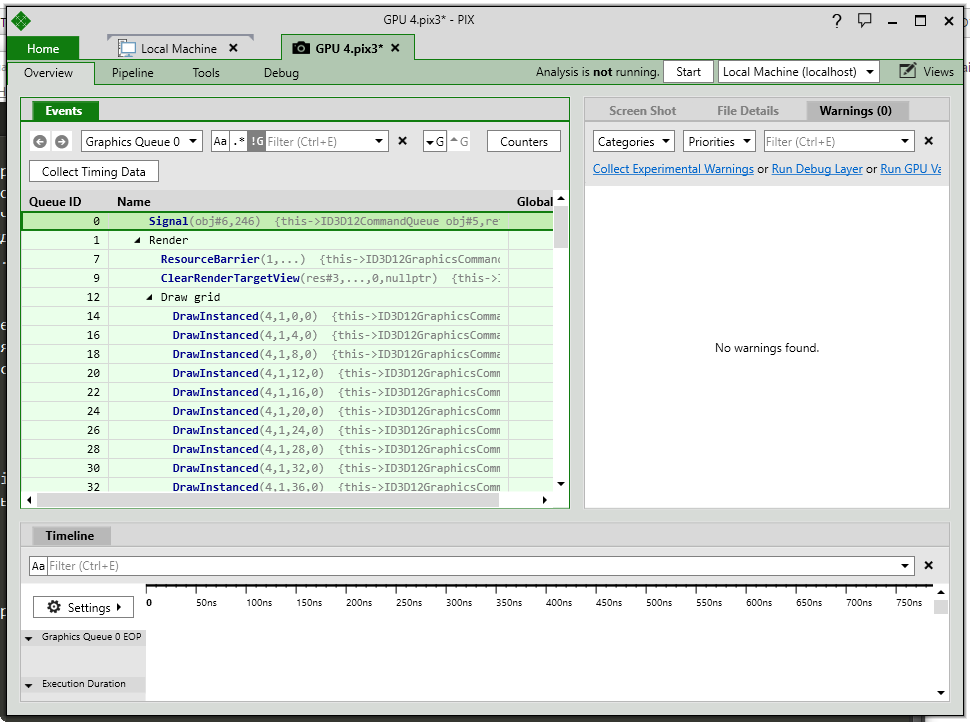
You can judge that the PIX was successfully embedded in the application by the caption at the top of the frame. Now you need to take a “snapshot” of one-frame rendering - using PrintScreen in a running application or using a button with a camera from the PIX. The captured image looks like this:
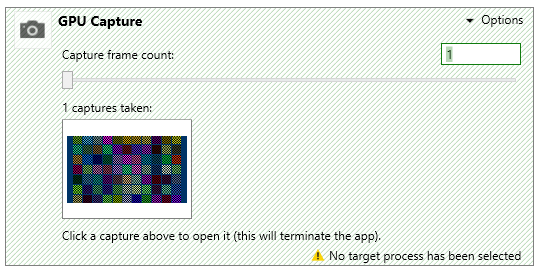
Open the picture. We see the order of frame drawing operations:
Below is the timeline, but there is nothing on it. This is not a bug, but a feature. In order for something to appear there, you need to start the "playback" of the snapshot (the "Start" button at the top right). Then the PIX will reclaim all the resources needed for the drawing and will call all methods (in the same order, with the same parameters). And here is our timeline.
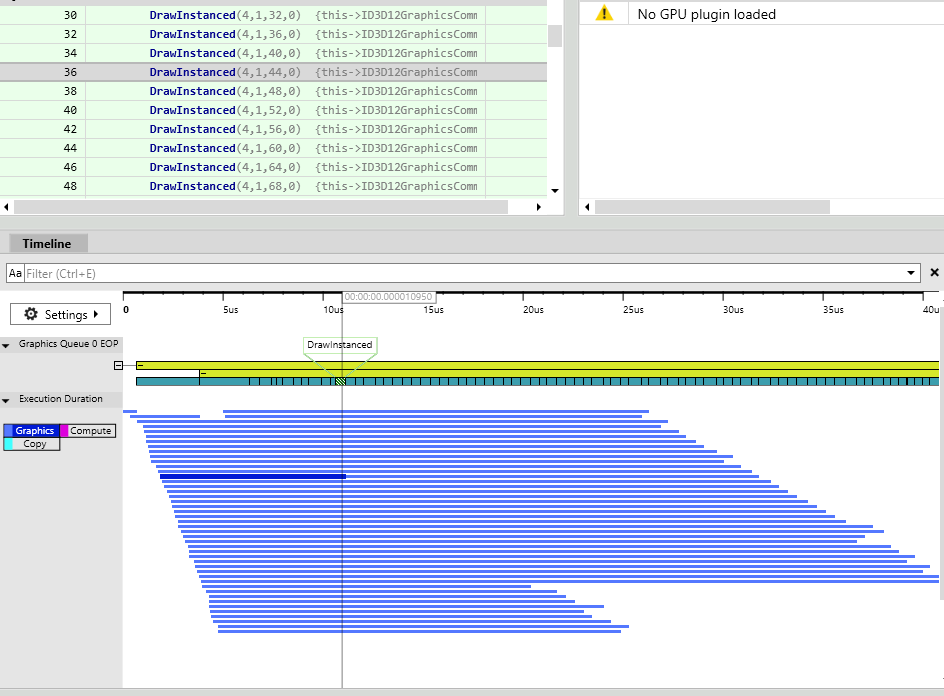
Here you can evaluate the performance, parallelism and, in general, the overall picture. By selecting a specific draw call, you can go to the next Pipeline tab and see what was drawn there.
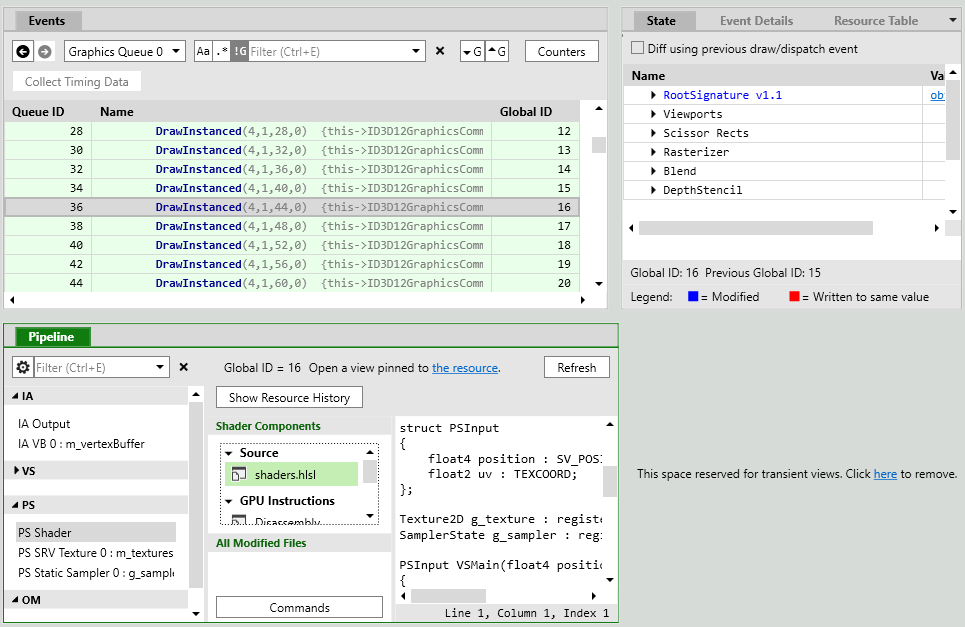
We can view the status of input buffers, attached textures and shaders, the result of drawing after the execution of this call:
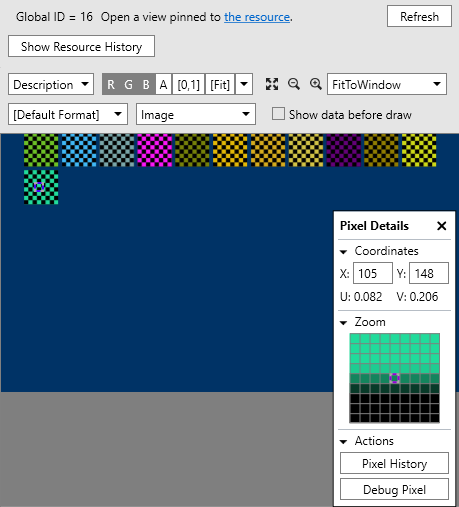
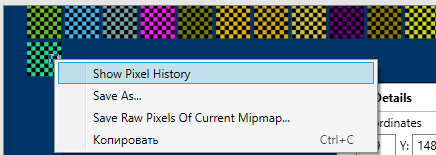
Clicking the right mouse button somewhere on the picture you can see the history of drawing this pixel:
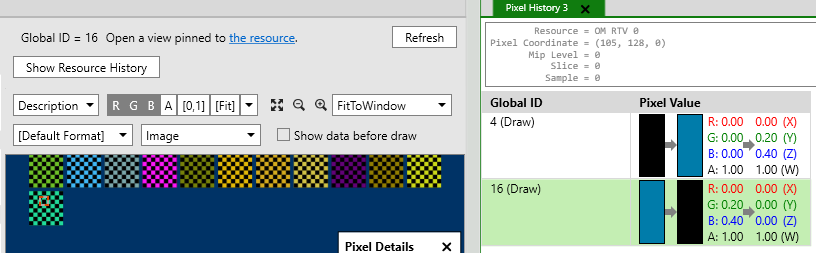
We see that this particular pixel was touched twice when drawing the current frame — when cleaning the canvas and when drawing the checkered texture later.
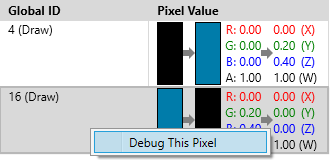
From the context menu of any step in the history of drawing, you can start debugging the shader that drew this pixel:
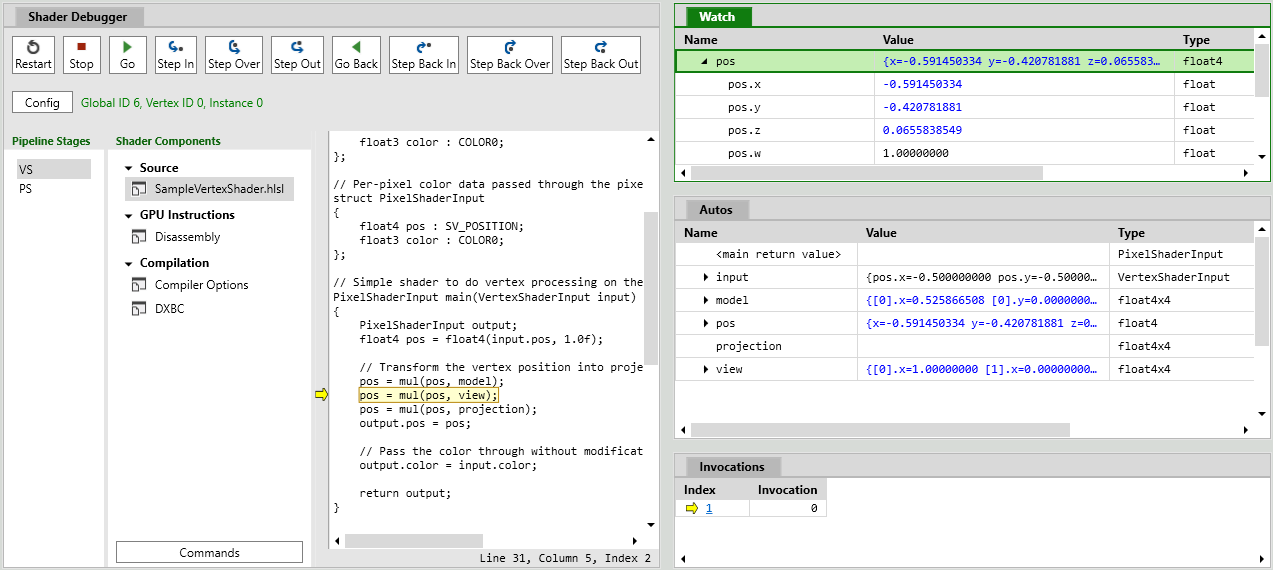
The debugger is good - you can go in steps, use breakpoints, go back, you can see all the necessary values in the Autos window. There is even an Edit & Continue for shader code.
In general, I liked the new PIX. There are minor roughnesses (lack of support for launchers, work with only one GPU), but this is all fixable. Of the global flaws, I would only note the lack of support for DirectX 11 - this is still a very common standard and the lack of support in both the old and the new versions of the PIX is quite frustrating.
New PIX materials for further study
Source: https://habr.com/ru/post/325202/
All Articles