Everything you wanted to know about stack traces and hip dumps. Part 2
Everything you wanted to know about stack traces and hip dumps. Part 1
Here is the second part of the decryption of the report by Andrey Pangin aka apangin from Odnoklassniki from one of the JUGs (a doped and extended version of his report from JPoint 2016). This time we’ll finish the talk about stack-traces, and also talk about thread dumps and hip dumps.
So, we continue ...

')
Since we are talking about recursion, what will happen if I launch such a recursive method that never returns anywhere:
static int depth; static void recursion() { depth++; recursion(); } public static void main(String[] args) { recursion(); } How many calls pass before StackOverflowError appears (with standard stack size)?
Let's measure:
package demo4; public class Recursion { static int depth; static void recursion() { depth++; recursion(); } public static void main(String[] args) { try { recursion(); } catch (StackOverflowError e) { System.out.println(depth); } } } Same code, just added catch StackOverflowError.
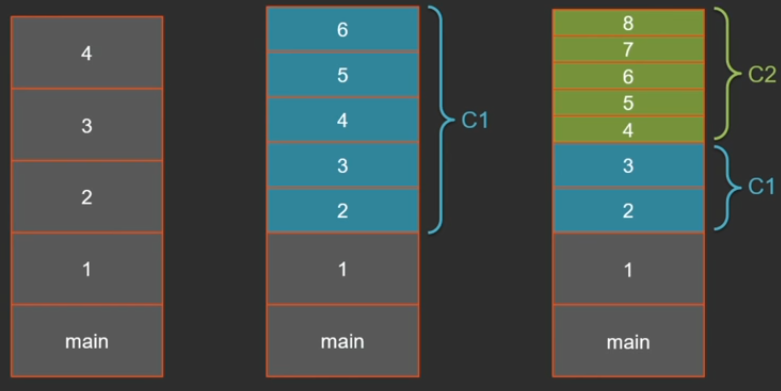
On a 64-bit system with a 1 MB stack size, the result varies from 22 to 35 thousand calls. Why such a big difference? The point is JIT: methods are compiled in the compiler's background thread in parallel with the execution of java-code. At some point (after the recursion method has already been called several times) the compilation of this method is started, and at that time execution continues in the interpreter. As soon as the compiler finishes its work, the next call will go to the compiled code.
Starting from Java 8, we have 2 compilers in one VM by default - “light” C1 and “heavy” C2, i.e. it is possible that we will have three types of frames on the stack: interpreted, compiled C1 and compiled C2. Frame size can vary greatly. The interpreter has the most cumbersome frames, because everything is stored on the stack (all arguments, local variables, current bytecode pointer, etc.). In the compiled code, much of this is not needed, and the more optimal the compiler is, the less it should be stored on the stack. C2, for example, generally will not make room on the stack for local variables - everything pushes through the registers, but also zainlineit one level.
If the same code is executed in a purely interpreted mode with a key
-Xint
The result is almost always 12,500 (± several frames).
Now the same thing, but after the C1 compiler.
-Xcomp -XX:TieredStopAtLevel=1
In the case of the C1 compiler, the results are also quite stable - about 25 thousand.
If you compile everything in C2 right away:
-Xcomp -XX:-TieredCompilation
All this will work longer, but the result is 62 thousand frames.
If you divide the standard stack size (1 MB) by 62 thousand, it turns out that about 16 bytes go to 1 frame. I checked by compiled code - it is. The frame size is actually not 16 bytes, but 32, but in 1 frame there are 2 levels of nesting at once.

By default, on a 64-bit architecture, the stack size is 1 MB, but it can be adjusted. These 2 keys are synonymous.
-Xss, -XX:ThreadStackSize
A less well-known fact is that you can change the stack size of one particular thread:
Thread(ThreadGroup, target, name, stackSize)
But when creating large stacks, we must not forget that they take up space in the memory, and it may happen that many threads with a large stack size will result in out of memory:
java.lang.OutOfMemoryError: Unable to create new native thread
Interesting fact: if you look at the jvm
-XX:+PrintFlagsFinal key -XX:+PrintFlagsFinal on Linux, it will really show that it has a ThreadStackSize of 1 MB, and if you look at Windows, the default value of the key of the ThreadStackSize is 0. Where does 1 MB come from?For myself, it was a revelation that the default stack size is set in the exe-shnik (the default size for the application is specified in the exe-format attributes).
The minimum stack size on a 64-bit system is approximately 228 KB (it may vary from version to version JDK). How does the stack work and where does this minimum size come from?

On the stack, besides the frames of your Java methods, there is still some reserved space. This is at least always 1 red zone (1 page size - 4 KB) at the very top of the stack and several pages of the yellow zone.
Red and yellow zones are needed to check the stack overflow. At the beginning, both zones are write protected. Each Java method, through an attempt to write to the address of the current point-stack, checks whether the red or yellow zone is reached (when attempting to write, the operating system generates an exception that the virtual machine intercepts and processes). When the yellow zone is reached, it is unlocked to allow enough space to start the stack overflow handler, and control is passed to a special method that creates a StackOverflowError instance and passes it on. When it enters the red zone, an unrecoverable error occurs and the virtual machine is fatally terminated.
There is also a so-called shadow zone. It has a rather strange size: on Windows - 6 pages, on Linux, Solaris and other OS - 20 pages. This space is reserved for native methods inside the JDK and the needs of the virtual machine itself.
When I was preparing the presentation, I ran my recursive testik both in Java 8 and in Java 9. At the last, I got such a wonderful virtual machine crash (output fragment):
#
# A fatal error has been detected by the Java Runtime Environment:
#
# EXCEPTION_STACK_OVERFLOW (0xc00000fd) at pc=0x0000019507acb5e0, pid=9048, tid=10544
#
# JRE version: Java(TM) SE Runtime Environment (9.0+119) (build 9-ea+119)
# Java VM: Java HotSpot(TM) 64-Bit Server VM (9-ea+119, mixed mode, tiered, compressed oops, g1 gc, windows-amd64)
# Problematic frame:
# J 155 C2 demo4.Recursion.recursion()V (12 bytes) @ 0x0000019507acb5e0 [0x0000019507acb5e0+0x0000000000000000]
#
# No core dump will be written. Minidumps are not enabled by default on client versions of Windows
#
# If you would like to submit a bug report, please visit:
# http://bugreport.java.com/bugreport/crash.jsp
#
...
Naturally, I downloaded the latest available build (at the time of the report it was 9.0 + 119), this problem is also reproduced on it.
This is a very good case for crash dump analysis (Andrey Pangin - JVM crash dump analysis ). Here all the skills were useful, in particular, disassembly.
Here is a statement that writes the value relative to the current point stack. Crash occurred just on this instruction:
Instructions:
00000000: 89 84 24 00 a0 ff ff mov DWORD PTR [rsp-0x6000],eax
00000007: 55 push rbp
00000008: 48 83 ec 10 sub rsp,0x10
0000000c: 49 ba 78 71 88 8d 00 00 00 00 movabs r10,0x8d887178
00000016: 41 83 42 70 02 add DWORD PTR [r10+0x70],0x2
0000001b: e8 e0 ff ff ff call 0x00000000

Registers:
RSP=0x0000007632e00ff8

Java Threads:
=>0x0000019571d71800 JavaThread "main" [_thread_in_Java, id=10544,

stack(0x0000007632e00000,0x0000007632f00000)]
0x0000007632e00ff8
Using the value of the RSP register, you can calculate the address to which we write. It is necessary to subtract 6000 in HEX from this address, you get some such value:

We write by this value. In the same place in the crash dump, the stack ranges of the current thread are specified:

We see that this value falls at the end of the very first (highest) page of this stack, i.e. just in the red zone.
Indeed, there is such a bug. I analyzed it and found the reason: for some JVM functions, there are not enough 6 shadow pages available on Windows (they take up more when executed). The developers of the virtual machine have been cheated.
By the way, the size of these zones can be changed with JVM keys.
Why do we need big stacks at all? For Java EE, not otherwise.
Here is one of my favorite pictures on this topic.

On 2 lines of business logic hundreds of frames from various frameworks and application-servers are generated.
Stack traces for measuring performance
Profiling is an integral part of measuring the performance of your system. All profilators can be divided into 2 large groups: sampling and instrumentation.
The instrumentation profiler simply marks the methods: it adds some kind of signaling about entering the method to the beginning, and finally - signaling about leaving it. It is clear that if we instruct each method in such a way, all this will create a large overhead, although the measurement will be fairly accurate.
public void someMethod(String... args) { Profiler.onMethodEnter("myClass.someMethod"); // method body Profiler.onMethodExit("myClass.someMethod"); } In production, a different approach is most often used - sampling profiler. He periodically (10-100 times per second) removes a dump of streams and looks at which threads with which traces are currently running. The methods that most often fall into these stack traces are hot.
Let's take a look at an example of how this works. I wrote a small program. Despite the fact that it is small, you can’t tell it at once that it can slow down.
First, it generates 2 random geographic coordinates. Then, in a cycle, it calculates the distance from a randomly generated coordinate to another given point (Moscow) - i.e. There is a distanceTo function in which there is a lot of math.
The results are added to the hash map.
All this in a cycle runs many, many times:
package demo5; import java.util.IdentityHashMap; import java.util.Map; import java.util.concurrent.ThreadLocalRandom; public class Location { static final double R = 6371009; double lat; double lng; public Location(double lat, double lng) { this.lat = lat; this.lng = lng; } public static Location random() { double lat = ThreadLocalRandom.current().nextDouble() * 30 + 40; double lng = ThreadLocalRandom.current().nextDouble() * 100 + 35; return new Location(lat, lng); } private static double toRadians(double x) { return x * Math.PI / 180; } public double distanceTo(Location other) { double dlat = toRadians(other.lat - this.lat); double dlng = toRadians(other.lng - this.lng); double mlat = toRadians((this.lat + other.lat) / 2); return R * Math.sqrt(Math.pow(dlat, 2) + Math.pow(Math.cos(mlat) * dlng, 2)); } private static Map<Location, Double> calcDistances(Location target) { Map<Location, Double> distances = new IdentityHashMap<>(); for (int i = 0; i < 100; i++) { Location location = Location.random(); distances.put(location, location.distanceTo(target)); } return distances; } public static void main(String[] args) throws Exception { Location moscow = new Location(55.755773, 37.617761); for (int i = 0; i < 10000000; i++) { calcDistances(moscow); } } } Here everything can slow down: the generation of a random coordinate, and the measurement of distance (there is a lot of math here), and unfolding on a map. Let's run the profiler and see what exactly the time is spent on.
I'll take Java VisualVM (included in the standard JDK package - there is nothing easier), I find our process on the Sampler tab, click the CPU - we start the measurements (let's give half a minute to work). The default measurement interval is once every 100 ms.
What happened:
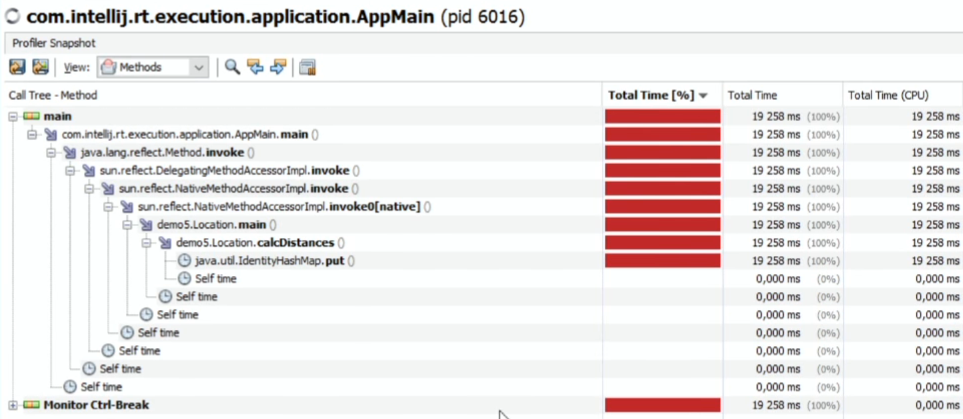
Slightly less than completely (according to the VisualVM Java Profiler) we spend time on IdentiryHashMap.put.
If you look at the flat table by methods, sorted by SelfTime:
As if nothing else is being done.
The same can be measured with other profilers (JProfiler, YourKit, etc.), I assure you, the result will be the same.
Is HashMap so brake? Not. Just profilers are lying.
They are arranged in the same way: with a given periodicity, they call the JMX or JVMTI method, which receives a dump of all the threads. For example, in JVMTI there is a method GetAllStackTraces . What the virtual machine says, they summarize and print here.
Hand on heart, these are not profilers lying, but JVM - it gives the wrong stack-traces. All profilers have one big problem: thread stack traces can only be removed at safepoint moments, and these are certain points in the code that the virtual machine knows that the thread can be safely stopped. And there are actually a few such points: they are inside the cycles and at the exit points of the methods. If you have a large canvas of code - the same mathematics; without cycles - there may not be a safepoint at all, which means that this canvas will never get into stack-traces.
Another problem is that the threads that are sleeping, and the threads that are working, are sampled the same way, because we take a dump from all threads. This is not very good, because sleeping streams are not interesting for us to see in stack traces.
Also, most profilers cannot distinguish native methods that sleep on some kind of blocking system call. For example, when waiting for data from a socket, the thread will be in the RUNNABLE state and the profiler will indicate that the stream is eating 100% CPU. And he does not eat CPU, just the virtual machine can not distinguish the working native method from the blocking system call.
What to do?
The OS provides features for profiling native code. If we talk about Linux, there is a setittimer system call, which sets a timer and generates a special OS signal (SIGPROF) for profiling with a given periodicity. Receive it will be the thread that is currently being executed. It would be good for us to be able to use the capabilities of the OS and in the SIGPROF signal processor to collect stack traces of the current thread, even if it is not in a safepoint. And in the HotSpot virtual machine such an opportunity is provided. There is an undocumented private API: AsyncGetCallTrace, which can be called to get the current stack of threads not in safepoint.
This hole was propylene specifically for Oracle Developer Studio. This is almost the only proflator who receives an honest stack trace.
While I was preparing this report, I looked, and is there anyone else who uses these methods. I found literally 2 projects: one is old and already abandoned, and the other appeared relatively recently (in 2015) and is called honest-profiler.
The API here is pretty simple: prepare the place where we will stack the stack, and call the method:
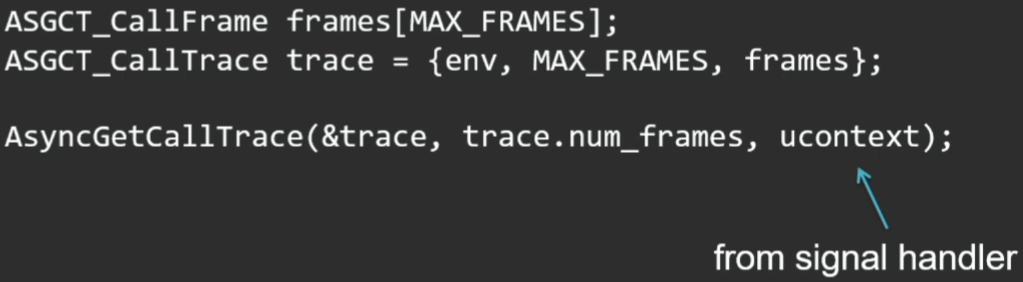
The third parameter of this method is the current context, which comes to us in the signal handler.
Link to my own open source profiler: https://github.com/apangin/async-profiler . Take - use. Now he is already in a state where he is not ashamed to show people. True, it is now implemented only for Linux (Note: support for macOS has been added since the report).
Let's check on the same example.
We say which process we are profiling.
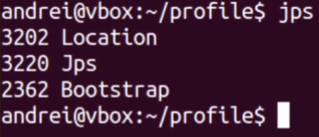
Our pid is 3202.
The peculiarity of my profiler (which I have never seen before) is that it can connect on the fly (the honest-profiler mentioned must be started as a Java agent when the application starts).
Let's give a few seconds to the profiling. This is what we get as a result:

At the end is a flat list of methods; a little higher - separate details (all stacks of threads). The picture is completely different. Almost a third of all time is spent on math - calculating the distance. IdentityHashMap.put - generally below with the result of 2% (according to the first profiler it occupied 100%). But it really takes time to calculate the identityHashCode of the object. And a lot of time is spent on put and resize itself. By the way, random location generation is also not free (at least 12%).
Feel the difference.
The overhead of this profiler is much less. It can be run at least 1000 times per second, and this will be normal, since it removes the stack-trace of only the active thread. And it puts the results into a very compact structure - it does not generate all these method names, classes. This is all calculated only when printing. And during the profiling, only jmethodIDs are added (in fact, method pointers).
Thread dumps
There are many ways to do stream dumps: from Java code or from native, from within the process itself or from the outside.
If we talk about the analysis of the process from the inside, that is, the Java API getAllStackTraces, which gives us the StackTraceElement array with all the consequences.
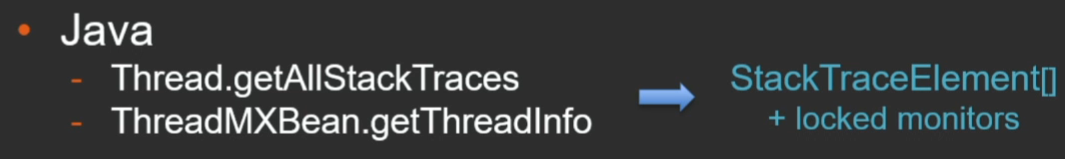
When we tried to use it in production, for a case with 2 thousand threads, each of which has a stack depth of 50-60 frames, this array alone occupied about 50 MB.
There is a similar method for JMX (it is useful because you can pull it remotely). It provides the same StackTraceElement array, as well as information about captured monitors.
If we talk about generating stack-traces from the application itself, the JVMTI (Tool Interface) method is much better - a native interface for developing tools, profilers, analyzers, etc.

There is a method GetAllStackTraces, which is usually used just profilers. Compared to the Java API, it has a very compact view.
When dumping outside, the easiest way is to send the SIGQUIT process (either kill -3 or the appropriate combination to the console):
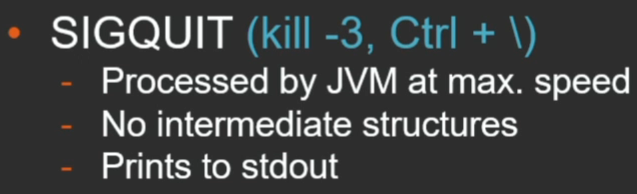
The advantage of the method is that the stack traces will be printed by the Java machine itself. This is done with maximum speed. It still happens during a safepoint, but we do not need to create any intermediate structures.
The alternative path is the jstack utility. It works through the dynamic attach mechanism (I’ll dwell on it).
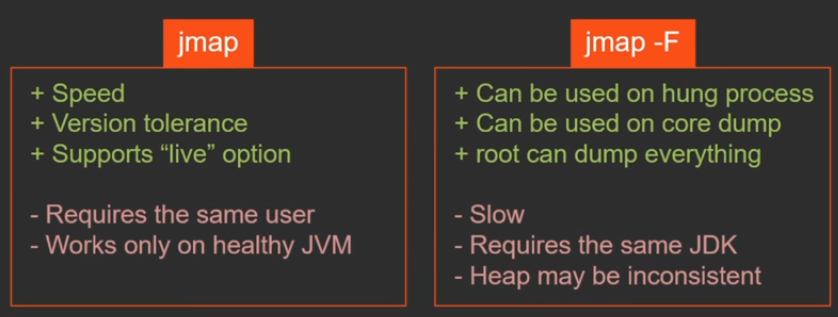
It is important to understand that the jstack and jmap utilities have 2 modes of operation. They differ in only one key -F, but in fact they are 2 different utilities that serve the same thing, but work in two completely different ways.
Let me explain what is the difference between them.
Dynamic attach is a utility communication mechanism with a JVM through a special interface. How does this happen (using Linux as an example)?
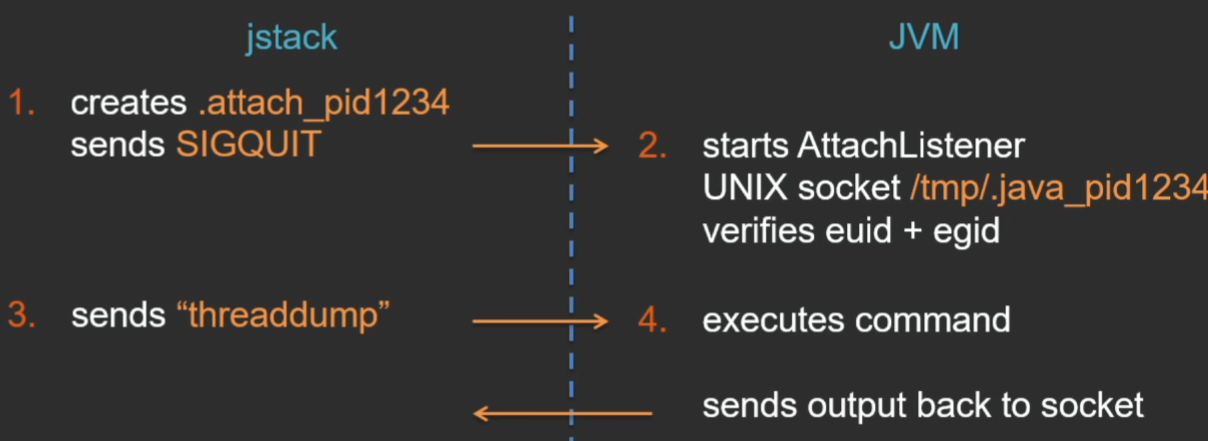
The jstack utility creates a certain file in the current directory - a signal that the utility wants to connect to the JVM, and sends a SIGQUIT signal to the virtual machine. The virtual machine processes this signal, sees the .attach_pid signal file in the current directory and, in response, starts a special stream, AttachListener (if it is already running, it does nothing). And in this thread, a UNIX domain socket is opened for communication between the jstack utility and the JVM. When the utility connects to this socket, the JVM checks the user's rights on that side so that foreign users cannot connect to the virtual machine and get some private information. But checking there is very simple - only the exact correspondence of the effective UID and GID is checked (as a result, there is such a popular problem that when running jstack from under another user, even root, you cannot get a dump exactly because of this check).
After the connection on the UNIX socket is established, the utility sends the command, and the virtual machine itself executes this command, and sends the response back to the utility on the same socket.
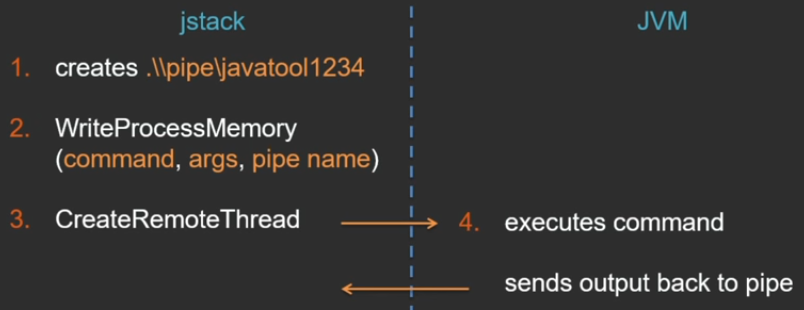
In Window, everything is somewhat different (I don’t know why it couldn’t have been done the same; in Windows there is no UNIX socket, but there are named pipes) - there is another nice API that I like, so I could not fail to mention it here.
The beginning is about the same - the named pipe is created. Further, the Windows API has a function WriteProcessMemory, which can write some data directly into the memory of another process, if it has rights to it. Through this function, a temporary auxiliary memory page is created in the address space of the java-process, the command to be executed is written there, the arguments and the name of the pipe where the response will go. Another not less wonderful function that allows you to embed a thread in an alien process is CreateRemoteThread. The jstack utility starts a remote thread — it is already running in the context of the virtual machine process. And as an argument to this thread, a pointer is passed to the previously created memory area, where all the information about the command is available.
Then everything is the same: the JVM itself executes the command and sends the result back.
Advantages of this approach:
- all operations are performed directly by the virtual machine in the most efficient way;
- Since the interface is independent of the VM version, you can take dumps from different processes with one jstack utility, regardless of which Java version these VMs are running.
The disadvantages include:
- the already mentioned restriction on user inconsistency;
- this can only be executed on a live virtual machine, since commands are executed by the virtual machine itself;
- This mechanism can be disabled (for example, for security reasons) with a special JVM option.
-XX:+DisableAttachMechanism.
As a “proof of concept”, I decided to write a simple C utility, which in this way connects to a remote Java process and executes the command passed there on the command line ( https://github.com/apangin/jattach ).
The virtual machine supports the following commands:
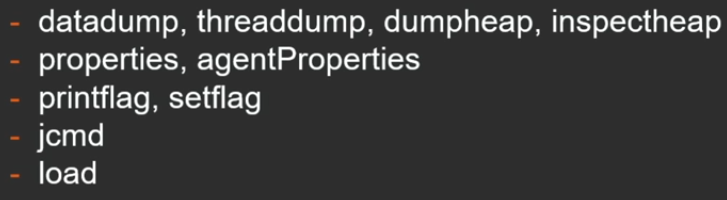
, , , , , jcmd, load — , , JVMTI- . load async ( JVM).
, . - , , tomcat.
pid — 8856.

. java-, , Java. — 100 Windows Linux. GitHub.
jstack, jmap, jinfo jcmd ( jattach ).
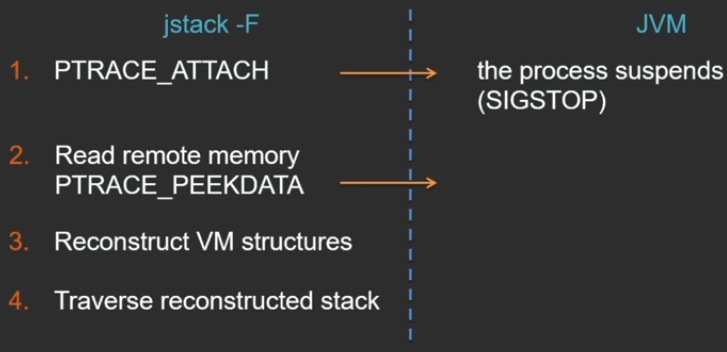
— jstack -F. , JVM — .
Linux PTRACE_ATTACH ( Windows ) , , . API, , jstack , , JVM . JVM , .
PTRACE_PEEKDATA 1 1 , , (, , ).
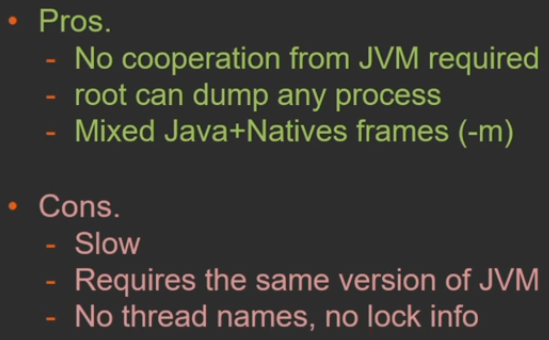
, :
- — jstack -F VM;
- root , .
:
- , ;
- jstack , , , jstack JVM, .
What is it for? , , - . (, thread pool), , , , .
Java API , . Dynamic Attach — Java API, jstack. pid , Dynamic Attach .
public static void dump() throws AttachNonSupportedException, IOException { String vmName = ManagementFactory.getRuntimeMXBean().getName(); String pid = vmName.substring(0, vmName.indexOf('@')); HotSpotVirtualMachine vm = (HotSpotvirtualMachine) VirtualMachine.attach(pid); try { vm.localDataDump(); } finally { vm.detach(); } } GitHub : https://github.com/odnoklassniki/one-nio/blob/master/src/one/nio/mgt/
-
jmap .
jmap -dump:live,format=b,file=heap.bin PID, , :
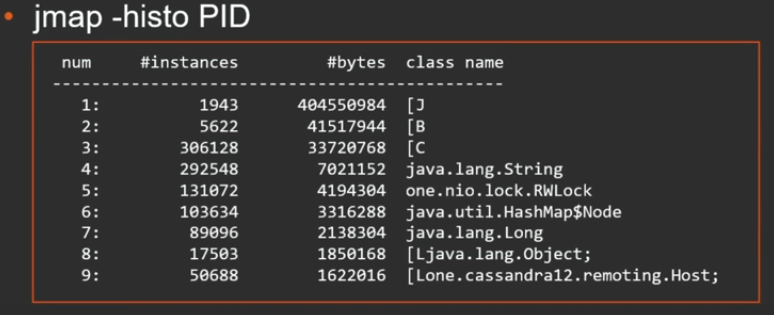
, . , . , .
jmap 2 : Dynamic Attach Serviceability Agent ( ).
jmap -F , , JVM. jmap -F , .
jmap? , - . , - , VM — , , . , Dynamic Attach . , , - , -F. . , . jmap , - .
, , forced-.
$ sudo gcore 1234
$ jmap -dump:format=b,file=heap.bin /path/to/java core.1234
, — , — core dump. . , . .
jmap «» core dump.
.
tomcat pid 2362. jmap forced-:

. . , gcore, core dump . 227 .
: , tomcat .
jmap core-.

, .. , , , ( , jmap -F, , 1 ). , , jmap -F .
, - , - . :
-XX:+HeapDumpOnOutOfMemoryError
— out of memory. GC , .
:

, .

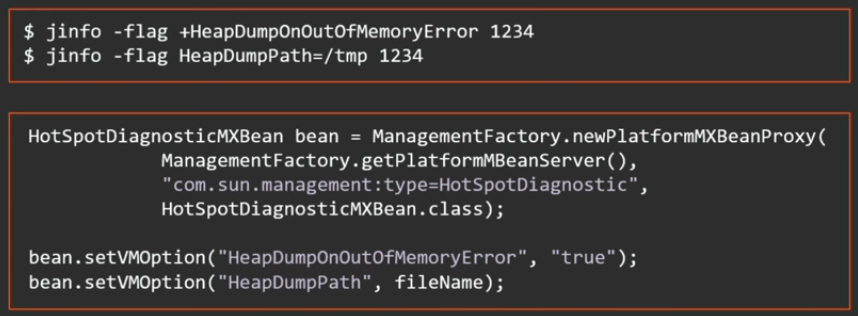
, manageable, .. , jinfo, JMX-.
Java 8 update 92 2 - ( downtime ):

, , , , . 2 ( out of memory ):

?
java, native, , .
MXBean:
HotSpotDiagnosticMXBean bean = ManagementFactory.newPlatformMXBeanProxy( ManagementFactory.getPlatformMBeanServer(), "com.sun.management:type=HotSpotDiagnostic", HotSpotDiagnosticMXBean.class); bean.dumpHeap("/tmp/heap.bin", true); JMX remote interface, .
: jmap , ssh - , , — JMX remote interface.
JVMTI. IterateOverInstancesOfClass .
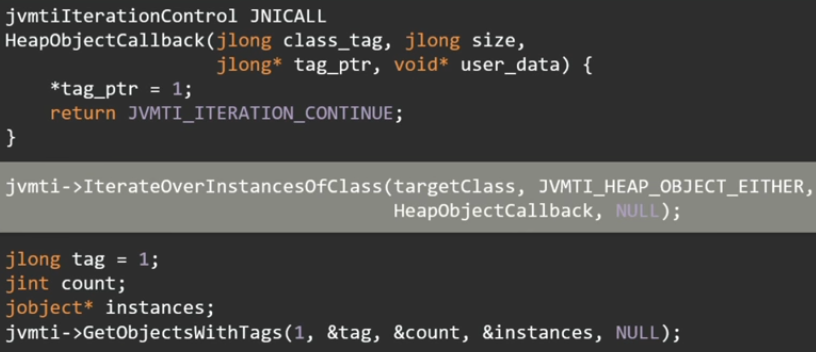
, - . , , 16 .
, . , , . GetObjectsWithTags jobject.
— serviceability agent — API, HotSpot. JDK JVM, Java-.
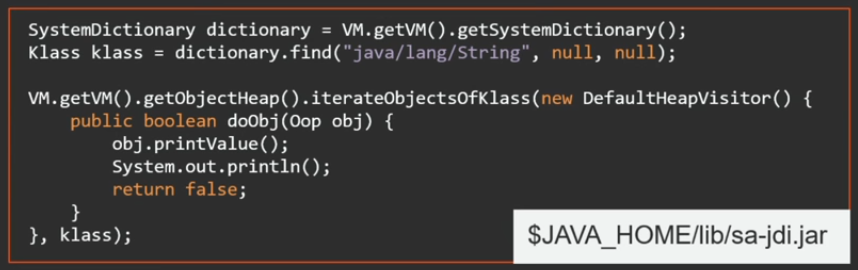
Java sa-jdi.jar — API serviceability agent. : JVM, , Java API, . , VM .
.
, — , . - , , . , , .. . serviceability agent .
API .
package demo6; import sun.jvm.hotspot.oops.DefaultHeapVisitor; import sun.jvm.hotspot.oops.Klass; import sun.jvm.hotspot.oops.Oop; import sun.jvm.hotspot.runtime.VM; import sun.jvm.hotspot.tools.Tool; public class KeyScanner extends Tool { @Override public void run() { Klass klass = VM.getVM().getSystemDictionary().find("java/security/PrivateKey", null, null); VM.getVM().getObjectHeap().iterateObjectsOfKlass(new DefaultHeapVisitor() { @Override public boolean doObj(Oop oop) { oop.iterate(new FieldPrinter("key"), false); return false; } }, klass); } public static void main(String[] args) { new KeyScanner().execute(args); } } ( Tool), execute ( ). run .
serviceability agent, Java-. .
tomcat .
— , .

, , . Print , .

. FieldPrinter, , fieldName, .
package demo6; import sun.jvm.hotspot.oops.DefaultOopVisitor; import sun.jvm.hotspot.oops.OopField; import sun.jvm.hotspot.oops.TypeArray; public class FieldPrinter extends DefaultOopVisitor { private String fieldName; FieldPrinter(String fieldName) { this.fieldName = fieldName; } @Override public void doOop(OopField field, boolean isVMField) { if (field.getID().getName().equals(fieldName)) { TypeArray array = (TypeArray) field.getValue(getObj()); long length = array.getLength(); System.out.print(fieldName + ": "); for (long i = 0; i < length; i++) { System.out.printf("%02x", array.getByteAt(i)); } System.out.println(); } } } private key .
serviceability agent , API . , : , , oldGen. serviceability agent , API. Java- oldGen, , oldGen, .
tomcat, oldGen:
package demo6; import sun.jvm.hotspot.gc_implementation.parallelScavenge.PSOldGen; import sun.jvm.hotspot.gc_implementation.parallelScavenge.ParallelScavengeHeap; import sun.jvm.hotspot.gc_interface.CollectedHeap; import sun.jvm.hotspot.oops.DefaultHeapVisitor; import sun.jvm.hotspot.oops.Klass; import sun.jvm.hotspot.oops.Oop; import sun.jvm.hotspot.runtime.VM; import sun.jvm.hotspot.tools.Tool; public class OldGen extends Tool { @Override public void run() { CollectedHeap heap = VM.getVM().getUniverse().heap(); PSOldGen oldGen = ((ParallelScavengeHeap) heap).oldGen(); Klass klass = VM.getVM().getSystemDictionary().find("java/lang/String", null, null); VM.getVM().getObjectHeap().iterateObjectsOfKlass(new DefaultHeapVisitor() { @Override public boolean doObj(Oop oop) { if (oldGen.isIn(oop.getHandle())) { oop.printValue(); System.out.println(); } return false; } }, klass); } public static void main(String[] args) { new OldGen().execute(args); } } :
- ;
- , , . API ( , JVM ).
.
— 7-8 JPoint 2017 . « JVM- », , , . «» , !
, JPoint Java — , .
Source: https://habr.com/ru/post/325064/
All Articles