Good trigger, bad trigger: how we monitor hundreds of servers around the world

The need for monitoring should be obvious for almost any company, however, I have repeatedly come across examples when the guys came to this conclusion only after a fall in production. And often the team learned about it after the fact - from its CEO, to whom his friends complained about the inaccessibility of the project, who decided to suddenly look at the startup. And in anger, he calls the team members with a question not even “why everything fell,” but why he knows about it, but they don’t. And here the thought comes to their mind, why not set up monitoring? It would seem that it could be easier ...
For example, we need to monitor around the clock more than 46,000 metrics on more than 500 servers in 6 data centers and 4 countries, and War Robots DAU games steadily pass for 1,500,000 people.
')
But the correct, real monitoring is written in the blood of the system administrator and developer. Each case, each facac, and even internal processes, including the amount of toner in the printer cartridge, should be described by a monitoring scenario. I decided to talk a little bit about what we encountered when organizing this process, as well as how the system administrators worked, reducing the number of duties and improving their quality. In this case, emphasis will be placed on the approach to monitoring, while setting up a particular system is easily googled and without assistance.
First, a few cases from the past. I remember there was a case when some Java-process by API gave 200 and an empty body. The process hung, the port was open and the connection with the telnet accepted. But at the same time any http-request from internal services to the API also gave 200 and an empty body. And it would seem that there is a service, the port responds, but does not give data. Therefore, we now, wherever possible, check a special URL that does not load the service, but is tied to its work and if everything is OK, it gives 200, and in the body it is the result of the work. The error in our case will be either a response other than 200, or any inconsistency with the expected format.
On another occasion, the problem was with the connectedness of the nodes in the cluster, when one node could not see someone from the cluster, and all the rest thought that everything was in order. The database developers then explained this in their own bug. But this did not make it easier for us, and the result of the acquired experience was the addition of new monitoring metrics. From each cluster node we began to collect data on the number of nodes in the DOWN state. And if this value is greater than 0, a script is executed on a specific host, which writes the address of the host with which connectivity is missing to a separate metric.
Also, after a certain situation, we began to monitor DNS rezolvy from server to server. It was a case when there were problems in the game, but monitoring only worked for the investigation. To understand the reasons, I had to dig a little. As it turned out, some of the hosts started to incorrectly resolve some of our DNS names. So now we have a special mechanism that checks name resolution. In case of a problem, a trigger is triggered and then all critical names are entered into the hosts file. This allows you to get the minimum down time and the opportunity to calmly understand the causes of the problem.
Instruments
What exactly to monitor is an important and very good question. At one time, several Nagios servers on the thruk + nconf + munin stack did a great job with us. But when the servers started adding 50 units a month, and the services of 300 a week, the nagios and the munines could no longer cope with the load and respond to our ideas about automation.
In the end, no matter how painful it was, we had to move to Zabbix. And the point is not only in the difference of Zabbix and Nagios approaches, but also in a huge number of custom metrics that we had to rewrite. And also in the absence of the ability to check the most critical parts in combat conditions at Zabbiks, because we would not call them artificially.
But the relocation gave us a single configuration and management interface, an API for registering servers and assigning them in an automatic template mode, graphics out of the box, a more advanced Zabbix Proxy system and, if we really lacked something, you could use Zabbix Sender.
Ideally, a new server should be automatically registered in the monitoring system and a corresponding template should be assigned to it, based on its hostname (for example, a “good” hostname: web1.ios.ru.prod.example.com). Adding a pack of servers shouldn't be a headache either.
In our case, there is a complete correlation between all groups of hosts in all infrastructure systems. We add the server with a specially written role Ansible, which, by calling the Zabbix API, adds the host to the zabbix. Then he assigns him a host group and a template according to his group in FreeIPA and Ansibl. However, issues of automation are the subject of a separate large article.
In addition to the Zabbiks, we also have the Amazon CloudWatch, the remnants of the nagios and a couple more things.
How to accumulate all notifications in one place, so as not to run on five different status pages? For us, the revelation was PagerDuty - in it we set up a duty schedule and escalation policies. To send data to PD, we used standard modules for Zabbix and CloudWatch, and also wrote our modules to send the data we need, remnants of nagios and a few specific places. I was very pleased with their API - it completely covers all standard requirements.
Grafana showed itself as well, additionally bolted to standard zabbiksovymi graphics.

Good trigger, bad trigger
Separately, I would like to note that you should not get carried away and send notifications for each existing trigger, if you do not want to constantly wake up due to "false" positives. In exceptional cases, if you know that a service can produce one error per hour and this is normal for you, then you can aggregate errors per time delta. Thus, it is possible to minimize the false alarms of the monitoring system by sending a notification of the problem, for example, only in the event of three or more errors within 15 minutes.
Nevertheless, nothing should escape the all-seeing eye of monitoring.
Monitoring requires both software performance and interaction processes between services — for example, connecting to a database not from a database server, but from an application server that uses this connection directly.
If you have a hard-core raid, put CLI utilities and add the status of your RAID array to monitoring. If you know the critical (for the user) page load time and its size - monitor this too. If you have your own internal protocol - ask the developers to give you the Status Page (and always ask for explanations for each metric, better with the description in the project wiki) or provide tools for independent tests of the closed internal development protocol.
Bad, incomprehensible metric: All systems state - OK.
Good metric: Server to server query time - OK (under 2 sec).
I would also like to recall the types of notifications info, warn and crit. You can describe everything you want with a trigger info - you will receive statistics on this metric, see the graph and, perhaps, at some point you will understand that you need to add treshchold to warn and crit on this metric. Or you can determine in retrospect when your metrics began to grow. But the warn and crit values should be very transparent and clear to you. In fact, each of their false positives is a loss of 15 minutes of time.
How not to bring the problem to the point of absurdity
It is important to understand not only by what criteria we send a notification, but also to whom. This may be different lines of those support or developers and admins. In some particularly critical cases, you can even send a notification to the CEO, but, of course, you should not bring this up.
Previously, we had two administrators on duty every two nights. As a result, four people stably did not get enough sleep, and the quality of work and on duty gradually fell. Proper construction of the escalation policy has made it possible not only to improve the quality of work, but also to reduce the number of duties and overtime hours of the system administrators on duty.
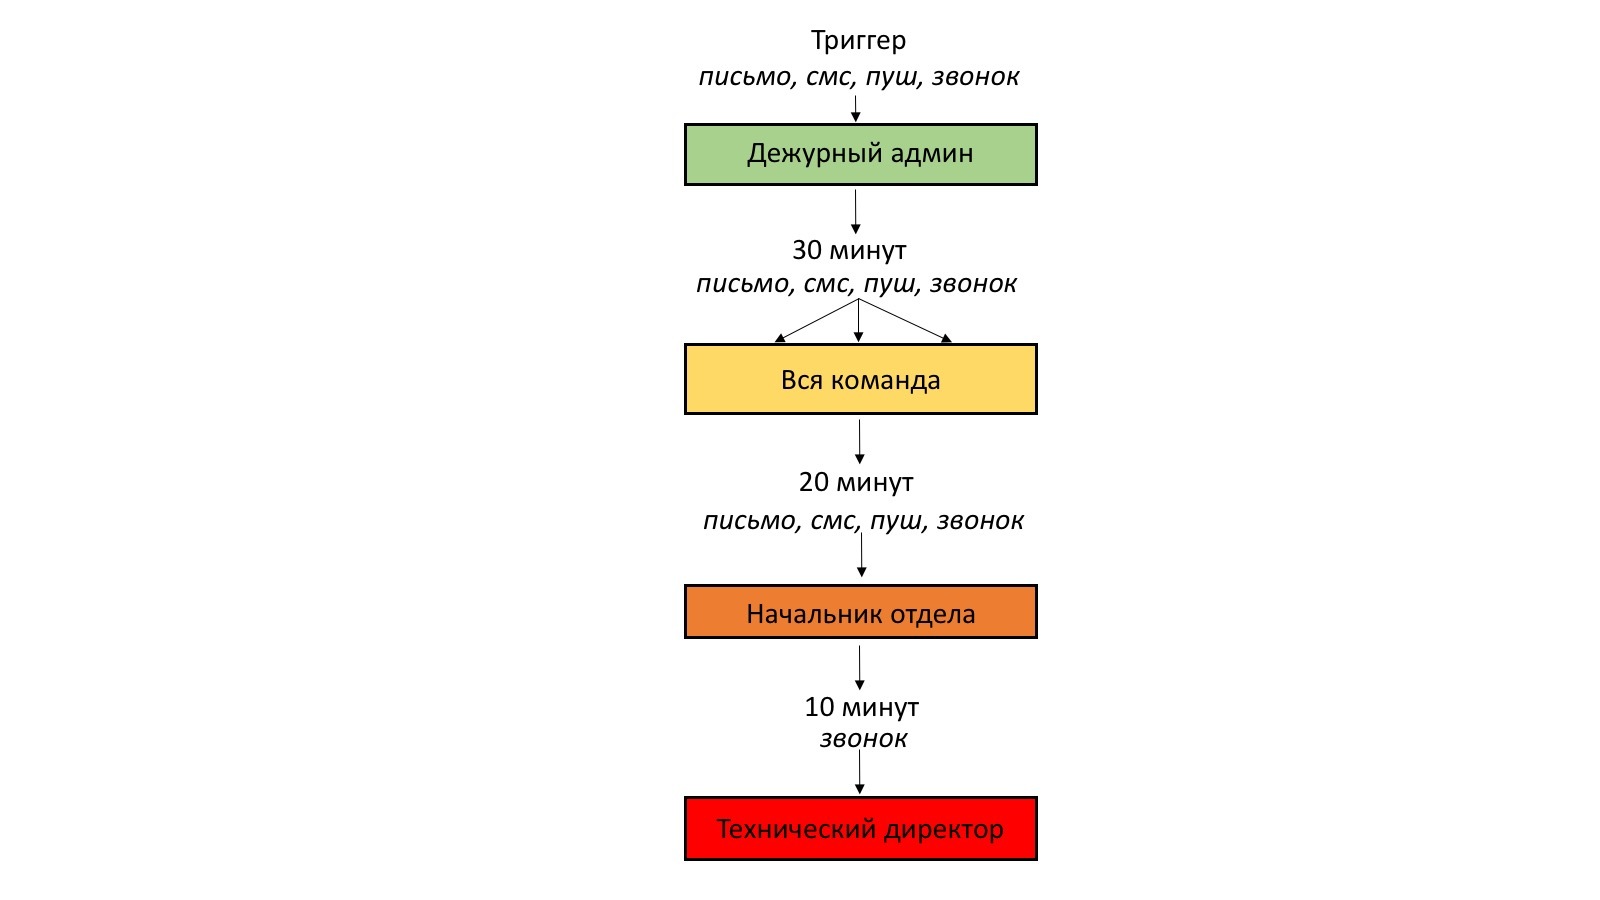
Now each admin is on duty after three days. In general, the escalation policy in our case is as follows:
- when a trigger is triggered, alerts are sent to the administrator on duty: by mail and via PagerDuty - on Slack, by SMS, by push-notification and by a call from the robot;
- if there is no reaction after 30 minutes, the problem is escalated to the whole team using all available notification methods;
- if the whole team does not respond within 20 minutes - the escalation occurs to the head of the department;
- if he has forgotten the call from the system - after 10 minutes we call the technical director.
In fairness it should be noted that we have never reached beyond the second step.
At the same time, we have only 2 server administrators, and 2 helpdesks are sufficiently qualified to solve the simplest problems that may arise with the server infrastructure - for example, restart / reboot the server or execute traces and create a ticket to the data center.
Monitoring ahead of the curve
A few words about the preventive tuning of monitoring key innovations.
Even before the release of each new feature, the developers prepare and submit to our department documentation on critical metrics that require attention from monitoring. Based on these data, information metrics are configured to determine further battle (production) metrics.
The documentation necessarily contains what each metric means, how it affects the neighboring parameters and the order of actions in the case of notification of a threshold value. For example, before introducing clan services, a percentage metric of files was added when querying them.
Geography lessons
The question of the geographical location of the monitoring server must be approached very consciously. A vivid example of how to do NOT (but many continue to make this error) is to locate the monitoring server in the same data center, where the server will be monitored. In this case, if the entire ds goes to Down, you will again find out about it only from your CEO.
Another common mistake: to place monitoring in the same country as the server, if the main income is brought by users of another country. In this scenario, monitoring, which is located, for example, in Berlin, will show that everything is fine in Germany, while users from the United States will experience network delays in case of a decline in the performance of international communications of those networks that you use. But again, you will not learn anything about it and on the stand-up in the morning you will be asked why yesterday there were payments on the charts and whether everything was fine with the servers, you will lose your arm.
More specifically, we have a central server to which individual proxies are connected, which are located in a specific region. Each proxy collects data and sends it to a central server. Monitoring of important and geographically dependent services is carried out either by custom user parameters from each interested host, or from each proxy server. This gives us a clear understanding of geographical issues.
Monitoring monitoring and not only
But it should not be limited to monitoring only external things. Monitoring internal processes is just as important. Regardless of whether we are talking about the amount of toner in the printer cartridge or the number of registered (build) agents in your CI / CD system. Each allowed facies internal infrastructure leads to the paralysis of the work of a department.
It is also useful to monitor the number of Wi-Fi clients connected to the access point, the workload of the main and backup channels of the office Internet. For example, we have more than 300 Wi-Fi devices simultaneously connected to the corporate network and generating traffic. And without monitoring it would be very difficult to pre-set additional access points where necessary.
Monitoring of Wi-Fi points, in particular, once helped us solve the problem with testing the game. The QA department began to complain about the high ping in the game and it was monitoring that made it possible to find out that the majority of testers, for certain reasons, connected to the same Wi-Fi point, while the rest of the points remained free.
Test and stage servers should be monitored no less than production. Our developers always compare monitoring schedules before and after the release of new features, various marketing companies and their effect on the overall system load.
And of course, let's not forget about monitoring monitoring. In case of a monitoring server crash, force majeure situations that you do not know about are not excluded, because the monitoring server is unavailable. In our case, there is a specially written service that, regardless of the main zabbiks, will check the status and availability of zabbiks servers and zabbiks proxies.
Source: https://habr.com/ru/post/325040/
All Articles