Clustering text documents according to semantic features (part two: model description)
Word2Vec Models
As mentioned in the first part of the publication , the models are derived from classes — the representation of the result of the text word2vec in the form of associative semantic classes by smoothing the distributions.
The idea of smoothing is as follows.
- We obtain a frequency dictionary of educational material, where each word is assigned its frequency of occurrence of the documents (that is, how many documents this lexeme met).
- Based on this frequency distribution for each class word, its standard deviation (or variance, in this case does not have a fundamental difference) is considered.
- For each class, we consider the average of all deviations of its components.
- From each class we remove "outliers" - words with a large standard deviation:
Where SDw is the standard deviation of each word, avr (SDcl) is the mean root mean square of the class, k is the smoothing coefficient.
Obviously, the result will depend on the coefficient k. His choice is an empirical task, it depends on the language, the size of the training sample, its homogeneity, etc. But still, we will try to identify some common things.
')
Building and testing models
For the models used material collected from the daily flow of the Internet, collected on the lists of the most frequent keywords. The English text contained about 170 million word forms, Russian - a little less than a billion. The range of classes was from 250 to 5000 classes in increments of 250. The remaining parameters were used by default.
Testing was conducted on the Russian-language and English-language material.
The test method in two words is as follows: reference test cases were taken for classification and run through clustering models with different parameters: by changing the number of classes and the smoothing coefficient, the dynamics of the result change and, consequently, the quality of the model can be demonstrated.
English five buildings taken from an open source :
- 20NG-TEST-ALL-TERMS - 20 themes (10555K)
- MINI20-TEST - 20 themes (816K)
- R52-TEST-ALL-TERMS - 52 threads (1487K)
- R8-TEST-ALL-TERMS - 8 themes (1167K)
- WEBKB-TEST-STEMMED - 4 threads (1271K)
Russian corps had to be used from private development, since it was not possible to detect open sources:
- Ru1 - Short Message Enclosure - 13 Topics (76K)
- Ru2 - News corps - 10 topics (577K)
When testing, we used the simplest method of comparison, without using any complex metrics. The choice in favor of such a simple classification (Dumb classifier) was made in view of the fact that the purpose of the study was not to improve the classification result, but to make a comparative analysis of the results with different input parameters. That is, it was not the result that was interesting, but its dynamics.
At the same time, tests were conducted on some clustering models using the logfi measure TFiDF to check how, in principle, these results on these models can differ from the results on models trained in lexical unigrams. Such tests showed that the results on models with associative semantic classes are almost as good as models on unigrams: there was a slight deterioration in quality from 1 to 10%, depending on the test case. That speaks about the competitiveness of the obtained clustering models, considering that they were not originally “sharpened” under the topics.
The dependence of the quality of the model on the number of classes
Tests with different numbers of semantic classes were carried out with all bodies: from 250 to 5000 with a step of 250 classes.
Figures 1 and 2 demonstrate the dependence of classification accuracy on the number of classes of models for Russian and English.

Fig.1. Dependence of classification accuracy on the number of word2vec semantic classes for Russian-language buildings. The abscissa is the number of classes, the ordinate is the accuracy values.
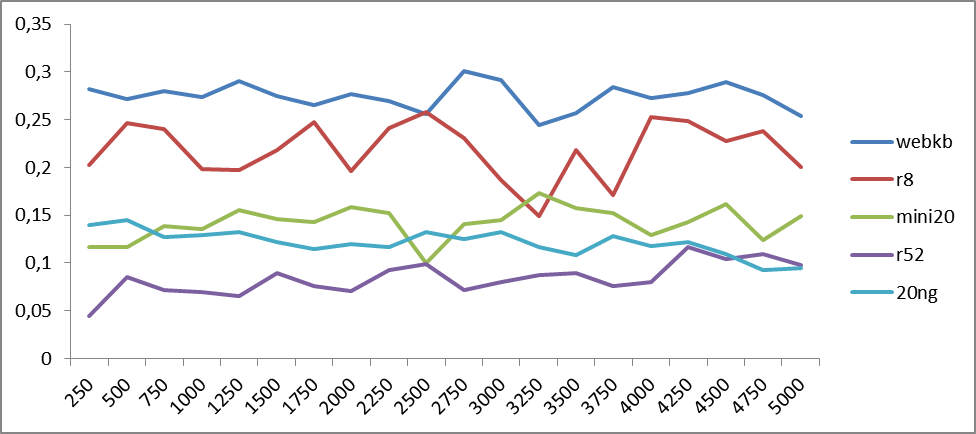
Fig.2. The dependence of classification accuracy on the number of word2vec semantic classes for English-language buildings. The abscissa axis shows the number of classes, and the ordinate axis - the classification accuracy.
From the graphs it can be seen that the fluctuations in accuracy are periodic, the period of which can vary depending on the material being tested. To determine trends, we construct graphs of average values.

Fig.3. The mean value is the dependence of the classification accuracy on the number of word2vec semantic classes for Russian-language buildings. The abscissa is the number of classes, the ordinate is the accuracy values. A polynomial (6th power) trend line has been added.

Fig.4. The mean value is the dependence of classification accuracy on the number of word2vec semantic classes for English-language buildings. The abscissa is the number of classes, the ordinate is the accuracy values. A polynomial (6th power) trend line has been added.
From figures 3 and 4 it is already clear that the quality of the result increases on average with an increase in the number of classes in the range from 4 to 5 thousand. That, generally speaking, is not surprising: a more subtle partition of space leads to its concretization. But further splitting can lead to the fact that semantic classes begin to stratify into homogeneous pieces. And this already leads to a drop in accuracy, because the classes cease to be “hooked”: the same semantic will correspond to different semantic classes. This is observed in the approximation to 5 thousand classes for both Russian and English.
Curiously peaks are present in both figures in the region of 500 classes: despite the fact that there are few semantic classes (therefore, the classes are mixed), nevertheless, there is a macro-semantic association: classes as a whole are subject to one or another topic.
From the obtained results, we can conclude that, after all, a more optimal partition can be somewhere between 4th and 5th thousand classes.
The dependence of the quality of the model on the smoothing factor.
Figure 5 shows the changes in the classification accuracy for the R8 body at different smoothing factors (for 1500 classes). The frequency of changes for any number of classes within the same building is the same. Similar graphics are observed for all enclosures.
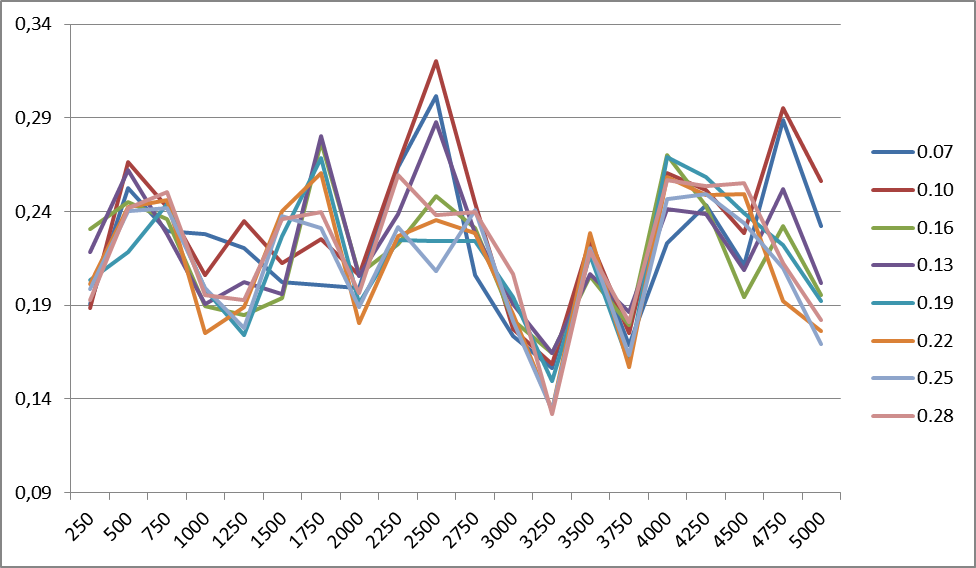
Fig.5. Changes in the classification accuracy for the body of the R8 at different values of the smoothing coefficient. The right shows the smoothing coefficient values.
To identify the main trends, we construct graphs of the average values of the accuracy of the smoothing coefficient for all the cases for the English and Russian languages.
 | 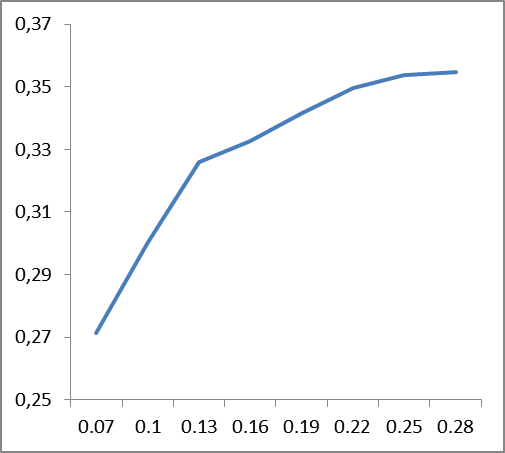 |
Figure 6. The dependence of the change in classification accuracy (vertical) on the values of smoothing coefficients (horizontally), averaged data by corpus: on the left - for English, on the right - for Russian.
From the graphs presented in Fig. 6 it follows that the smoothing coefficient is language dependent: if for English the stability occurs somewhere around the value of 0.22, then for the Russian it is about 0.12. Apparently, this should be somehow related to the complexity of the language, its perplexia.
It is difficult to say what explains the peak accuracy at the beginning (0.07) for the English language. Its presence is caused by the behavior of the R8 case, and, possibly, due to the lexical content of the case itself.
In fact, if we compare the data of the models themselves for different smoothing factors, it can be seen that at the above thresholds, some of the high-frequency words (prepositions, conjunctions, articles) are filtered. Therefore, there is no point in introducing stop lists: this vocabulary either filters or forms a separate associative semantic class with a fairly low weight.
The dependence of the smoothing coefficient variability on the number of classes has very little effect on the change in accuracy. At the same time, it was not possible to identify any trends of such influence for different materials.
findings
Of course, this is not the only, and perhaps not the best, method of obtaining models, because it is empirical and depends on many factors. In addition, smoothing can be done much more clever ways. Nevertheless, this method allows you to quickly and accurately build models and get good clustering results on large amounts of information.
Let us give an example of using clustering on Russian-language material.
Example
Social media message flow clustering with the search query "Sberbank". The number of messages is 10 thousand. This is approximately 10 MB of text or 5-6 hours of message flow on the topic of Sberbank.
The result was 285 clusters, from which you can immediately see the main events concerning Sberbank.
Here, for example, the first ten clusters (first message headers):
- Sberbank customers complained about failures in the online service - this kind of 327 messages
- Jews want to privatize Sberbank in the next 3 years - 77 messages
- Sberbank answers, such as: <name> hello, unfortunately, at the moment there really are interruptions in the work ... - 74 messages
- In 2017, Sberbank will conduct a test of quantum information transfer hi-tech - 73 messages
- in the year of its 175th anniversary Sberbank gives free admission to art museums - 71 posts
- learn about the benefits of a youth debit card visa Savings Bank and how to buy a sweatshirt for n ruble - 57 messages
- The Ministry of Economic Development proposed to include Sberbank in the privatization plan - 58 messages
- Sberbank reported failures in its systems - 60 messages
- Vladimir Putin took part in the conference ahead in the future the role and place of Russia - 61 posts (Sberbank also took part);
- Gref denied information on the privatization of Sberbank - 64 messages
Most likely, the 1st and 8th clusters can be combined into macro clusters based on additional information, for example, using geo-tags, sources of messages, predicative relations between objects, etc. But this is another task, which we will describe next time .
You can get acquainted with examples and demo implementation of the algorithm here .
Source: https://habr.com/ru/post/324998/
All Articles