SAP Business One ERP Solution Features on SAP HANA Platform
Hi, Habr! Today, we will continue to consider the SAP Business One solution for small and medium-sized businesses and discuss the features of the version on the SAP HANA platform.
Why do you need the version of SAP Business One on SAP HANA
SAP HANA uses in-memory technology to process and store data for high-speed decision making. SAP HANA also allows you to combine analytical and transactional platforms, which greatly simplifies the IT landscape and reduces the cost of its support (platform, integration, support, development).
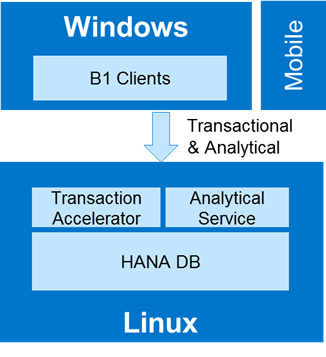
SAP Business One for SAP HANA solution architecture
')
Unlike the SQL solution, the SAP HANA components are deployed on a Linux server that is certified by the special SAP service and is labeled as SAP HANA Certified. SUSE Linux Enterprise Server is deployed on a server or virtual machine (currently 11 SP4 is supported). SUSE has prepared a special assembly for SAP Business One, which is available for free download.
On the topic of hardware, I suggest not stopping in detail - there are different options for setting up and using servers from various vendors.
Data modeling
For SAP HANA, there is a tool for working with databases and tables - SAP HANA Studio. SAP HANA is a database with column data storage. The tables inside SAP Business One, in comparison with the version for SQL, have been converted to a column-based data storage format. You can download data from tables in various ways - for example, using a SQL query. Since knowledge of the SQL syntax is fairly specific, SAP HANA Studio has a graphical query building tool.
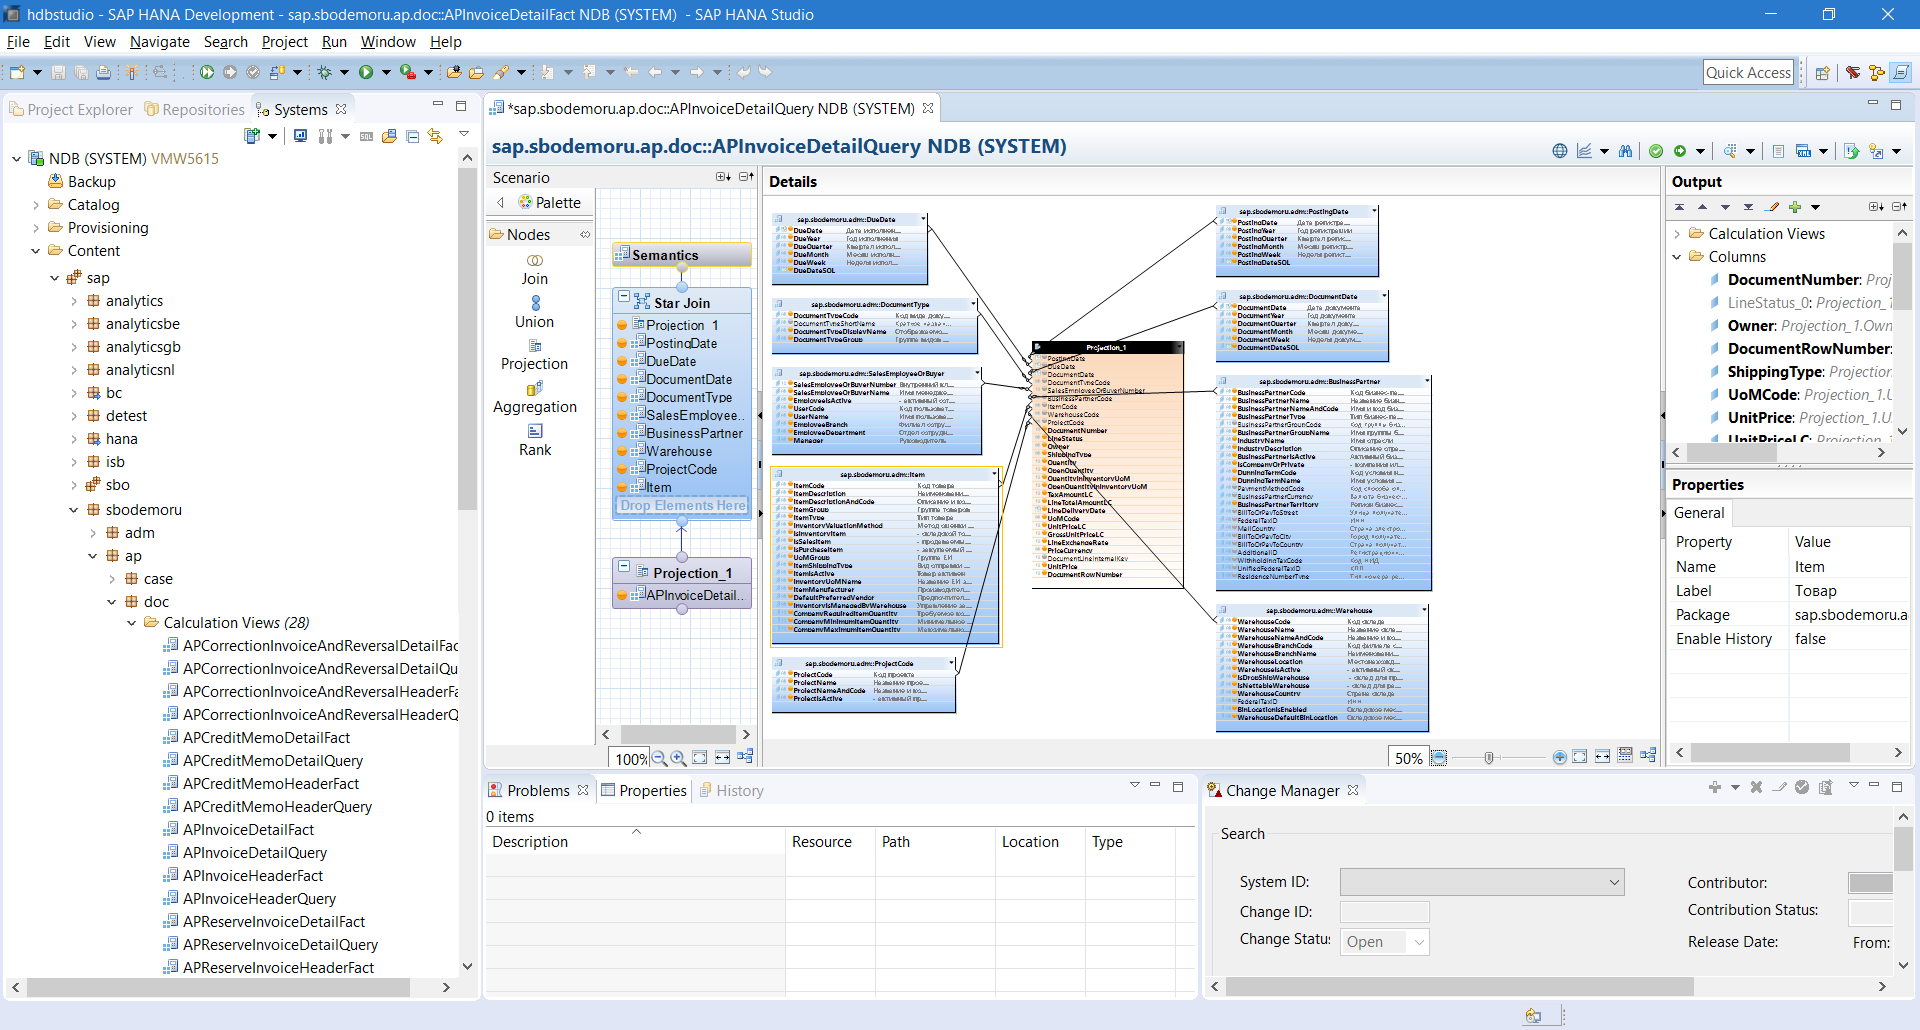
SAP HANA Studio in Calculation View Mode Mode
By dragging table data from the left window into the Script window, you can build a hierarchy of data from different tables, to enable the display of only certain columns (Details window).
In SQL syntax, this query would look like this:
The graphic query data is stored in the so-called calculation view. Next, we can use the created calculation view for use in SAP Business One.
By default, SAP Business One already contains various calculation views.
New user desktop
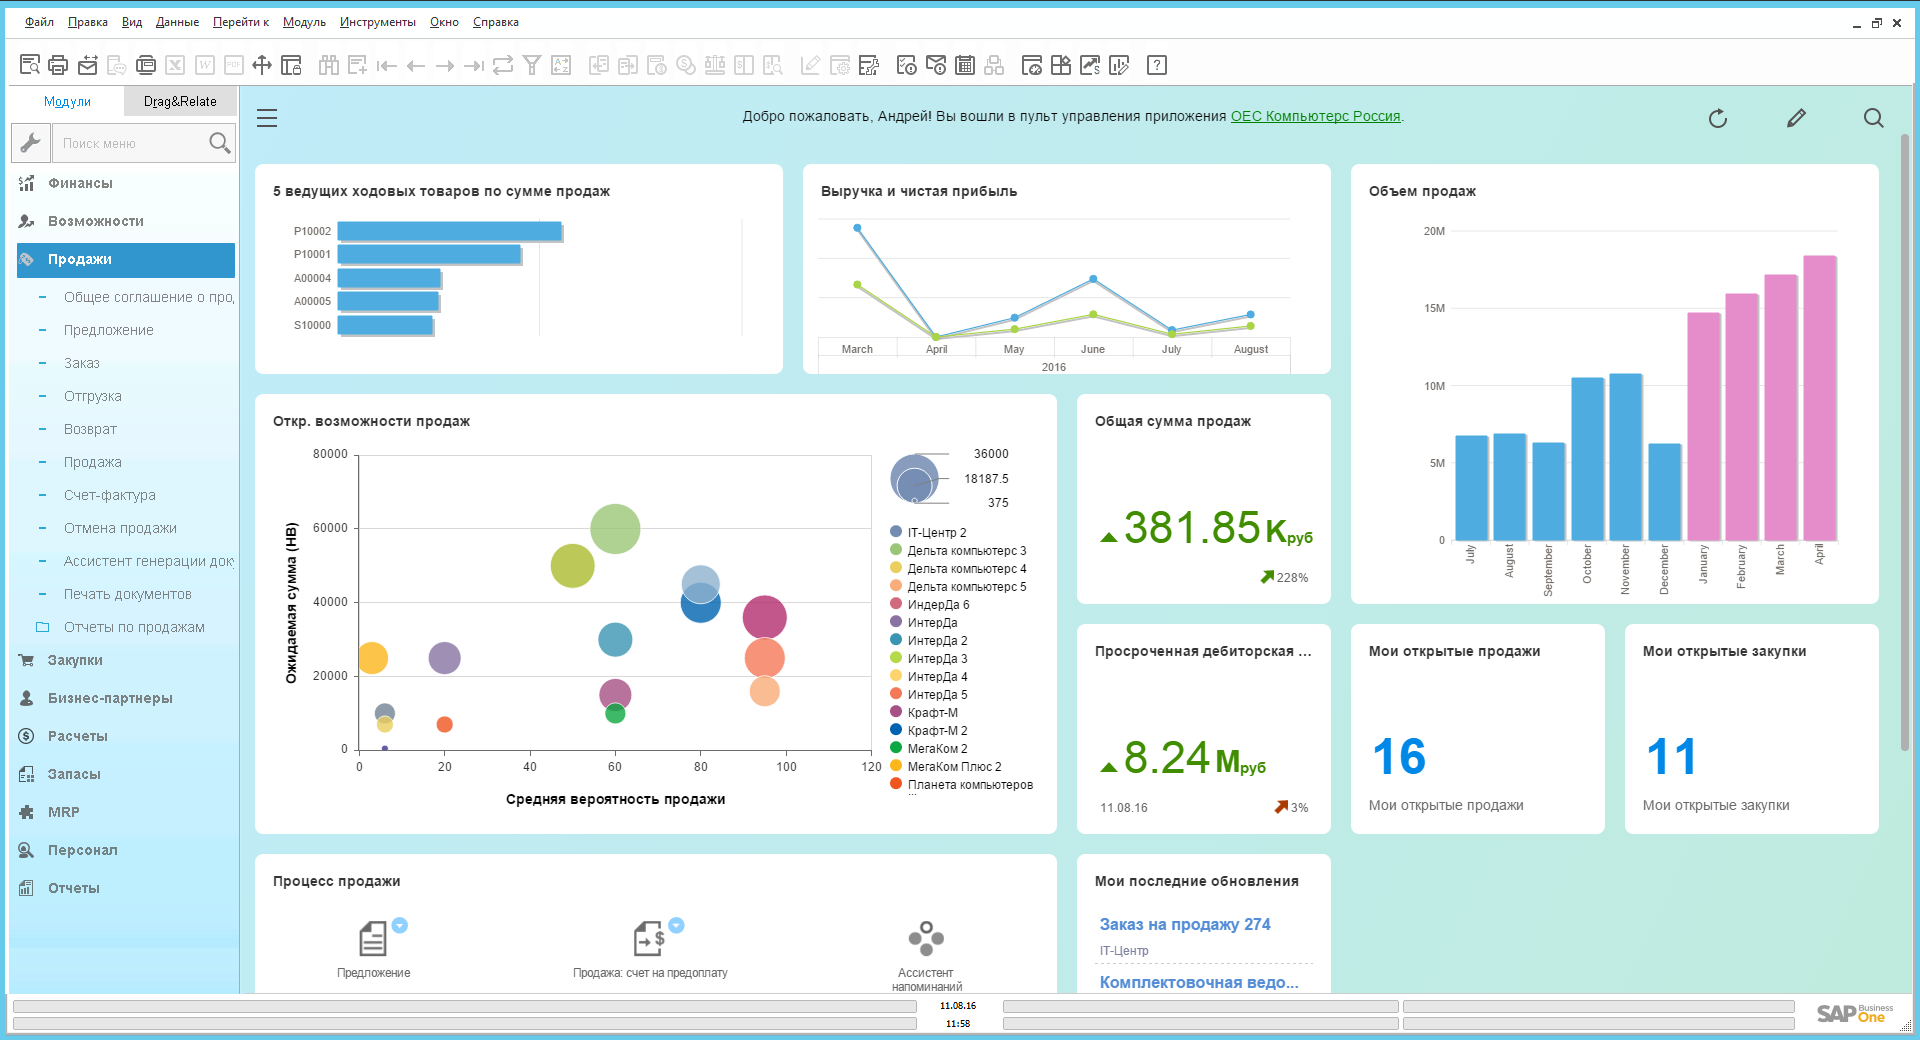
Fiori Style SAP Business One Desktop
The new Fiori style control panel is a user desktop with interactive features written in SAPUI5 (HTML5). On the control panel can accommodate various objects. We can control the size of objects, their position on the desktop. Objects automatically update the data (you can adjust the schedule) - so you are always up to date with the latest information on the activities of the company.
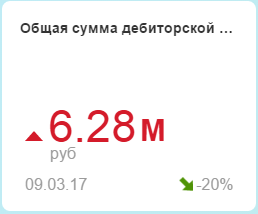
KPIs
This element is responsible for tracking and calculating the goal. You can set the color gradation of the percentage of completion, set the tracking dynamics (year to year, month by month, etc.).
Process map
SAP Business One by default includes 4 process maps: Sales, Purchasing, Stocks, and Finance. The process map is a tool to which the main elements of ERP (documents, reports) are derived with the routing of the necessary steps (workflow). The company can customize the appearance of such cards, add or remove necessary objects on or from the map.
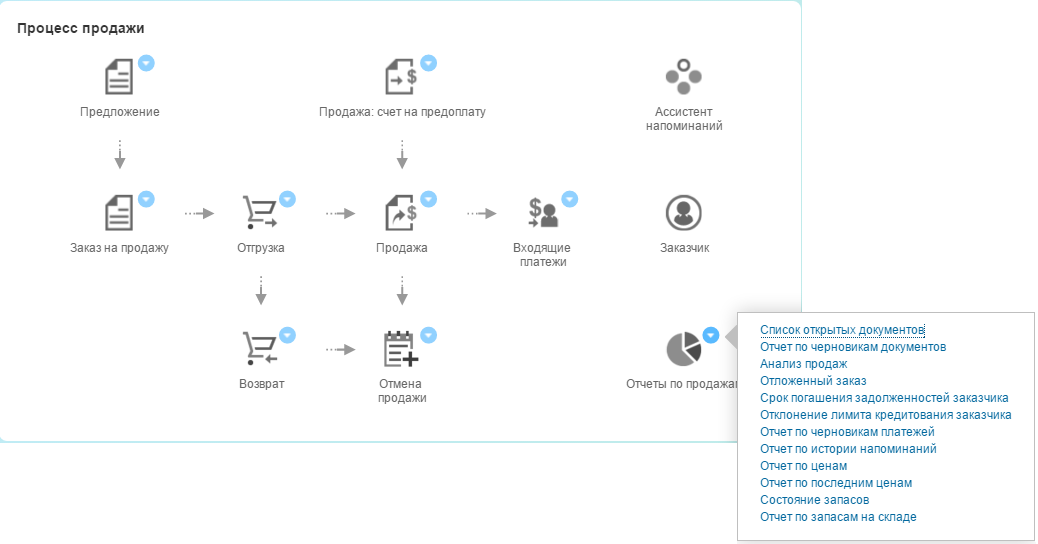
Map of the sales process with a list of sales reports disclosed
Object count
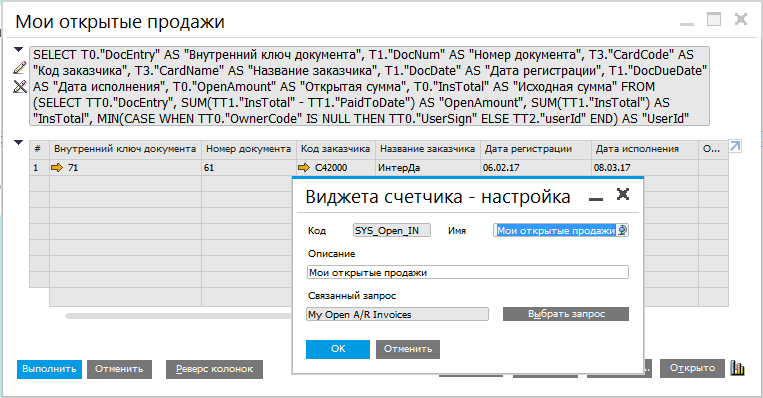
From the name it is clear that this element counts the number of specified objects (based on the SQL query to the database). There are many uses. For example, the number of open sales documents

The object counter is created based on the SQL query:
Toolbars (dashboards)
Dashboards, or dashboards, allow you to display the necessary data in dynamics, along several axes. There are many options for data visualization: chart type, display period, strategy (forecast, ABC analysis, etc.).
Analytics Tools in SAP Business ONE
SAP Business One is an ERP with great analytics potential. The in-memory platform and the available data processing tools allow you to get any information from the system as soon as possible.
End-to-end analytics
In the starting version there are more than 90 elements (KPIs, toolbars, counters, etc.) that can be placed on the user's desktop. But what to do if embedded KPIs or toolbars are not enough? For such cases, there is a tool "End-to-End Analytics". It allows you to create your own KPIs, toolbars and advanced toolbars. It is also possible to change the view and / or strategy of displaying data, assign actions to the right mouse click on the panel, or bind the toolbar to various objects (windows) in the system.
Let's build a dashboard based on the “Sales data” calculation view already familiar to us. To do this, in the Through Analytics tool, select the Panel Designer, determine the calculation angle, and a “designer” opens before us.
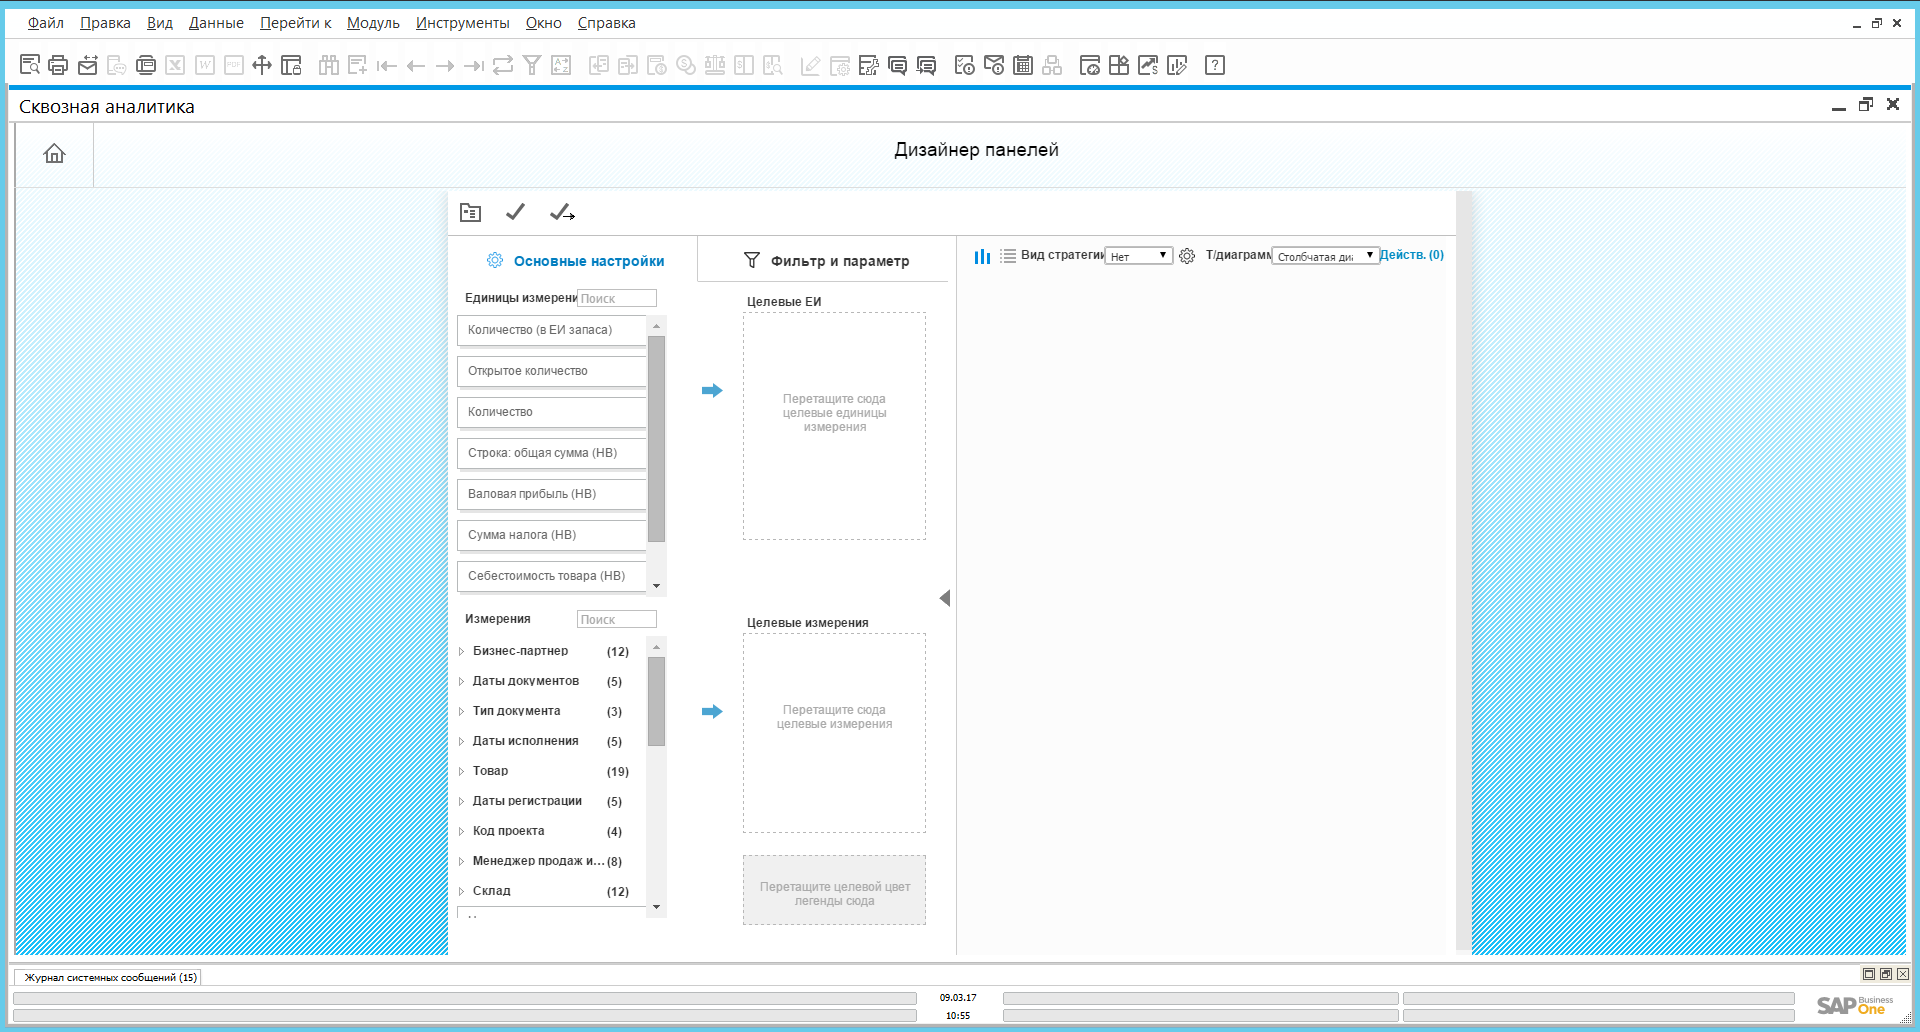
Dashboard Designer in End-to-End Analytics Tool
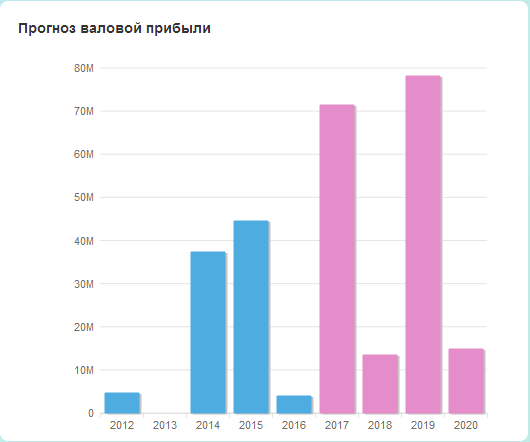
By dragging and dropping objects from the left pane into the target parameters windows, we can build the toolbar we need. In the example below, the analysis of gross profit by product groups for the first and second quarters of the current year:

You can add various actions for the toolbar. For example, a panel can be associated with various objects (basic data or a document). Choose a master data card of the business partner (counterparty). Also assign an enterprise search action to the object. Save the created panel and place it on the desktop. If we right-click on one of the columns of the created panel, we will see the available action “Search”.
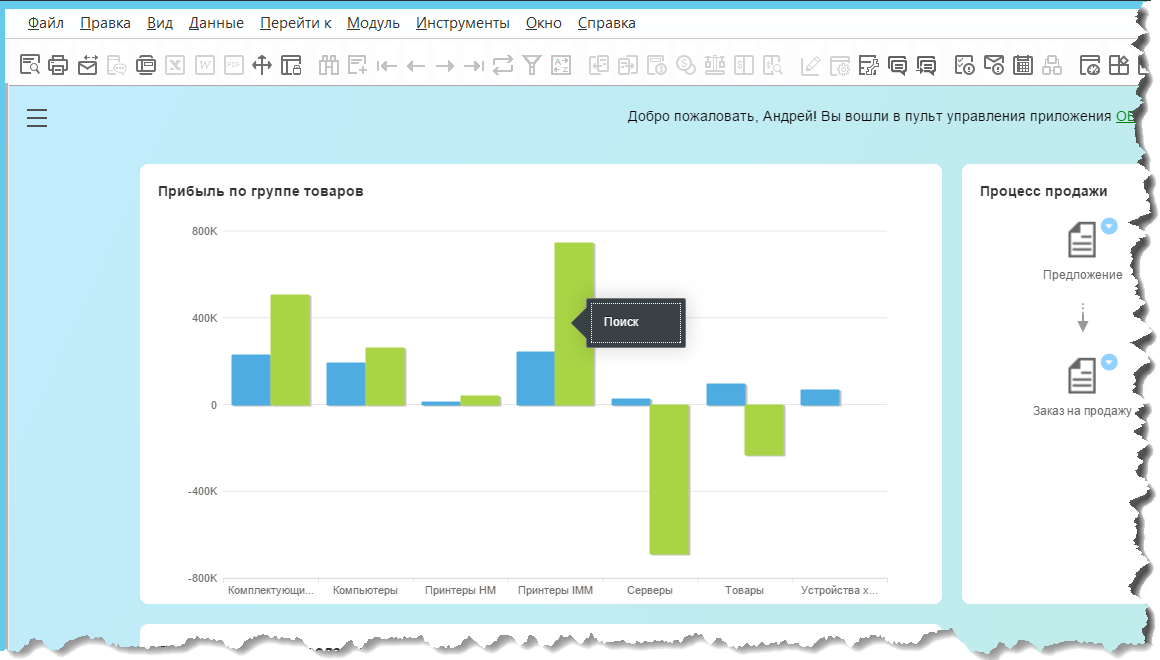
Created dashboard Profit by product group on the desktop
When you open the business partner's master data object, we will see the attached dashboard. In this case, the data in this diagram will be limited to the information that is associated with this particular business partner.

Business partner card with side toolbar
Corporate search
The SAP HANA chip that is actively used in SAP Business One is a quick search across all objects in the system with the ability to customize search settings and filter results by object type. A preview of the document in the search results is available.

Cash Flow Forecast tool
The Cash Flow Forecast tool allows you to visualize cash flow data.
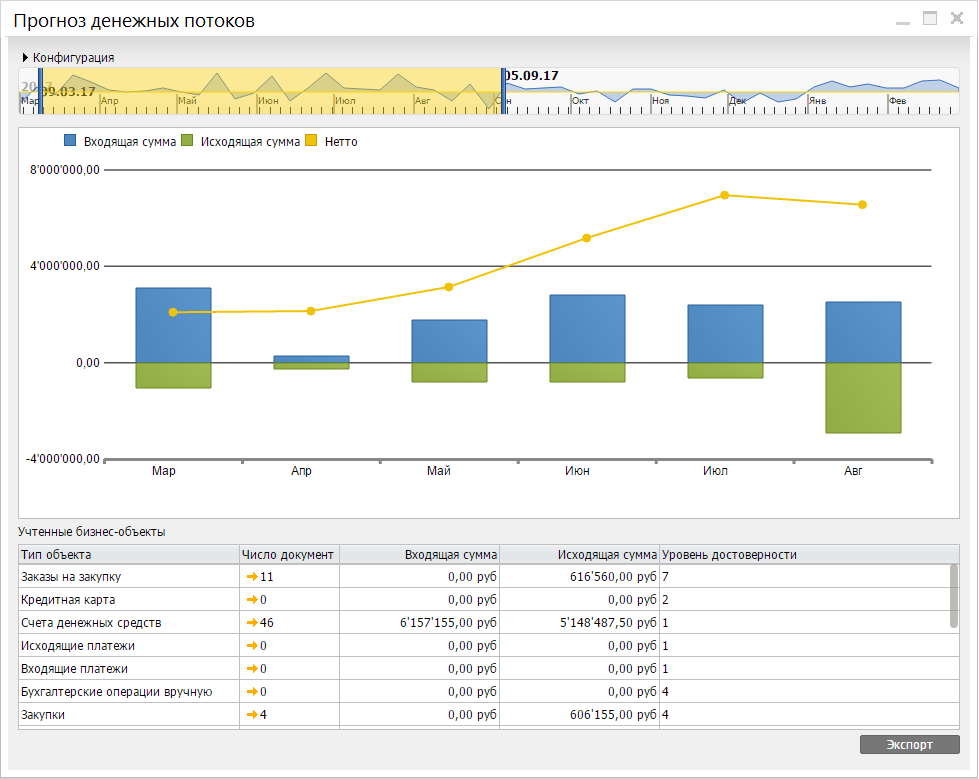
Using the "Configuration" window, you can customize forecasting scenarios by including or excluding various criteria for selecting objects. By narrowing the timing of displaying information, you can detail the data up to the day After clicking on the data column, incoming or outgoing operations are displayed in a table.
Supply Schedule Management Tool
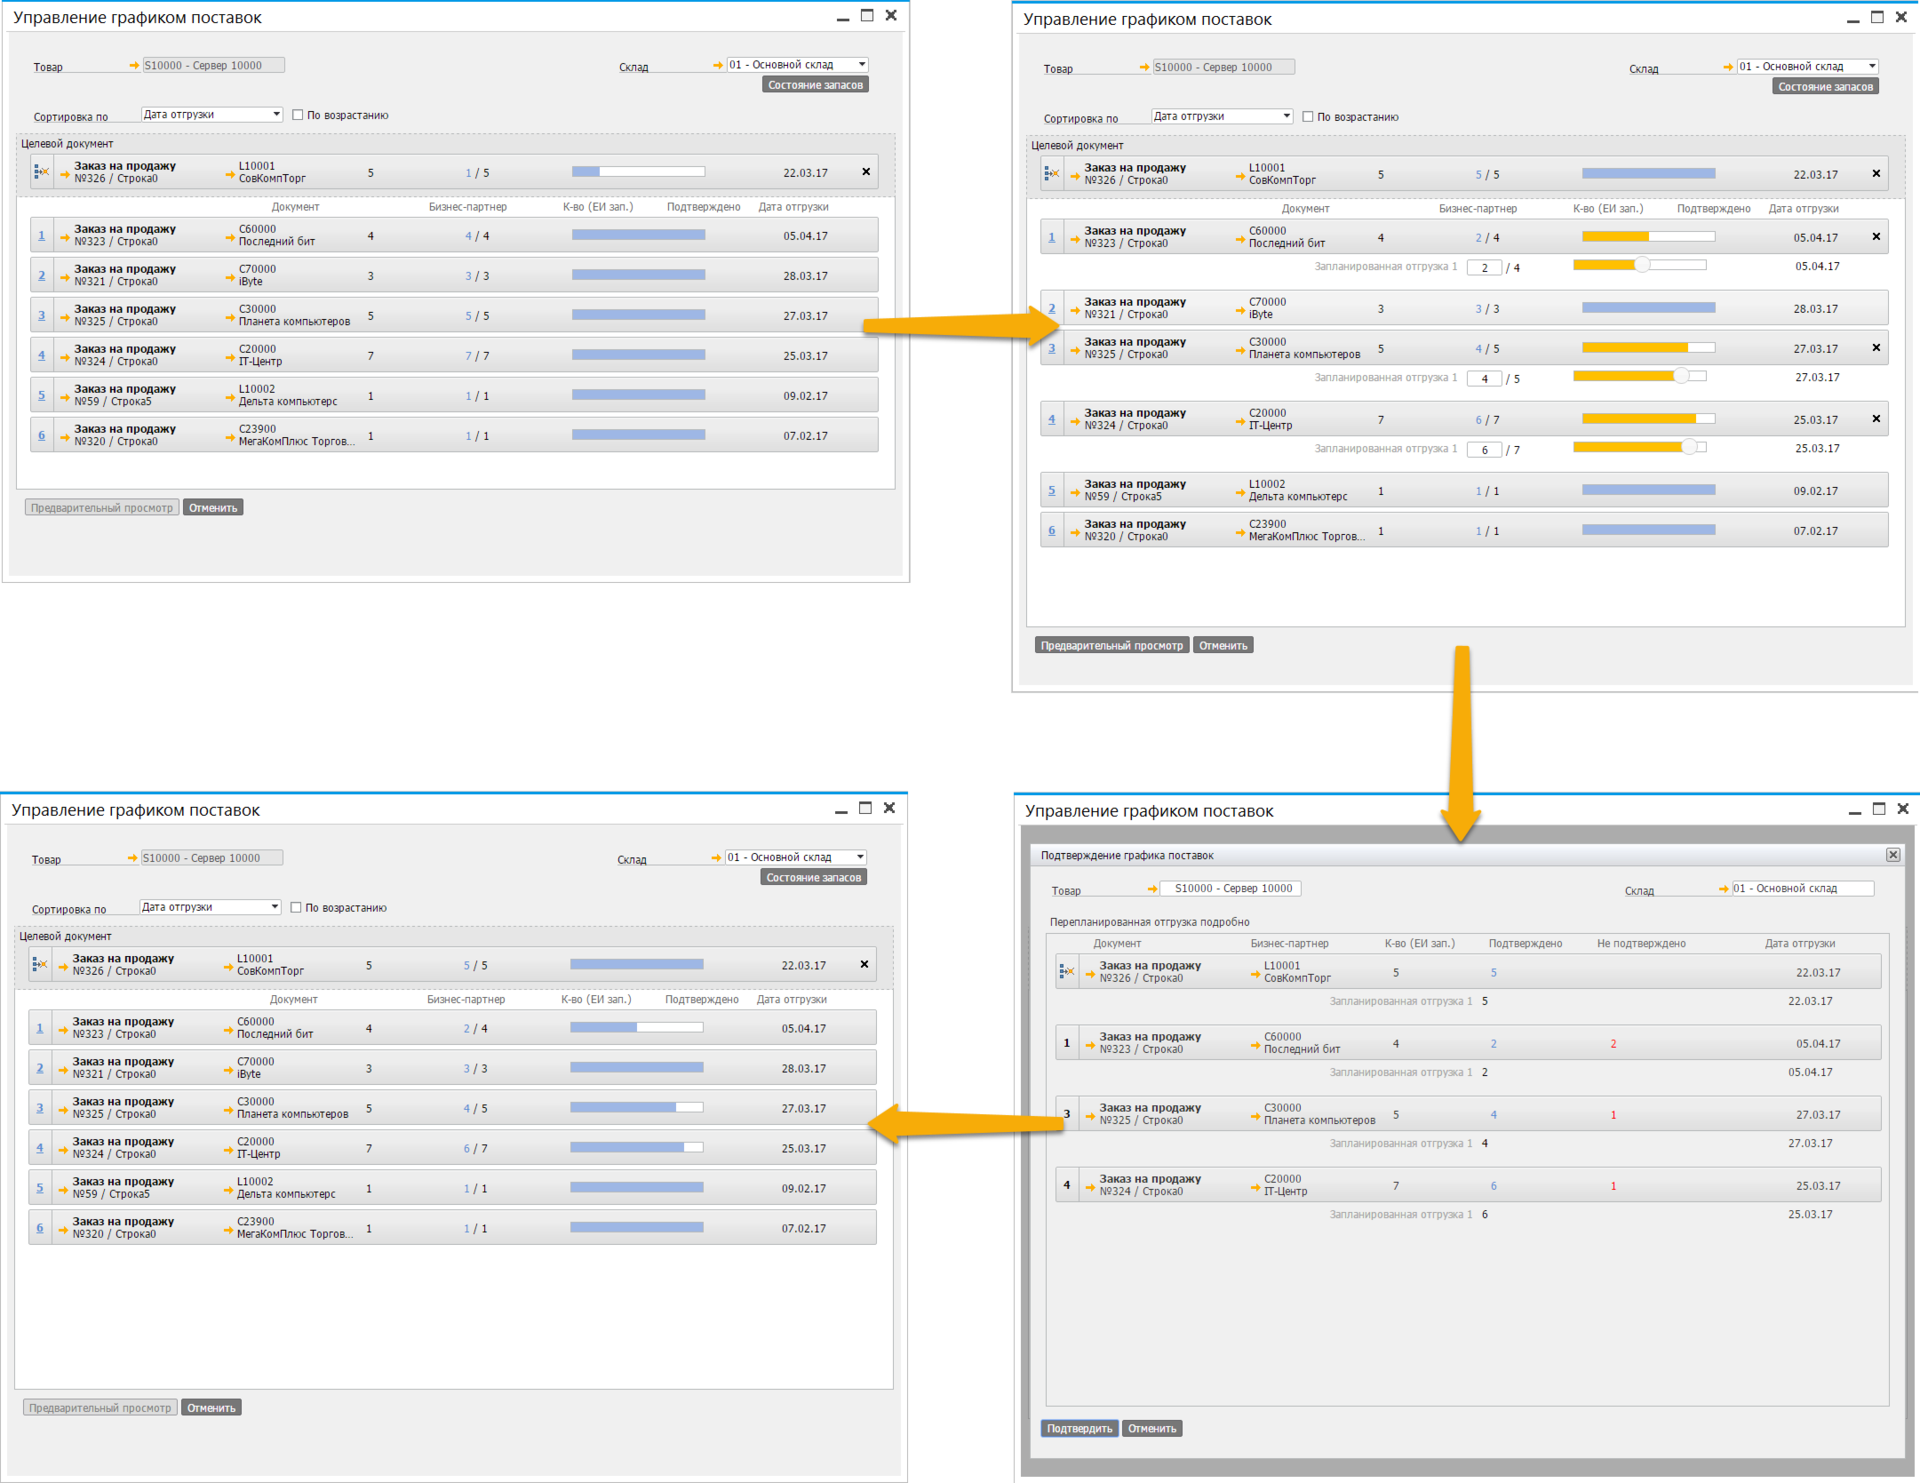
"Manage the supply schedule" - a tool that allows you to manage the schedule of one or more shipments in one window.
Product Availability Check (ATP) tool
This tool offers a graphical interface for product availability graphics. Everything is simple here: we drive in the necessary goods, the quantity of goods and the warehouse.

From the results it can be seen that the required item S10000 in the amount of 10 pieces will be available on March 13. March 18 is expected to deliver another batch of this product.
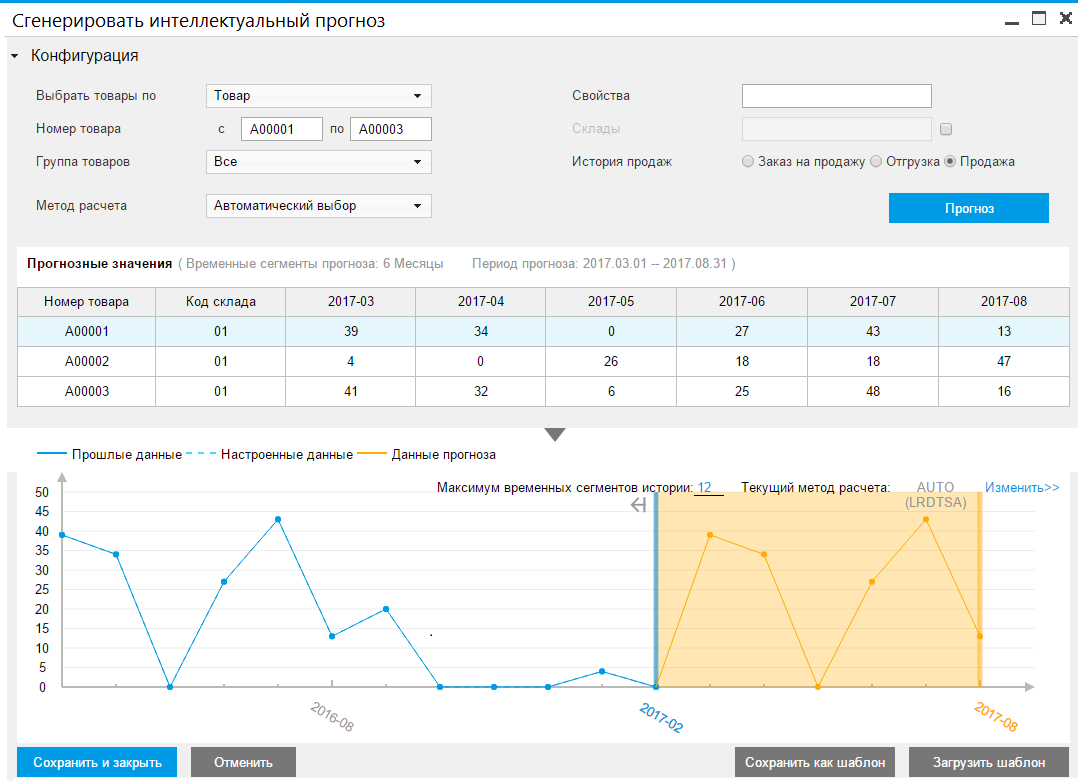
Intellectual Prediction Tool
In SAP Business One, there are two tools for forecasting the consumption of materials that can be used in the MRP Assistant to generate documents on stock transfers, purchasing, production. The “Baseline Forecast” takes into account historical data for the “simple average” model. “Intellectual forecast” is statistical forecasting based on embedded models, taking into account trends and seasonal factors: TESM (triple exponential smoothing) or LRDTSA (linear regression with a damped trend and seasonal component). SAP Business One automatically selects the best predictive prediction algorithm, and there is always the option of manually selecting a prediction model. There is a possibility of retrospective analysis to check the correctness of the intellectual forecast.
Tool "Sales Recommendation"
When you select a customer in sales documents, SAP Business One automatically lists the most frequently purchased items that are relevant to that customer. The bottom of the “Sales recommendation” window is activated after adding at least one product to the document and displays the list “With this product is also bought”.

Excel Reports and Interactive Analysis tool
We are sure that many readers keep in mind the question: what about Excel? This tool for working with tables in many companies is used as ERP. Some companies grow to full-fledged ERP-solutions, but the habit and desire to work with tables does not disappear anywhere. Our solution is integrated with Excel, so amateurs and professionals can use all its power to analyze data and prepare reports. Solution users who have sufficient authority in terms of authorization rights can create reports in Excel and import them into SAP Business One. During the product installation process, you will be prompted to install add-ins for Excel. Now the user can open Excel and work with data from the company database. If desired, you can create a report table with the necessary data and import it into SAP Business One. Further this report can be used by all employees of the company.
The Excel Reports and Interactive Analysis module is available in the standard configuration of SAP Business One. Module one, and tools, in fact, two.
1. Excel reports
All existing calculation angles (we considered them at the beginning of the review) are available in Excel. For example, create a report based on the view known to us Sales data.
By simply dragging the data of interest to us into the workspace, we create a report template:
1. In the "Grouping" area, set the grouping by product code.
2. In the "Sort and Filter" area, set up an ascending sorting for the "Item Name" column.
3. In the "Total group" and "Total" fields, drag the type of calculation from the corresponding field.
4. Add a simple calculation to the cell G4 = F4 / E4.
5. We divide the display of data by quarters of documents.
6. We direct the beauty with the help of the built-in Excel tools: draw the borders of the cells, add conditional formatting, limit the number of decimal places.
Click "Run report" in the "Basic Functions" section and enjoy our report!

2. Interactive analysis
For data analysis using Excel spreadsheets, the Interactive Analysis tool is used, which allows you to upload the calculation view from the system as a pivot table. You can create your own report template using the same add-in in Excel.
Mobile applications
SAP HANA is not only analytics, but also a development platform. Products developed on the SAP HANA platform, using built-in tools by default, are adapted for browsers and mobile applications. A prime example of such applications is the SAP Business One Sales app.
The application is designed for employees of sales departments working in the field. On the screen of a smartphone with iOS or Android, all the necessary functionality for such specialists is available: access to the calendar, work with a sales funnel, a catalog of goods and services, creating and editing sales documents, and analytics. The application is available for download in the Apple App Store and Google Play. After downloading, users can connect to the SAP test server for free.
As a conclusion
The SAP HANA platform opens up opportunities for building analytics, forecasts and developing your own software products. The SAP Business One solution, using the capabilities of this platform, allows small and medium-sized businesses to already use the advanced technologies of this platform in order to gain and retain leading positions in their industry.
You can get acquainted with examples of SAP Business One implementations on our website www.sapb1repository.com . Video with reviews of the solution capabilities and not only available on our YouTube channel www.youtube.com/user/businessonesap/featured
Comment, share your impressions and ask questions.
In the next article about SAP Business One, we will look at the use of the solution in various integration scenarios in detail.
Thank you all for reading and feedback!
Why do you need the version of SAP Business One on SAP HANA
SAP HANA uses in-memory technology to process and store data for high-speed decision making. SAP HANA also allows you to combine analytical and transactional platforms, which greatly simplifies the IT landscape and reduces the cost of its support (platform, integration, support, development).
SAP Business One for SAP HANA solution architecture
')
Unlike the SQL solution, the SAP HANA components are deployed on a Linux server that is certified by the special SAP service and is labeled as SAP HANA Certified. SUSE Linux Enterprise Server is deployed on a server or virtual machine (currently 11 SP4 is supported). SUSE has prepared a special assembly for SAP Business One, which is available for free download.
On the topic of hardware, I suggest not stopping in detail - there are different options for setting up and using servers from various vendors.
Data modeling
For SAP HANA, there is a tool for working with databases and tables - SAP HANA Studio. SAP HANA is a database with column data storage. The tables inside SAP Business One, in comparison with the version for SQL, have been converted to a column-based data storage format. You can download data from tables in various ways - for example, using a SQL query. Since knowledge of the SQL syntax is fairly specific, SAP HANA Studio has a graphical query building tool.
SAP HANA Studio in Calculation View Mode Mode
By dragging table data from the left window into the Script window, you can build a hierarchy of data from different tables, to enable the display of only certain columns (Details window).
In SQL syntax, this query would look like this:
SELECT "DocumentNumber", "LineStatus", "Owner", "DocumentRowNumber", "ShippingType", "UoMCode", "UnitPrice", "UnitPriceLC", "GrossUnitPriceLC", "LineExchangeRate", "PriceCurrency", "LineDeliveryDate", SUM("Quantity"), SUM("OpenQuantity"), SUM("QuantityInInventoryUoM"), SUM("OpenQuantityInInventoryUoM"), SUM("TaxAmountLC"), SUM("LineTotalAmountLC"), "PostingDate", "PostingYear", "PostingQuarter", "PostingMonth", "PostingWeek", "DueDate", "DueYear", "DueQuarter", "DueMonth", "DueWeek", "DocumentDate", "DocumentYear", "DocumentQuarter", "DocumentMonth", "DocumentWeek", "DocumentTypeCode", "DocumentTypeShortName", "DocumentTypeDisplayName", "DocumentTypeGroup", "SalesEmployeeOrBuyerNumber", "SalesEmployeeOrBuyerName", "EmployeeIsActive", "UserCode", "UserName", "EmployeeBranch", "EmployeeDepartment", "Manager", "BusinessPartnerCode", "BusinessPartnerName", "BusinessPartnerNameAndCode", "BusinessPartnerType", "BusinessPartnerGroupCode", "BusinessPartnerGroupName", "IndustryName", "IndustryDescription", "BusinessPartnerIsActive", "IsCompanyOrPrivate", "DunningTermCode", "DunningTermName", "PaymentMethodCode", "BusinessPartnerCurrency", "BusinessPartnerTerritory", "BillToOrPayToStreet", "FederalTaxID", "MailCountry", "BillToOrPayToCity", "BillToOrPayToCountry", "AdditionalID", "WithholdingTaxCode", "UnifiedFederalTaxID", "ResidenceNumberType", "WarehouseCode", "WarehouseName", "WarehouseNameAndCode", "WarehouseBranchCode", "WarehouseBranchName", "WarehouseLocation", "WarehouseIsActive", "IsDropShipWarehouse", "IsNettableWarehouse", "WarehouseCountry", "Warehouse_FederalTaxID", "BinLocationIsEnabled", "WarehouseDefaultBinLocation", "ProjectCode", "ProjectName", "ProjectNameAndCode", "ProjectIsActive", "ItemCode", "ItemDescription", "ItemDescriptionAndCode", "ItemGroup", "ItemType", "InventoryValuationMethod", "IsInventoryItem", "IsSalesItem", "IsPurchaseItem", "UoMGroup", "ItemShippingType", "ItemIsActive", "InventoryUoMName", "ItemManufacturer", "DefaultPreferredVendor", "InventoryIsManagedByWarehouse", "CompanyRequiredItemQuantity", "CompanyMinimumItemQuantity", "CompanyMaximumItemQuantity" FROM "_SYS_BIC"."sap.sbodemoru.ap.doc/APInvoiceDetailQuery" GROUP BY "DocumentNumber", "LineStatus", "Owner", "DocumentRowNumber", "ShippingType", "UoMCode", "UnitPrice", "UnitPriceLC", "GrossUnitPriceLC", "LineExchangeRate", "PriceCurrency", "LineDeliveryDate", "PostingDate", "PostingYear", "PostingQuarter", "PostingMonth", "PostingWeek", "DueDate", "DueYear", "DueQuarter", "DueMonth", "DueWeek", "DocumentDate", "DocumentYear", "DocumentQuarter", "DocumentMonth", "DocumentWeek", "DocumentTypeCode", "DocumentTypeShortName", "DocumentTypeDisplayName", "DocumentTypeGroup", "SalesEmployeeOrBuyerNumber", "SalesEmployeeOrBuyerName", "EmployeeIsActive", "UserCode", "UserName", "EmployeeBranch", "EmployeeDepartment", "Manager", "BusinessPartnerCode", "BusinessPartnerName", "BusinessPartnerNameAndCode", "BusinessPartnerType", "BusinessPartnerGroupCode", "BusinessPartnerGroupName", "IndustryName", "IndustryDescription", "BusinessPartnerIsActive", "IsCompanyOrPrivate", "DunningTermCode", "DunningTermName", "PaymentMethodCode", "BusinessPartnerCurrency", "BusinessPartnerTerritory", "BillToOrPayToStreet", "FederalTaxID", "MailCountry", "BillToOrPayToCity", "BillToOrPayToCountry", "AdditionalID", "WithholdingTaxCode", "UnifiedFederalTaxID", "ResidenceNumberType", "WarehouseCode", "WarehouseName", "WarehouseNameAndCode", "WarehouseBranchCode", "WarehouseBranchName", "WarehouseLocation", "WarehouseIsActive", "IsDropShipWarehouse", "IsNettableWarehouse", "WarehouseCountry", "Warehouse_FederalTaxID", "BinLocationIsEnabled", "WarehouseDefaultBinLocation", "ProjectCode", "ProjectName", "ProjectNameAndCode", "ProjectIsActive", "ItemCode", "ItemDescription", "ItemDescriptionAndCode", "ItemGroup", "ItemType", "InventoryValuationMethod", "IsInventoryItem", "IsSalesItem", "IsPurchaseItem", "UoMGroup", "ItemShippingType", "ItemIsActive", "InventoryUoMName", "ItemManufacturer", "DefaultPreferredVendor", "InventoryIsManagedByWarehouse", "CompanyRequiredItemQuantity", "CompanyMinimumItemQuantity", "CompanyMaximumItemQuantity" The graphic query data is stored in the so-called calculation view. Next, we can use the created calculation view for use in SAP Business One.
By default, SAP Business One already contains various calculation views.
New user desktop
Fiori Style SAP Business One Desktop
The new Fiori style control panel is a user desktop with interactive features written in SAPUI5 (HTML5). On the control panel can accommodate various objects. We can control the size of objects, their position on the desktop. Objects automatically update the data (you can adjust the schedule) - so you are always up to date with the latest information on the activities of the company.
KPIs
This element is responsible for tracking and calculating the goal. You can set the color gradation of the percentage of completion, set the tracking dynamics (year to year, month by month, etc.).
Process map
SAP Business One by default includes 4 process maps: Sales, Purchasing, Stocks, and Finance. The process map is a tool to which the main elements of ERP (documents, reports) are derived with the routing of the necessary steps (workflow). The company can customize the appearance of such cards, add or remove necessary objects on or from the map.
Map of the sales process with a list of sales reports disclosed
Object count
From the name it is clear that this element counts the number of specified objects (based on the SQL query to the database). There are many uses. For example, the number of open sales documents
The object counter is created based on the SQL query:
Toolbars (dashboards)
Dashboards, or dashboards, allow you to display the necessary data in dynamics, along several axes. There are many options for data visualization: chart type, display period, strategy (forecast, ABC analysis, etc.).
Analytics Tools in SAP Business ONE
SAP Business One is an ERP with great analytics potential. The in-memory platform and the available data processing tools allow you to get any information from the system as soon as possible.
End-to-end analytics
In the starting version there are more than 90 elements (KPIs, toolbars, counters, etc.) that can be placed on the user's desktop. But what to do if embedded KPIs or toolbars are not enough? For such cases, there is a tool "End-to-End Analytics". It allows you to create your own KPIs, toolbars and advanced toolbars. It is also possible to change the view and / or strategy of displaying data, assign actions to the right mouse click on the panel, or bind the toolbar to various objects (windows) in the system.
Let's build a dashboard based on the “Sales data” calculation view already familiar to us. To do this, in the Through Analytics tool, select the Panel Designer, determine the calculation angle, and a “designer” opens before us.
Dashboard Designer in End-to-End Analytics Tool
By dragging and dropping objects from the left pane into the target parameters windows, we can build the toolbar we need. In the example below, the analysis of gross profit by product groups for the first and second quarters of the current year:
You can add various actions for the toolbar. For example, a panel can be associated with various objects (basic data or a document). Choose a master data card of the business partner (counterparty). Also assign an enterprise search action to the object. Save the created panel and place it on the desktop. If we right-click on one of the columns of the created panel, we will see the available action “Search”.
Created dashboard Profit by product group on the desktop
When you open the business partner's master data object, we will see the attached dashboard. In this case, the data in this diagram will be limited to the information that is associated with this particular business partner.
Business partner card with side toolbar
Corporate search
The SAP HANA chip that is actively used in SAP Business One is a quick search across all objects in the system with the ability to customize search settings and filter results by object type. A preview of the document in the search results is available.
Cash Flow Forecast tool
The Cash Flow Forecast tool allows you to visualize cash flow data.
Using the "Configuration" window, you can customize forecasting scenarios by including or excluding various criteria for selecting objects. By narrowing the timing of displaying information, you can detail the data up to the day After clicking on the data column, incoming or outgoing operations are displayed in a table.
Supply Schedule Management Tool
"Manage the supply schedule" - a tool that allows you to manage the schedule of one or more shipments in one window.
Product Availability Check (ATP) tool
This tool offers a graphical interface for product availability graphics. Everything is simple here: we drive in the necessary goods, the quantity of goods and the warehouse.
From the results it can be seen that the required item S10000 in the amount of 10 pieces will be available on March 13. March 18 is expected to deliver another batch of this product.
Intellectual Prediction Tool
In SAP Business One, there are two tools for forecasting the consumption of materials that can be used in the MRP Assistant to generate documents on stock transfers, purchasing, production. The “Baseline Forecast” takes into account historical data for the “simple average” model. “Intellectual forecast” is statistical forecasting based on embedded models, taking into account trends and seasonal factors: TESM (triple exponential smoothing) or LRDTSA (linear regression with a damped trend and seasonal component). SAP Business One automatically selects the best predictive prediction algorithm, and there is always the option of manually selecting a prediction model. There is a possibility of retrospective analysis to check the correctness of the intellectual forecast.
Tool "Sales Recommendation"
When you select a customer in sales documents, SAP Business One automatically lists the most frequently purchased items that are relevant to that customer. The bottom of the “Sales recommendation” window is activated after adding at least one product to the document and displays the list “With this product is also bought”.
Excel Reports and Interactive Analysis tool
We are sure that many readers keep in mind the question: what about Excel? This tool for working with tables in many companies is used as ERP. Some companies grow to full-fledged ERP-solutions, but the habit and desire to work with tables does not disappear anywhere. Our solution is integrated with Excel, so amateurs and professionals can use all its power to analyze data and prepare reports. Solution users who have sufficient authority in terms of authorization rights can create reports in Excel and import them into SAP Business One. During the product installation process, you will be prompted to install add-ins for Excel. Now the user can open Excel and work with data from the company database. If desired, you can create a report table with the necessary data and import it into SAP Business One. Further this report can be used by all employees of the company.
The Excel Reports and Interactive Analysis module is available in the standard configuration of SAP Business One. Module one, and tools, in fact, two.
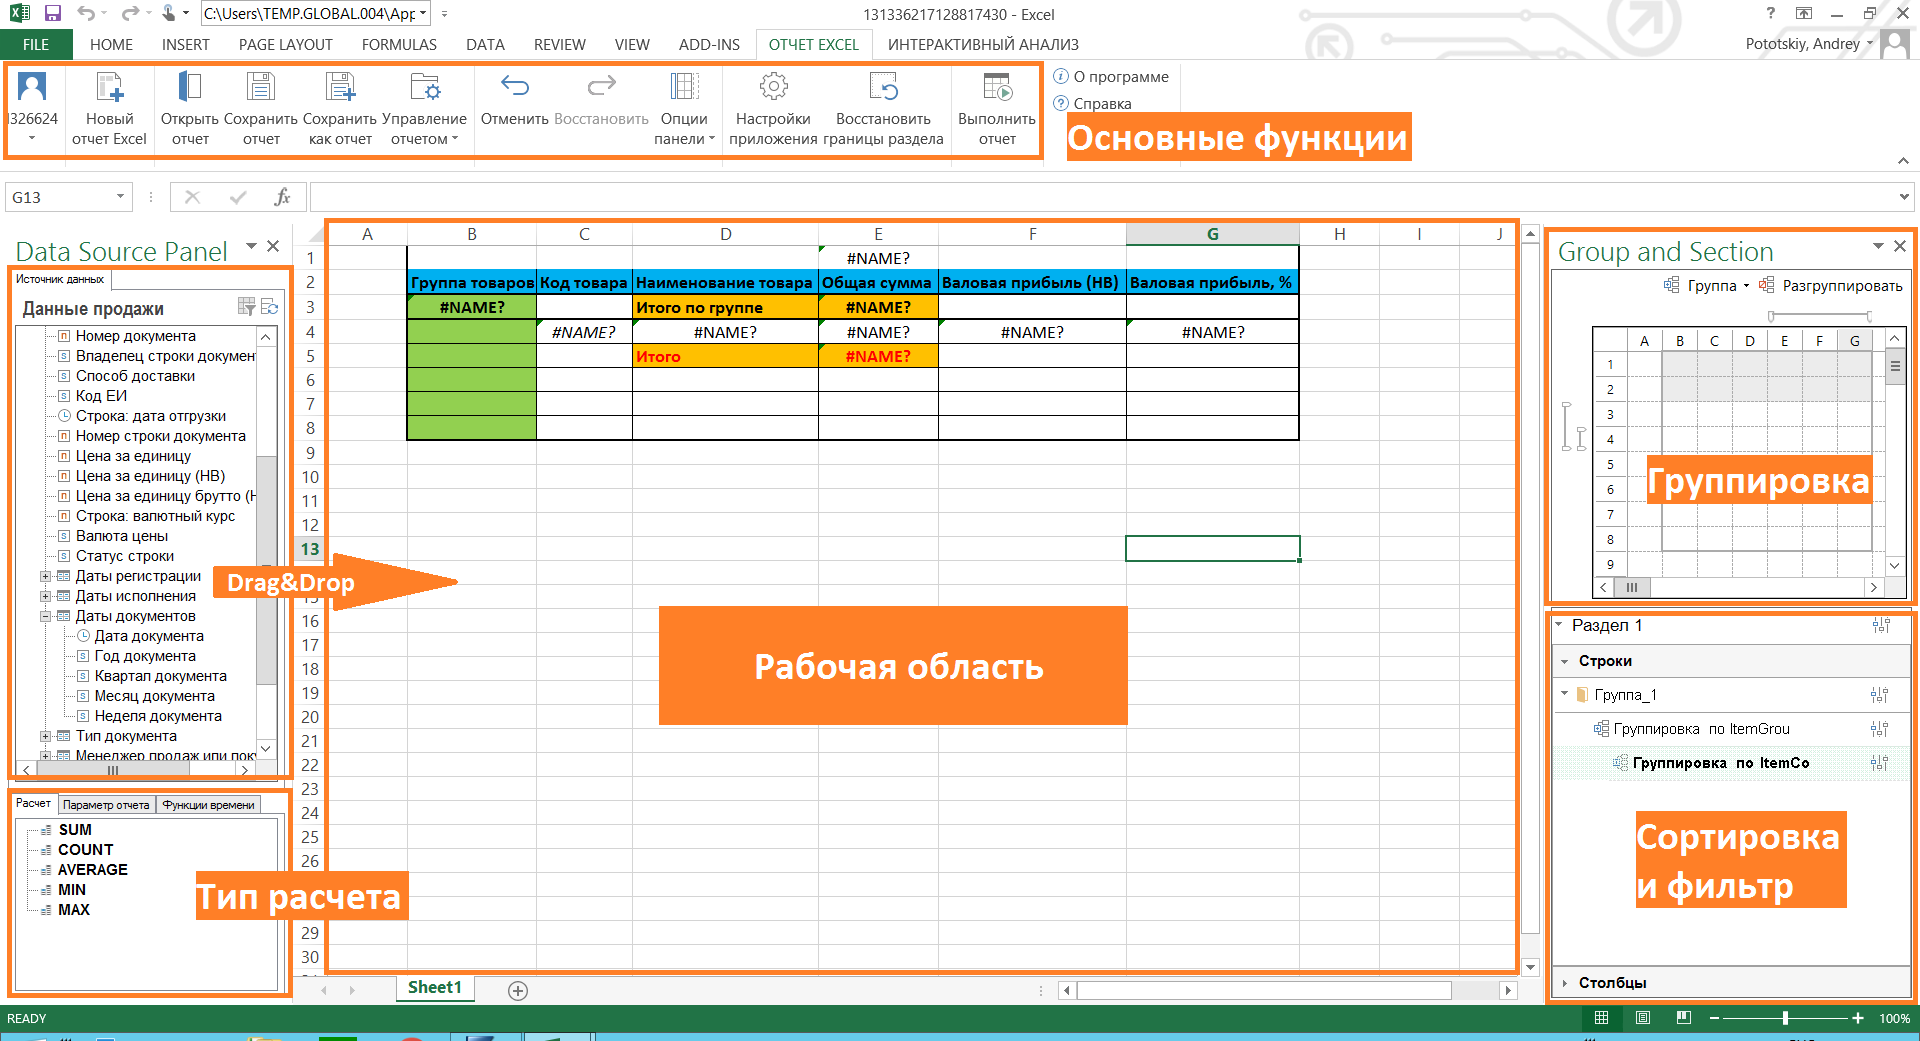
1. Excel reports
All existing calculation angles (we considered them at the beginning of the review) are available in Excel. For example, create a report based on the view known to us Sales data.
By simply dragging the data of interest to us into the workspace, we create a report template:
1. In the "Grouping" area, set the grouping by product code.
2. In the "Sort and Filter" area, set up an ascending sorting for the "Item Name" column.
3. In the "Total group" and "Total" fields, drag the type of calculation from the corresponding field.
4. Add a simple calculation to the cell G4 = F4 / E4.
5. We divide the display of data by quarters of documents.
6. We direct the beauty with the help of the built-in Excel tools: draw the borders of the cells, add conditional formatting, limit the number of decimal places.
Click "Run report" in the "Basic Functions" section and enjoy our report!
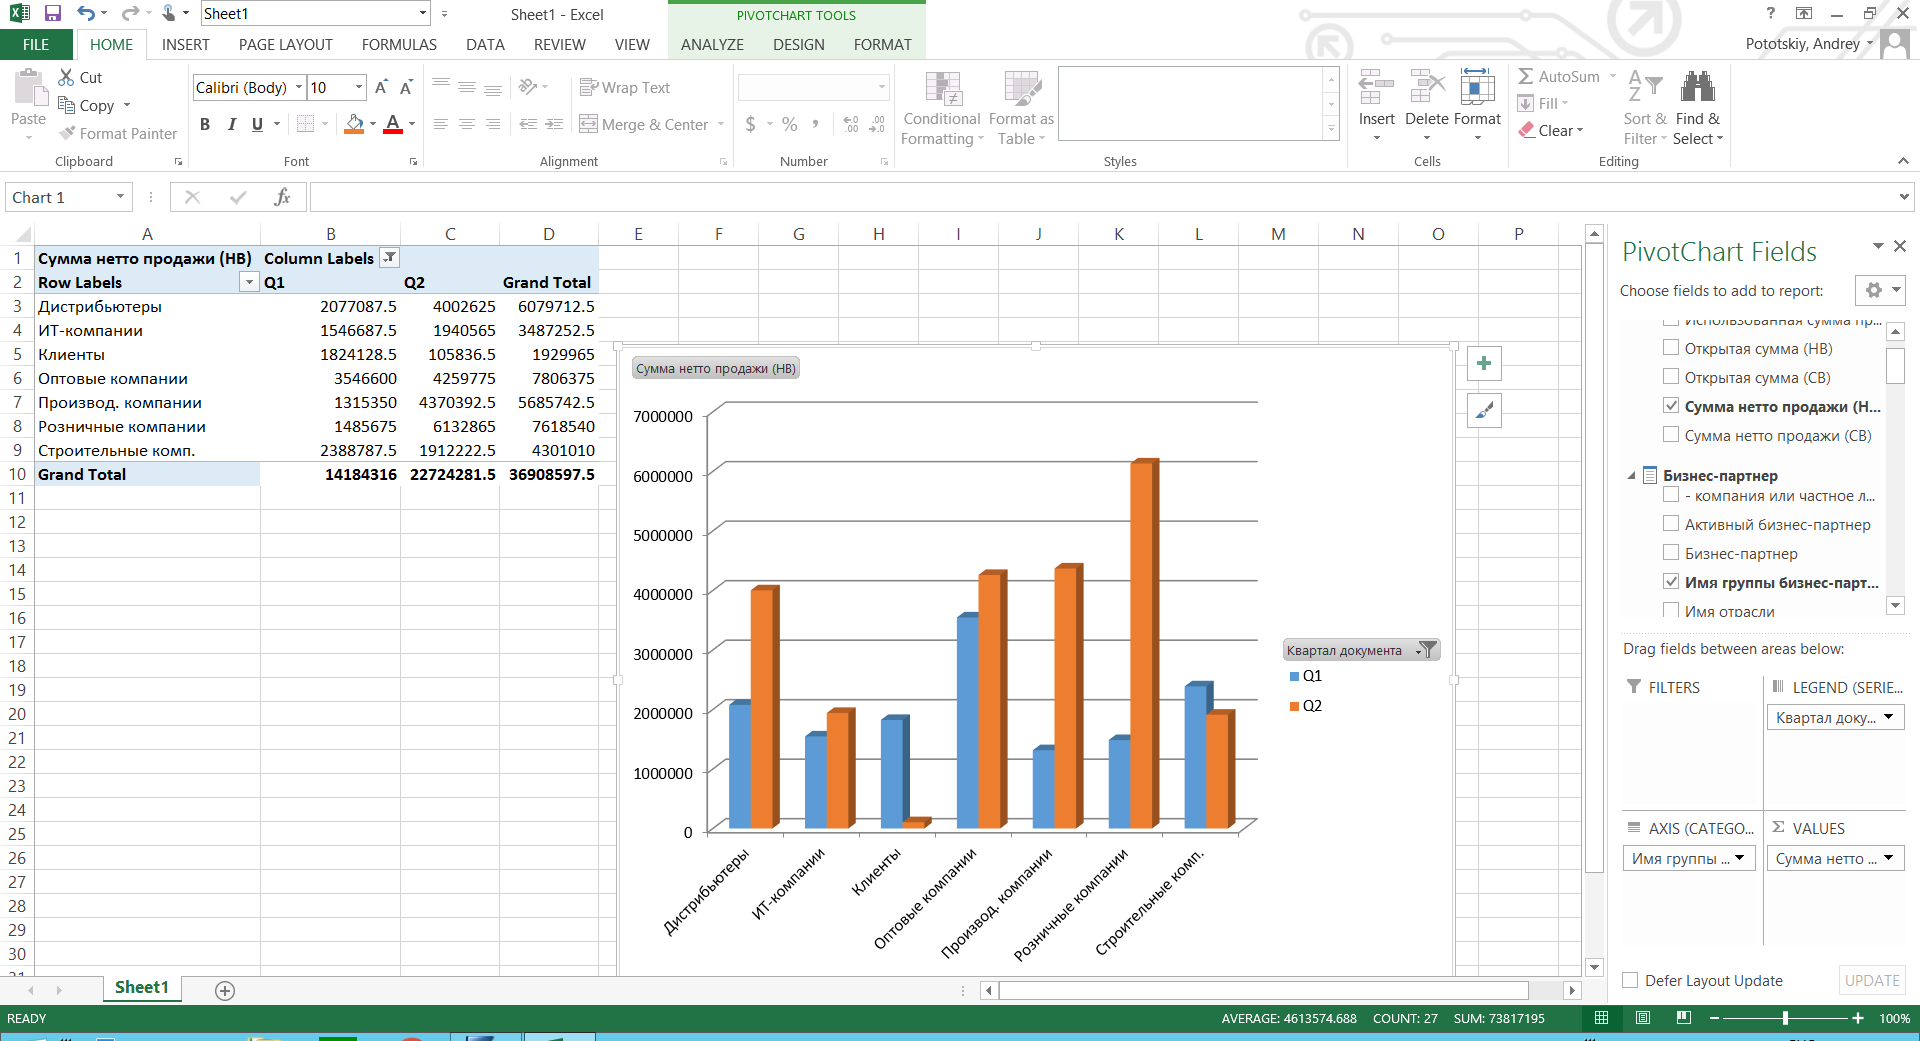
2. Interactive analysis
For data analysis using Excel spreadsheets, the Interactive Analysis tool is used, which allows you to upload the calculation view from the system as a pivot table. You can create your own report template using the same add-in in Excel.
Mobile applications
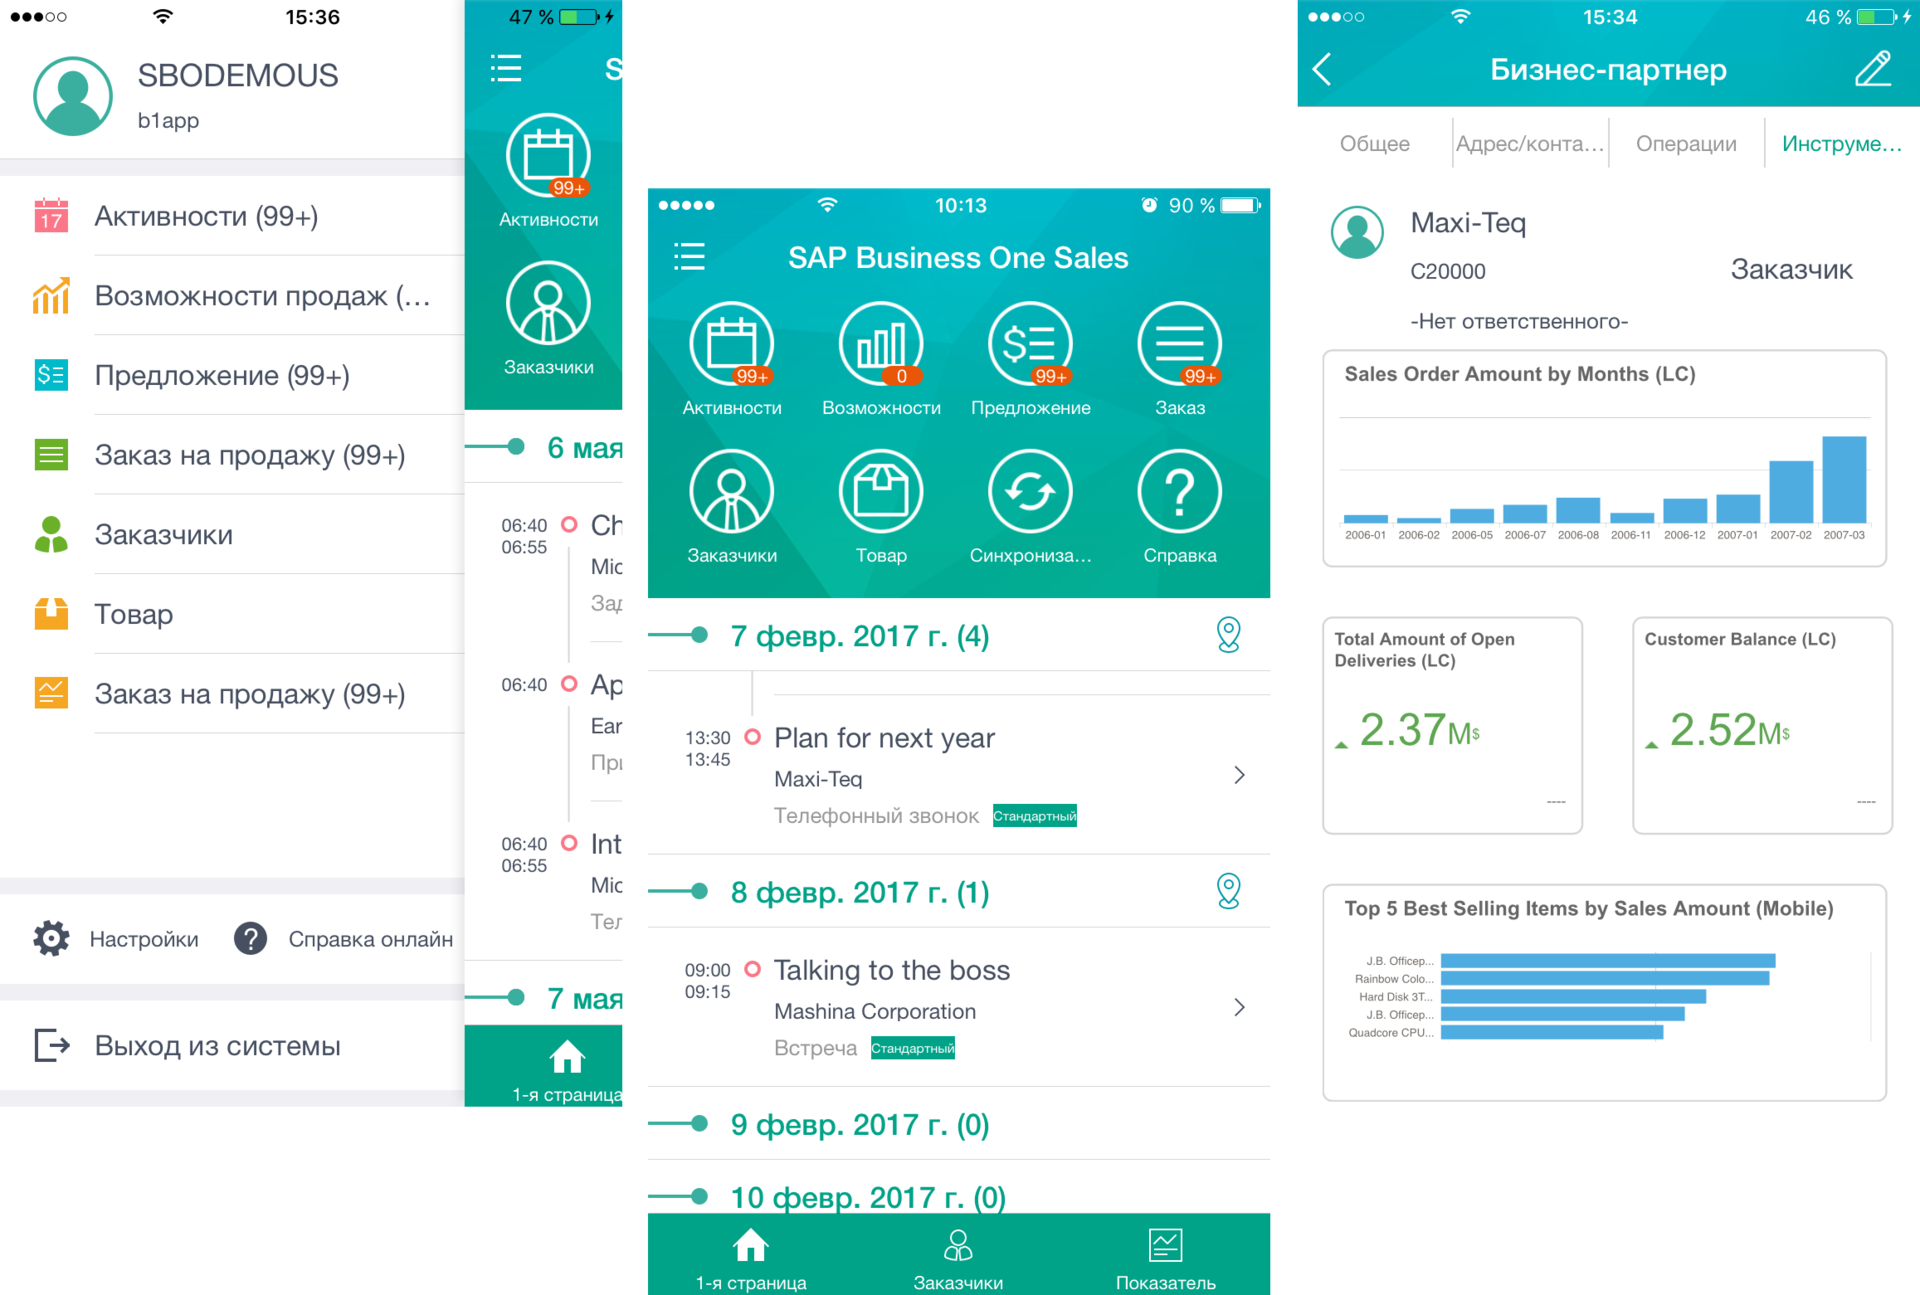
SAP HANA is not only analytics, but also a development platform. Products developed on the SAP HANA platform, using built-in tools by default, are adapted for browsers and mobile applications. A prime example of such applications is the SAP Business One Sales app.
The application is designed for employees of sales departments working in the field. On the screen of a smartphone with iOS or Android, all the necessary functionality for such specialists is available: access to the calendar, work with a sales funnel, a catalog of goods and services, creating and editing sales documents, and analytics. The application is available for download in the Apple App Store and Google Play. After downloading, users can connect to the SAP test server for free.
As a conclusion
The SAP HANA platform opens up opportunities for building analytics, forecasts and developing your own software products. The SAP Business One solution, using the capabilities of this platform, allows small and medium-sized businesses to already use the advanced technologies of this platform in order to gain and retain leading positions in their industry.
You can get acquainted with examples of SAP Business One implementations on our website www.sapb1repository.com . Video with reviews of the solution capabilities and not only available on our YouTube channel www.youtube.com/user/businessonesap/featured
Comment, share your impressions and ask questions.
In the next article about SAP Business One, we will look at the use of the solution in various integration scenarios in detail.
Thank you all for reading and feedback!
Source: https://habr.com/ru/post/324966/
All Articles