Everything you wanted to know about stack traces and hip dumps. Part 1
Practice has shown that hardcore transcripts from our reports come in well, so we decided to continue. Today we have a mix of approaches to searching and analyzing errors and crashes in the menu, seasoned with a pinch of useful tools, prepared on the basis of a report by Andrey Pangin aka apangin from Odnoklassniki on one of the JUGs (this was a finished version of his report from JPoint 2016). In the seven-minute, two-hour report, Andrew talks in detail about stack traces and hip dumps.
The post turned out just huge, so we broke it into two parts. Now you are reading the first part, the second part is here .
')
Today I will talk about stack-traces and hip-dumps - a theme, on the one hand, known to everyone, on the other - allowing you to constantly open something new (I even found the bug in the JVM while I was preparing this topic).
When I did a training run of this report in our office, one of my colleagues asked: “Is this all very interesting, but in practice is it useful for anyone?” After this conversation, I added a page with questions on the topic to my presentation in my first presentation. Stackoverflow. So this is relevant.

I myself work as a lead programmer at Odnoklassniki. And it so happened that often I have to work with the guts of Java - tyunit it, look for bugs, pull something through system classes (sometimes not in completely legal ways). From there I gathered most of the information I wanted to present to you today. Of course, my previous experience helped me a lot with this: I worked for 6 years at Sun Microsystems, was directly involved in developing a Java virtual machine. So now I know this topic from the inside of the JVM, as well as from the part of the user developer.
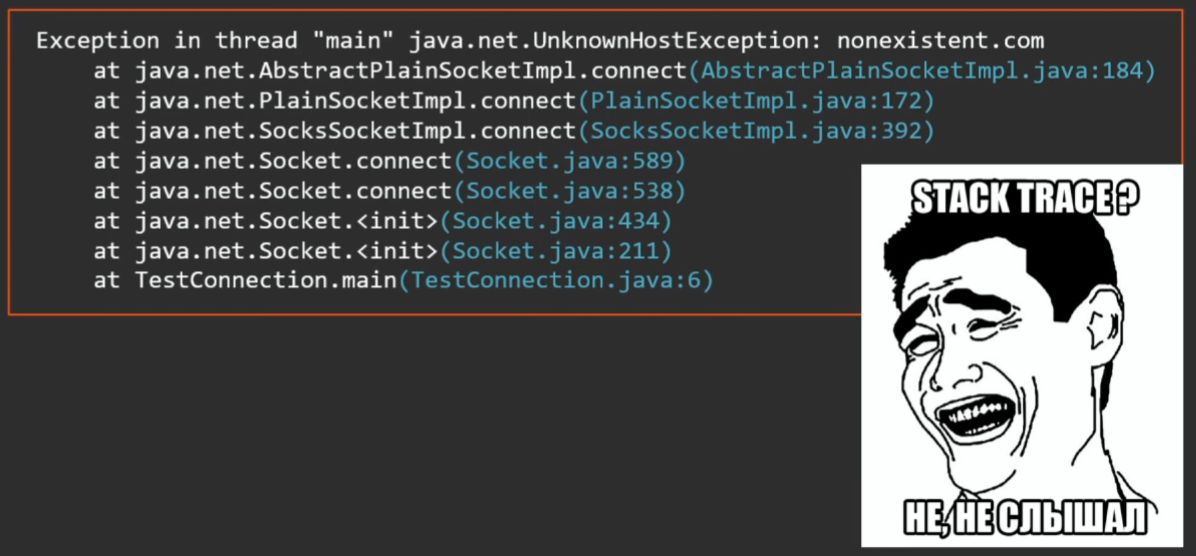
When a novice developer writes his “Hello world!”, He jumps out with an exception and shows him the stack-trace where this error occurred. So the majority have some ideas about stack-traces.
Let's go straight to the examples.
I wrote a small program that, in a cycle 100 million times, performs such an experiment: it creates an array of 10 random elements of type long and checks whether it is sorted or not.
In fact, he considers the probability of obtaining a sorted array, which is approximately equal to
What will happen? Exception, out of bounds array.
Let's figure out what's wrong. Our console displays:
but there is no stack of traces. Where are you?
In HotSpot JVM there is such an optimization: execs that are thrown by the JVM itself from a hot code, and in this case the code is hot - it jerks 100 million times, stack-traces are not generated.
This can be fixed with the help of a special key:
Now let's try to run an example. We get all the same, only all stack traces are in place.
This optimization works for all implicit exceptions that are thrown by the JVM: going beyond the bounds of the array, dereferencing the null pointer, etc.
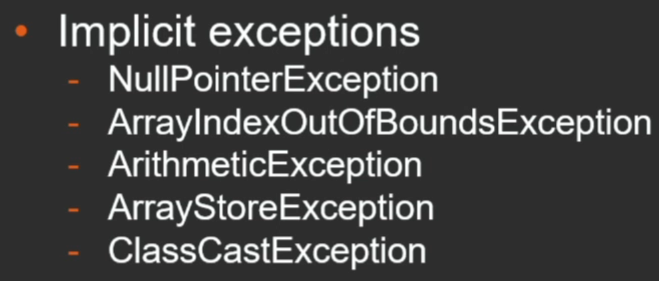
Once the optimization was invented, then it is for some reason needed? It is clear that it is more convenient for a programmer when there are stack-traces.
Let's measure how much "costs" we have to create an exception (compare with some simple Java object, like Date).
With the help of JMH, we write a simple benchmark and measure how many nanoseconds both operations take.

It turns out that creating an event is 150 times more expensive than a regular object.
And here is not so simple. For a virtual machine, the event is no different from any other object, but the answer lies in the fact that almost all the constructors are somehow reduced to calling the fillInStackTrace method, which fills the stack trace of this event. Filling a stack trail takes time.
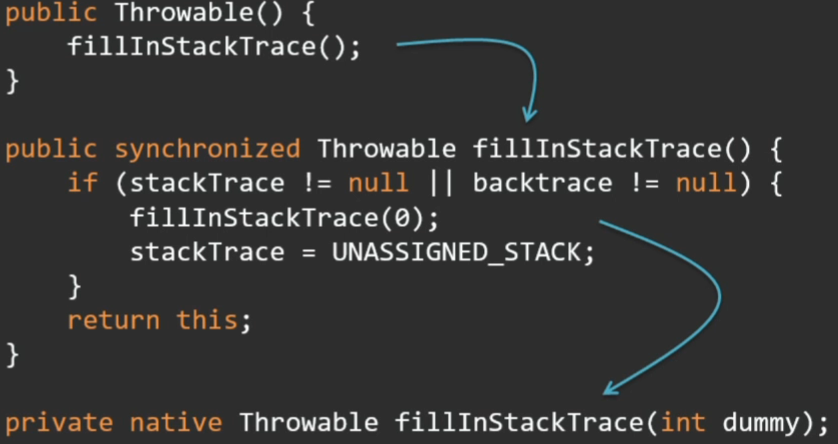
This method, in turn, is native, it drops into the VM runtime and there it walks along the stack, gathers all the frames.
The fillInStackTrace method is public, not final. Let's just redefine it:
Now the creation of a regular object and an escape without a stack trace takes the same time.

There is another way to create an exception without a stack trace. Starting with Java 7, Throwable and Exception have a protected constructor with the additional parameter writableStackTrace:
If you pass false there, the stack trace will not be generated, and the creation of the exception will be very fast.
Why do we need exceptions without stack-traces? For example, if the event is used in the code as a way to quickly get out of the loop. Of course, it’s better not to do that, but there are times when it really gives a performance boost.
And how much does it cost to throw an eksepshn
Consider different cases: when he rushes and is caught in the same method, as well as situations with different stack depths.
This is what measurements give:

Those. if we have a small depth (the exception is caught in the same frame or frame higher - the depth is 0 or 1), the exception is worth nothing. But as soon as the stack depth becomes large, the costs are of a completely different order. At the same time, there is a clear linear relationship: the “cost” of the exclusion almost linearly depends on the stack depth.
Not only is getting the stack trace expensive, but also further manipulations — printing, sending over the network, writing — everything that is used by the getStackTrace method, which translates the saved stack trace into Java objects.
It can be seen that the conversion of the stack-trace is 10 times "more expensive" to obtain it:

Why is this happening?
Here is the getStackTrace method in the JDK sources:
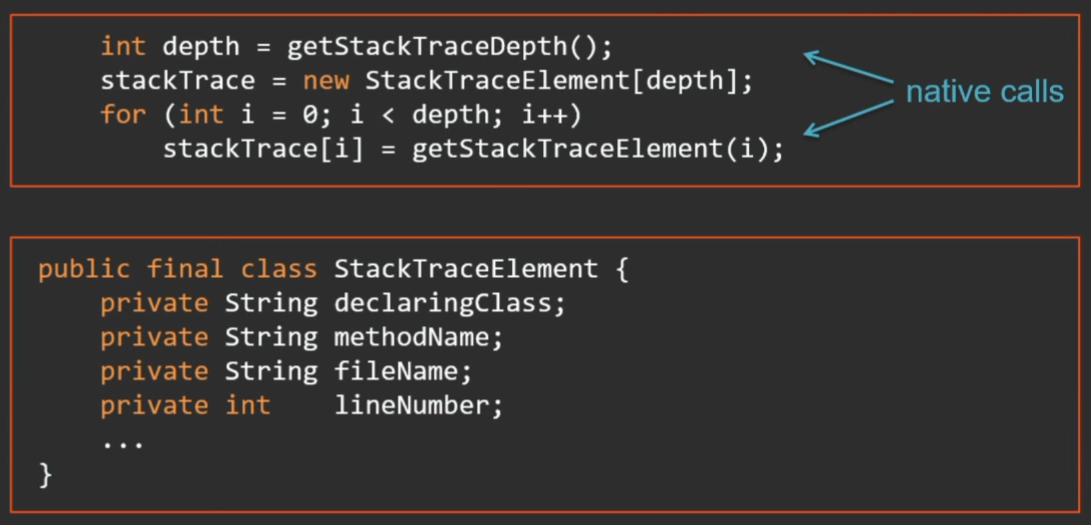
First, by calling the native method, we learn the stack depth, then, in a loop to this depth, we call the native method to get the next frame and convert it into a StackTraceElement object (this is a normal Java object with a bunch of fields). Not only is it a long time, the procedure takes a lot of memory.
Moreover, in Java 9 this object is supplemented with new fields (in connection with the well-known project of modularization) - now each frame is assigned a mark about which module it is from.
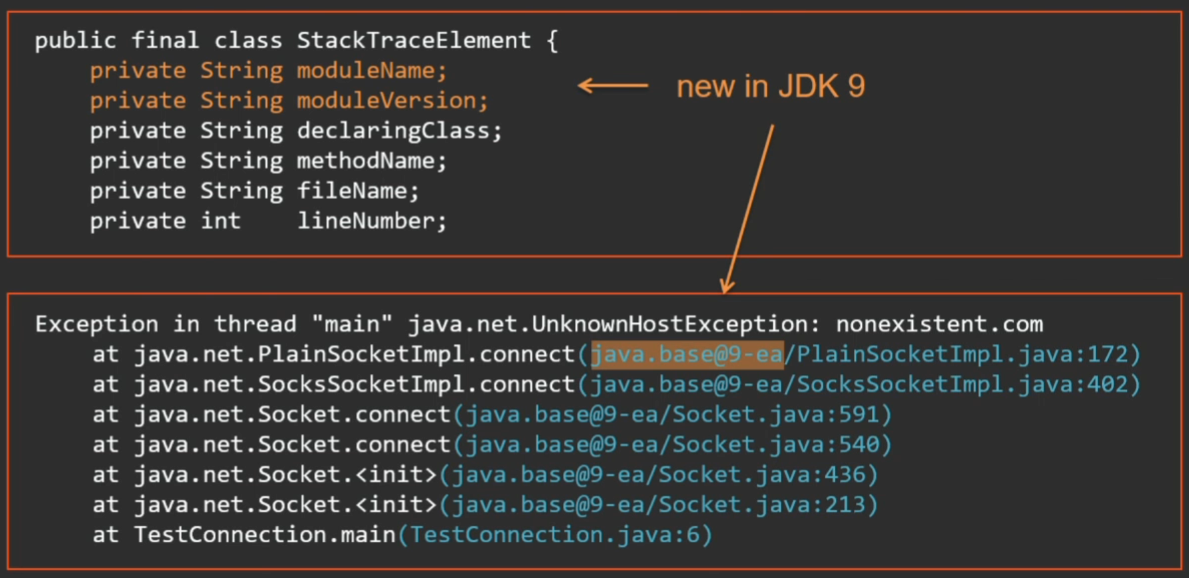
Hello to those who parse exepsy using regular expressions. Get ready for surprises in Java 9 - there will be more modules.
To find out what the program does, the easiest way is to take a thread dump, for example, with the jstack utility.
Fragments of the output of this utility:

What is seen here? What are the threads, the state in which they are and their current stack.
Moreover, if the threads captured some locks, expect to enter a synchronized section or take a ReentrantLock, this will also be reflected in the stack trace.
Sometimes a little-known identifier is useful:

It is directly related to the thread ID in the operating system. For example, if you watch the top program in Linux, which threads you have the most CPU eat, the pid of the stream is the very nid that is shown in the thread dump. You can immediately find which Java stream it corresponds to.
In the case of monitors (with synchronized objects), it will be written directly in the thread dump which thread and which monitors are holding, who is trying to capture them.
In the case of ReentrantLock, this is unfortunately not the case. Here you can see how Thread 1 is trying to capture some ReentrantLock, but at the same time it is not visible who is holding this lock. In this case, the VM has an option:
If we run the same with PrintConcurrentLocks, we will see ReentrantLock in the thread dump.
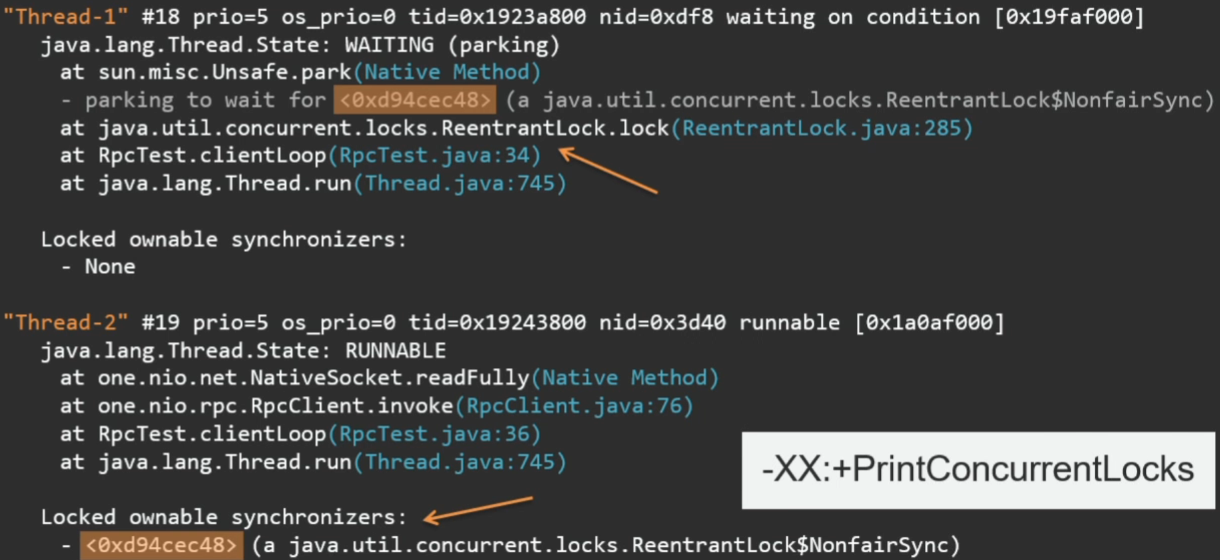
Here is the id of the lock. It can be seen that it captured Thread 2.
If the option is so good, why not make it "default"?
She, too, is worth something. To print information about which stream keeps ReentrantLock'i, the JVM runs through the entire Java heap, searches all ReentrantLock'i, compares them with threads, and only then displays this information (the thread has no information about which locks it has captured; information is only in the opposite direction - which lock is associated with which thread).
In this example, the names of threads (Thread 1 / Thread 2) do not understand what they refer to. My advice from practice: if you have a long operation, for example, the server handles client requests or, conversely, the client goes to several servers, set a clear name for the thread (as in the case below, directly the IP of the server to which the client now is coming). And then in the stream dump you will immediately see the answer from which server it is waiting for.

Enough theory. Let's go to practice again. I have already cited this example more than once.
Run the program 3 times in a row. 2 times it displays the sum of numbers from 0 to 100 (not including 100), the third one does not want. Let's watch the thread dumps:

The first thread is RUNNABLE, our reduce executes. But look, what an interesting point: Thread.State seems to be like RUNNABLE, but it says that the flow is in Object.wait ().

I, too, it was not clear. I even wanted to report a bug, but it turns out that such a bug was introduced many years ago and closed with the wording: “not an issue, will not fix”.
In this program there really is a deadlock. Its reason is class initialization .
The expression is executed in the static initializer of the ParallelSum class:
But since the stream is parallel, execution occurs in separate threads of the ForkJoinPool, from which the lambda body is called:
The lambda code is written by the Java compiler directly into the ParallelSum class as a private method. It turns out that from ForkJoinPool we are trying to refer to the ParallelSum class, which is currently at the initialization stage. Therefore, the threads begin to wait for the class to initialize, but it cannot end, because it is waiting for the computation of this convolution itself. Dedlock.
Why at first was the sum counted? It was just luck. We have a small number of elements summed up, and sometimes everything is executed in one stream (another stream just does not have time).
But why then is the thread in the stack trace RUNNABLE? If you read the documentation for Thread.State, it becomes clear that there can be no other state here. There cannot be a BLOCKED state, because the stream is not blocked on the Java monitor, there is no synchronized section, and there can be no WAITING state, because there are no Object.wait () calls here. Synchronization occurs on the internal object of the virtual machine, which, generally speaking, does not even have to be a Java object.
Imagine a situation: in a heap of places in our application something is logged. It would be useful to know from which place one or another line appeared.

In Java, there is no preprocessor, so there is no possibility to use macros __ FILE__, __LINE__, as in C (these macros are converted at the compilation stage to the current file name and string). Therefore, there are no other ways to supplement the output with the file name and line number of the code from where it was printed, except through stack-traces.
We generate an exception, we get a stack-trace from it, in this case we take the second frame (the null one is the getLocation method, and the first one calls the warning method).
As we know, getting a stack-trace and, especially, converting it to stack-trace elements is very expensive. And we need one frame. Is it possible to do something easier (without an exception)?
In addition to getStackTrace, the exception has a Thread object's getStackTrace method.
Will it be faster?

Not. JVM does not do any magic, here everything will work through the same escape with exactly the same stack-trace.
But the tricky way is still there:
I love all kinds of private things: Unsafe, SharedSecrets, etc.
There is an accessor that allows you to get a StackTraceElement of a specific frame (without the need to convert the entire stack-trace into Java objects). It will work faster. But there is bad news: it won't work in Java 9. A lot of work has been done there on refactoring everything related to stack-traces, and now there are simply no such methods.
A design that allows one frame to be obtained may be useful in the so-called Caller-sensitive methods - methods whose result may depend on who calls them. In application programs, such methods are rarely encountered, but there are quite a few such examples in the JDK itself:

Depending on who calls Class.forName, the class will be searched for in the corresponding loader class (the class that called this method); similarly, with obtaining a ResourceBundle and loading the System.loadLibrary library. Information about who calls is also useful when using various methods that check permissions (does this code have the right to call this method). For this case, the getCallerClass method is provided in the “secret” API, which is actually a JVM-intrinsic and costs almost nothing.
As it has been said many times, the private API is an evil that is not recommended to use (you yourself run the risk of running into problems similar to those that Unsafe previously caused). Therefore, JDK developers thought about the fact that once they use it, we need a legal alternative - a new API for bypassing threads. Basic requirements for this API:
It is known that in the public release of Java 9 will be java.lang.StackWalker.
To get an instance of it is very simple - using the getInstance method. It has several options - the default StackWalker or slightly configurable options:

Also, for optimization, you can set the approximate depth that is needed (so that the JVM can optimize the receipt of stack frames in batch).
The simplest example of how to use it:
Take the StackWalker and call the forEach method so that it goes around all the frames. As a result, we get such a simple stack-trace:

The same with the SHOW_REFLECT_FRAMES option:
In this case, methods related to the call through reflex will be added:

If you add the SHOW_HIDDEN_FRAMES option (by the way, it includes SHOW_REFLECT_FRAMES, that is, reflection frames will also be shown):
The methods of dynamically generated lambda classes will appear in the stack trace:

And now the most important method that is in the StackWalker API is the walk method with such a sly incomprehensible signature with a bunch of generics:
The walk method takes a function from a stack frame.
His work is easier to show by example.
Despite the fact that all this looks scary, how to use it is obvious. Stream is passed to the function, and all the usual operations can be performed over the stream. For example, the getCallerFrame method would look like this, which only gets the second frame: the first 2 are skipped, then findFirst is called:
The walk method returns the result that this stream function returns. It's simple.
For this particular case (when you just need to get the Caller class) there is a special shortcut method:
Another example is more complicated.
We go around all the frames, leaving only those that belong to the org.apache package, and display the first 10 in the list.
An interesting question: why such a long signature with a bunch of generics? Why not just make a method on StackWalker that returns a stream?
If you give an API that returns a stream, the JDK loses control over what is being done on this stream. It is possible to continue this stream somewhere, give it to another thread, try to use it 2 hours after it was received (the stack that we tried to bypass is long lost, and the thread can be killed long ago). Thus, it will be impossible to provide “lazy” Stack Walker API.
The main point of the Stack Walker API is: while you are inside the walk, you have a stack state fixed, so all operations on this stack can be done lazy.
For dessert, a little more interesting.
As always, the JDK developers are hiding a bunch of treasures from us. And besides the usual stack frames, for some of their needs they made live stack frames that differ from the usual ones in that they have additional methods that allow not only to get information about the method and class, but also about local variables, captured monitors and values of expres-stack of the given stack frame.
The protection here is not so hot: the class was simply made non-public. But who prevents us from taking reflexion and trying it? (Note: in current builds of JDK 9, access to a non-public API through reflexion is prohibited. To enable it, you must add the JVM option
We try on such an example. There is a program that is recursively looking for a way out of the maze. We have a square field size x size. There is a visit method with current coordinates. We are trying to go left / right / up / down from the current cell (if they are not busy). If we’ve got from the right-bottom cell to the left-top one, we think that we’ve found a way out and we print out the stack.
Run:
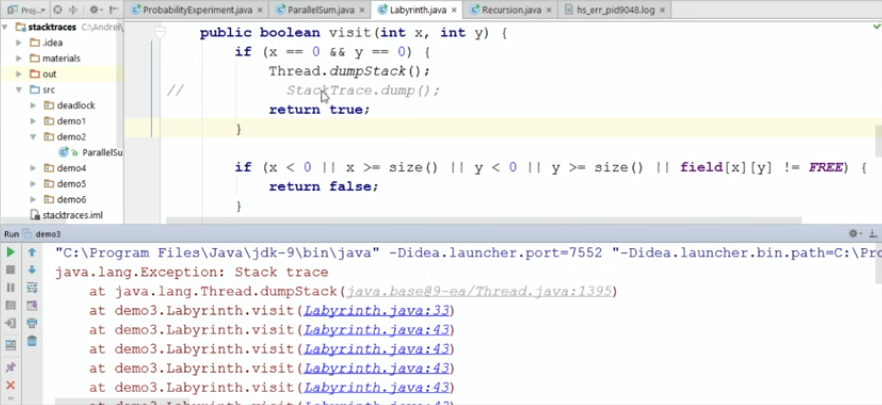
If I do the usual dumpStack, which was still in Java 8, we get the usual stack-trace, from which nothing is clear. Obviously, the recursive method calls itself, but it is interesting at what step (and with what coordinate values) each method is called.
Let's replace the standard dumpStack with our StackTrace.dump, which uses live stack frames through reflection:
StackWalker, getStackWalker. , getStackWalker, -, , , getLocals .
We start. , :

. .
— 7-8 JPoint 2017 . « JVM- », , , . «» , !
, JPoint Java — , .
The post turned out just huge, so we broke it into two parts. Now you are reading the first part, the second part is here .
')
Today I will talk about stack-traces and hip-dumps - a theme, on the one hand, known to everyone, on the other - allowing you to constantly open something new (I even found the bug in the JVM while I was preparing this topic).
When I did a training run of this report in our office, one of my colleagues asked: “Is this all very interesting, but in practice is it useful for anyone?” After this conversation, I added a page with questions on the topic to my presentation in my first presentation. Stackoverflow. So this is relevant.

I myself work as a lead programmer at Odnoklassniki. And it so happened that often I have to work with the guts of Java - tyunit it, look for bugs, pull something through system classes (sometimes not in completely legal ways). From there I gathered most of the information I wanted to present to you today. Of course, my previous experience helped me a lot with this: I worked for 6 years at Sun Microsystems, was directly involved in developing a Java virtual machine. So now I know this topic from the inside of the JVM, as well as from the part of the user developer.
Stack traces
Stack traces exception

When a novice developer writes his “Hello world!”, He jumps out with an exception and shows him the stack-trace where this error occurred. So the majority have some ideas about stack-traces.
Let's go straight to the examples.
I wrote a small program that, in a cycle 100 million times, performs such an experiment: it creates an array of 10 random elements of type long and checks whether it is sorted or not.
package demo1; import java.util.concurrent.ThreadLocalRandom; public class ProbabilityExperiment { private static boolean isSorted(long[] array) { for (int i = 0; i < array.length; i++) { if (array[i] > array[i + 1]) { return false; } } return true; } public void run(int experiments, int length) { int sorted = 0; for (int i = 0; i < experiments; i++) { try { long[] array = ThreadLocalRandom.current().longs(length).toArray(); if (isSorted(array)) { sorted++; } } catch (Exception e) { e.printStackTrace(); } } System.out.printf("%d of %d arrays are sorted\n", sorted, experiments); } public static void main(String[] args) { new ProbabilityExperiment().run(100_000_000, 10); } } In fact, he considers the probability of obtaining a sorted array, which is approximately equal to
1/n! . As is often the case, in the program were wrong on one: for (int i = 0; i < array.length; i++) What will happen? Exception, out of bounds array.
Let's figure out what's wrong. Our console displays:
java.lang.ArrayIndexOutOfBoundsException but there is no stack of traces. Where are you?
In HotSpot JVM there is such an optimization: execs that are thrown by the JVM itself from a hot code, and in this case the code is hot - it jerks 100 million times, stack-traces are not generated.
This can be fixed with the help of a special key:
-XX:-OmitStackTraceInFastThrow Now let's try to run an example. We get all the same, only all stack traces are in place.
This optimization works for all implicit exceptions that are thrown by the JVM: going beyond the bounds of the array, dereferencing the null pointer, etc.
Once the optimization was invented, then it is for some reason needed? It is clear that it is more convenient for a programmer when there are stack-traces.
Let's measure how much "costs" we have to create an exception (compare with some simple Java object, like Date).
@Benchmark public Object date() { return new Date(); } @Benchmark public Object exception() { return new Exception(); } With the help of JMH, we write a simple benchmark and measure how many nanoseconds both operations take.
It turns out that creating an event is 150 times more expensive than a regular object.
And here is not so simple. For a virtual machine, the event is no different from any other object, but the answer lies in the fact that almost all the constructors are somehow reduced to calling the fillInStackTrace method, which fills the stack trace of this event. Filling a stack trail takes time.
This method, in turn, is native, it drops into the VM runtime and there it walks along the stack, gathers all the frames.
The fillInStackTrace method is public, not final. Let's just redefine it:
@Benchmark public Object exceptionNoStackTrace() { return new Exception() { @Override public Throwable fillInStackTrace() { return this; } }; } Now the creation of a regular object and an escape without a stack trace takes the same time.
There is another way to create an exception without a stack trace. Starting with Java 7, Throwable and Exception have a protected constructor with the additional parameter writableStackTrace:
protected Exception(String message, Throwable cause, boolean enableSuppression, boolean writableStackTrace); If you pass false there, the stack trace will not be generated, and the creation of the exception will be very fast.
Why do we need exceptions without stack-traces? For example, if the event is used in the code as a way to quickly get out of the loop. Of course, it’s better not to do that, but there are times when it really gives a performance boost.
And how much does it cost to throw an eksepshn
Consider different cases: when he rushes and is caught in the same method, as well as situations with different stack depths.
@Param("1", "2", "10", "100", "1000"}) int depth; @Benchmark public Object throwCatch() { try { return recursive(depth); } catch (Exception e) { return e; } } This is what measurements give:
Those. if we have a small depth (the exception is caught in the same frame or frame higher - the depth is 0 or 1), the exception is worth nothing. But as soon as the stack depth becomes large, the costs are of a completely different order. At the same time, there is a clear linear relationship: the “cost” of the exclusion almost linearly depends on the stack depth.
Not only is getting the stack trace expensive, but also further manipulations — printing, sending over the network, writing — everything that is used by the getStackTrace method, which translates the saved stack trace into Java objects.
@Benchmark public Object fillInStackTrace() { return new Exception(); } @Benchmark public Object getStackTrace() { return new Exception().getStackTrace(); } It can be seen that the conversion of the stack-trace is 10 times "more expensive" to obtain it:
Why is this happening?
Here is the getStackTrace method in the JDK sources:
First, by calling the native method, we learn the stack depth, then, in a loop to this depth, we call the native method to get the next frame and convert it into a StackTraceElement object (this is a normal Java object with a bunch of fields). Not only is it a long time, the procedure takes a lot of memory.
Moreover, in Java 9 this object is supplemented with new fields (in connection with the well-known project of modularization) - now each frame is assigned a mark about which module it is from.
Hello to those who parse exepsy using regular expressions. Get ready for surprises in Java 9 - there will be more modules.
Let's summarize
- the creation of the object itself is cheap;
- it takes time to get his stack trace;
- even more expensive is the conversion of this internal stack trace to a Java object in StackTraceElement. The complexity of this case is directly proportional to the depth of the stack.
- throwing an escape is quick, it costs almost nothing (almost like an unconditional transition),
- but only if the event is caught in the same frame. Here it is necessary to add that JIT can inline methods, so one compiled frame can include several Java methods that are inline with each other. But if an exception is caught somewhere deeper in a stack, its high cost is proportional to the depth of the stack.
A couple of tips:
- disable optimization on production, perhaps it will save a lot of debugging time:
-XX:-OmitStackTraceInFastThrow
- Do not use exceptions to control the flow of a program; this is considered not very good practice;
- but if you still resort to this method, make sure that exams are fast and do not create stack-traces once again.
Stack traces in thread dumps
To find out what the program does, the easiest way is to take a thread dump, for example, with the jstack utility.
Fragments of the output of this utility:
What is seen here? What are the threads, the state in which they are and their current stack.
Moreover, if the threads captured some locks, expect to enter a synchronized section or take a ReentrantLock, this will also be reflected in the stack trace.
Sometimes a little-known identifier is useful:
It is directly related to the thread ID in the operating system. For example, if you watch the top program in Linux, which threads you have the most CPU eat, the pid of the stream is the very nid that is shown in the thread dump. You can immediately find which Java stream it corresponds to.
In the case of monitors (with synchronized objects), it will be written directly in the thread dump which thread and which monitors are holding, who is trying to capture them.
In the case of ReentrantLock, this is unfortunately not the case. Here you can see how Thread 1 is trying to capture some ReentrantLock, but at the same time it is not visible who is holding this lock. In this case, the VM has an option:
-XX:+PrintConcurrentLocks If we run the same with PrintConcurrentLocks, we will see ReentrantLock in the thread dump.
Here is the id of the lock. It can be seen that it captured Thread 2.
If the option is so good, why not make it "default"?
She, too, is worth something. To print information about which stream keeps ReentrantLock'i, the JVM runs through the entire Java heap, searches all ReentrantLock'i, compares them with threads, and only then displays this information (the thread has no information about which locks it has captured; information is only in the opposite direction - which lock is associated with which thread).
In this example, the names of threads (Thread 1 / Thread 2) do not understand what they refer to. My advice from practice: if you have a long operation, for example, the server handles client requests or, conversely, the client goes to several servers, set a clear name for the thread (as in the case below, directly the IP of the server to which the client now is coming). And then in the stream dump you will immediately see the answer from which server it is waiting for.
Enough theory. Let's go to practice again. I have already cited this example more than once.
package demo2; import java.util.stream.IntStream; public class ParallelSum { static int SUM = IntStream.range(0, 100).parallel().reduce(0, (x, y) -> x + y); public static void main(String[] args) { System.out.println(SUM); } } Run the program 3 times in a row. 2 times it displays the sum of numbers from 0 to 100 (not including 100), the third one does not want. Let's watch the thread dumps:
The first thread is RUNNABLE, our reduce executes. But look, what an interesting point: Thread.State seems to be like RUNNABLE, but it says that the flow is in Object.wait ().
I, too, it was not clear. I even wanted to report a bug, but it turns out that such a bug was introduced many years ago and closed with the wording: “not an issue, will not fix”.
In this program there really is a deadlock. Its reason is class initialization .
The expression is executed in the static initializer of the ParallelSum class:
static int SUM = IntStream.range(0, 100).parallel().reduce(0, (x, y) -> x + y); But since the stream is parallel, execution occurs in separate threads of the ForkJoinPool, from which the lambda body is called:
(x, y) -> x + y The lambda code is written by the Java compiler directly into the ParallelSum class as a private method. It turns out that from ForkJoinPool we are trying to refer to the ParallelSum class, which is currently at the initialization stage. Therefore, the threads begin to wait for the class to initialize, but it cannot end, because it is waiting for the computation of this convolution itself. Dedlock.
Why at first was the sum counted? It was just luck. We have a small number of elements summed up, and sometimes everything is executed in one stream (another stream just does not have time).
But why then is the thread in the stack trace RUNNABLE? If you read the documentation for Thread.State, it becomes clear that there can be no other state here. There cannot be a BLOCKED state, because the stream is not blocked on the Java monitor, there is no synchronized section, and there can be no WAITING state, because there are no Object.wait () calls here. Synchronization occurs on the internal object of the virtual machine, which, generally speaking, does not even have to be a Java object.
Stack trace when logging
Imagine a situation: in a heap of places in our application something is logged. It would be useful to know from which place one or another line appeared.
In Java, there is no preprocessor, so there is no possibility to use macros __ FILE__, __LINE__, as in C (these macros are converted at the compilation stage to the current file name and string). Therefore, there are no other ways to supplement the output with the file name and line number of the code from where it was printed, except through stack-traces.
public static String getLocation() { StackTraceElement s = new Exception().getStackTrace()[2]; return s.getFileName() + ':' + s.getLineNumber(); } We generate an exception, we get a stack-trace from it, in this case we take the second frame (the null one is the getLocation method, and the first one calls the warning method).
As we know, getting a stack-trace and, especially, converting it to stack-trace elements is very expensive. And we need one frame. Is it possible to do something easier (without an exception)?
In addition to getStackTrace, the exception has a Thread object's getStackTrace method.
Thread.current().getStackTrace() Will it be faster?
Not. JVM does not do any magic, here everything will work through the same escape with exactly the same stack-trace.
But the tricky way is still there:
public static String getLocation() { StackTraceElement s = sun.misc.SharedSecrets.getJavaLangAccess() .getStackTraceElement(new Exception(), 2); return s.getFileName() + ':' + s.getLineNumber(); } I love all kinds of private things: Unsafe, SharedSecrets, etc.
There is an accessor that allows you to get a StackTraceElement of a specific frame (without the need to convert the entire stack-trace into Java objects). It will work faster. But there is bad news: it won't work in Java 9. A lot of work has been done there on refactoring everything related to stack-traces, and now there are simply no such methods.
A design that allows one frame to be obtained may be useful in the so-called Caller-sensitive methods - methods whose result may depend on who calls them. In application programs, such methods are rarely encountered, but there are quite a few such examples in the JDK itself:
Depending on who calls Class.forName, the class will be searched for in the corresponding loader class (the class that called this method); similarly, with obtaining a ResourceBundle and loading the System.loadLibrary library. Information about who calls is also useful when using various methods that check permissions (does this code have the right to call this method). For this case, the getCallerClass method is provided in the “secret” API, which is actually a JVM-intrinsic and costs almost nothing.
sun.reflect.Reflection.getCallerClass As it has been said many times, the private API is an evil that is not recommended to use (you yourself run the risk of running into problems similar to those that Unsafe previously caused). Therefore, JDK developers thought about the fact that once they use it, we need a legal alternative - a new API for bypassing threads. Basic requirements for this API:
- so that you can bypass only a part of the frames (if we need literally several upper frames);
- the ability to filter frames (do not show unnecessary frames related to the framework or system classes);
- so that these frames are constructed in a lazy way (lazy) - if we do not need to receive information about which file it is associated with, this information is not retrieved prematurely;
- as in the case of getCallerClass - we need not the name of the class, but the java.lang.Class instance itself.
It is known that in the public release of Java 9 will be java.lang.StackWalker.
To get an instance of it is very simple - using the getInstance method. It has several options - the default StackWalker or slightly configurable options:
- The option RETAIN_CLASS_REFERENCE means that you do not need class names, but instances;
- Other options allow you to show frames related to system classes and reflection classes in the stack trace (by default, they will not be shown in the stack trace).
Also, for optimization, you can set the approximate depth that is needed (so that the JVM can optimize the receipt of stack frames in batch).
The simplest example of how to use it:
StackWalker sw = StackWalker.getInstance(); sw.forEach(System.out::println); Take the StackWalker and call the forEach method so that it goes around all the frames. As a result, we get such a simple stack-trace:
The same with the SHOW_REFLECT_FRAMES option:
StackWalker sw = StackWalker.getInstance(StackWalker.Option.SHOW_REFLECT_FRAMES); sw.forEach(System.out::println); In this case, methods related to the call through reflex will be added:
If you add the SHOW_HIDDEN_FRAMES option (by the way, it includes SHOW_REFLECT_FRAMES, that is, reflection frames will also be shown):
StackWalker sw = StackWalker.getInstance(StackWalker.Option.SHOW_HIDDEN_FRAMES); sw.forEach(System.out::println); The methods of dynamically generated lambda classes will appear in the stack trace:
And now the most important method that is in the StackWalker API is the walk method with such a sly incomprehensible signature with a bunch of generics:
public <T> T walk(Function<? super Stream<StackFrame>, ? extends T> function) The walk method takes a function from a stack frame.
His work is easier to show by example.
Despite the fact that all this looks scary, how to use it is obvious. Stream is passed to the function, and all the usual operations can be performed over the stream. For example, the getCallerFrame method would look like this, which only gets the second frame: the first 2 are skipped, then findFirst is called:
public static StackFrame getCallerFrame() { return StackWalker.getInstance() .walk(stream -> stream.skip(2).findFirst()) .orElseThrow(NoSuchElementException::new); } The walk method returns the result that this stream function returns. It's simple.
For this particular case (when you just need to get the Caller class) there is a special shortcut method:
return StackWalker.getInstance(RETAIN_CLASS_REFERENCE).getCallerClass(); Another example is more complicated.
We go around all the frames, leaving only those that belong to the org.apache package, and display the first 10 in the list.
StackWalker sw = StackWalker.getInstance(); List<StackFrame> frames = sw.walk(stream -> stream.filter(sf -> sf.getClassName().startsWith("org.apache.")) .limit(10) .collect(Collectors.toList())); An interesting question: why such a long signature with a bunch of generics? Why not just make a method on StackWalker that returns a stream?
public Stream<StackFrame> stream(); If you give an API that returns a stream, the JDK loses control over what is being done on this stream. It is possible to continue this stream somewhere, give it to another thread, try to use it 2 hours after it was received (the stack that we tried to bypass is long lost, and the thread can be killed long ago). Thus, it will be impossible to provide “lazy” Stack Walker API.
The main point of the Stack Walker API is: while you are inside the walk, you have a stack state fixed, so all operations on this stack can be done lazy.
For dessert, a little more interesting.
As always, the JDK developers are hiding a bunch of treasures from us. And besides the usual stack frames, for some of their needs they made live stack frames that differ from the usual ones in that they have additional methods that allow not only to get information about the method and class, but also about local variables, captured monitors and values of expres-stack of the given stack frame.
/* package-private */ interface LiveStackFrame extends StackFrame { public Object[] getMonitors(); public Object[] getLocals(); public Object[] getStack(); public static StackWalker getStackWalker(); } The protection here is not so hot: the class was simply made non-public. But who prevents us from taking reflexion and trying it? (Note: in current builds of JDK 9, access to a non-public API through reflexion is prohibited. To enable it, you must add the JVM option
--add-opens=java.base/java.lang=ALL-UNNAMED )We try on such an example. There is a program that is recursively looking for a way out of the maze. We have a square field size x size. There is a visit method with current coordinates. We are trying to go left / right / up / down from the current cell (if they are not busy). If we’ve got from the right-bottom cell to the left-top one, we think that we’ve found a way out and we print out the stack.
package demo3; import java.util.Random; public class Labyrinth { static final byte FREE = 0; static final byte OCCUPIED = 1; static final byte VISITED = 2; private final byte[][] field; public Labyrinth(int size) { Random random = new Random(0); field = new byte[size][size]; for (int x = 0; x < size; x++) { for (int y = 0; y < size; y++) { if (random.nextInt(10) > 7) { field[x][y] = OCCUPIED; } } } field[0][0] = field[size - 1][size - 1] = FREE; } public int size() { return field.length; } public boolean visit(int x, int y) { if (x == 0 && y == 0) { StackTrace.dump(); return true; } if (x < 0 || x >= size() || y < 0 || y >= size() || field[x][y] != FREE) { return false; } field[x][y] = VISITED; return visit(x - 1, y) || visit(x, y - 1) || visit(x + 1, y) || visit(x, y + 1); } public String toString() { return "Labyrinth"; } public static void main(String[] args) { Labyrinth lab = new Labyrinth(10); boolean exitFound = lab.visit(9, 9); System.out.println(exitFound); } } Run:
If I do the usual dumpStack, which was still in Java 8, we get the usual stack-trace, from which nothing is clear. Obviously, the recursive method calls itself, but it is interesting at what step (and with what coordinate values) each method is called.
Let's replace the standard dumpStack with our StackTrace.dump, which uses live stack frames through reflection:
package demo3; import java.lang.reflect.Method; import java.util.Arrays; public class StackTrace { private static Object invoke(String methodName, Object instance) { try { Class<?> liveStackFrame = Class.forName("java.lang.LiveStackFrame"); Method m = liveStackFrame.getMethod(methodName); m.setAccessible(true); return m.invoke(instance); } catch (ReflectiveOperationException e) { throw new AssertionError("Should not happen", e); } } public static void dump() { StackWalker sw = (StackWalker) invoke("getStackWalker", null); sw.forEach(frame -> { Object[] locals = (Object[]) invoke("getLocals", frame); System.out.println(" at " + frame + " " + Arrays.toString(locals)); }); } } StackWalker, getStackWalker. , getStackWalker, -, , , getLocals .
We start. , :
. .
— 7-8 JPoint 2017 . « JVM- », , , . «» , !
, JPoint Java — , .
Source: https://habr.com/ru/post/324932/
All Articles