Visualization of attacks based on ELK (elasticsearch, kibana, logstash)
Good day. In the process of servicing a large number of servers, there is a need to centralize the management of the entire zoo of machines, as well as the centralized collection of logs and log analytics to detect anomalies, errors and general statistics.
Rsyslog is used as a centralized log collection, and for structuring and visualizing elasticsearch + kibana. Everything would be fine, but when the number of connected machines grows, there is so much data that it takes (took) a lot of time to process and analyze them. Along with other interesting things, I always wanted to organize my own security center. A sort of multimonitor statistics with maps, graphs and other things.
In this article I want to describe my experience of creating a monitor of statistics on attacks on the Soviet Union. We will not consider protection in this regard, because programmers and others may not be able to connect to non-standard ports or use certificates.
Since we already have a deployed elastic with kibana, then we will base our system on its base.
')
So, we already have an installed docker and docker-compose , which means we will be raising services on it.
elastic:
/srv/docker/elastic/elasticsearch.yml:
/srv/docker/elastic/logging.yml:
kibana:
logstash:
So. We launched elastic and kibana, but it remains to prepare logstesh for processing logs from external servers. I implemented the following scheme:
rsyslog → logstash → elastic → kibana.
It would be possible to use the connector built into rsyslog directly into elastic, but we need data on the fields and with the geoip for statistics.
On the servers connected to the monitoring, we add the following entry to the rsyslog config (usually /etc/rsyslog.d/50-default.conf):
With this record we send all authorization events to our remote server (logstash).
Further, the logs received by a logshesh need to be processed and issued. To do this, we create a mapping of fields so that we can work comfortably at the output (/srv/docker/logstash/ssh-map.json):
During the creation of the mapping, I ran into one logstesh bug, namely assigning a geo_point value to a field (when creating its index, the geoip.location value is set to float), which will later be used to build a heatmap on the map. This bug is registered and as a workaround I had to use the standard index template logstash- *.
So, we have mapping. Now you need to prepare the logstash config so that it filters the incoming data and in the right format gives it into elastic (/srv/docker/logstash/logstash.conf):
The config is readable, understandable, so I consider it unnecessary to comment.
So. The sssy logs get into the logstesh, it processes them and sends them to elastic indexes. It remains only to customize the visualization:
- Open the web interface at xxxx : 4009 /
- Go to Settings and add work with our indexes (logstash- *)
Next we need to create search queries, visualization and dashboards in kibana.
In the Discover tab, after adding indices to kibana, we see our records - everything is set up correctly.
In the left column we see a list of fields for filtering, and we will work with them.
The first filter will be the list of attacked servers:
- near the host field click add
- save the search as ssh-brute-servers-under-attack (the name is variable)
The second filter will be the list of attacking countries:
- near the geoip.country_name field, click add
- save as ssh-brute-countries (variable name)
The third filter will be the total number of attacks:
- go to the Discovery tab
- save as ssh-brute-all
So, on the final screen we will have four different parameters:
1. The total number of attacks
2. Attacking countries
3. Attacked servers
4. Map with pointers to attacking hosts
The total number of attacks:
- go to the Visualize tab
- choose the type of visualization Metric
- From saved search - ssh-brute-all
- Open Metric and change the field value to - Total number of attacks
- Save the visualization
Attacking countries:
- go to the Visualize tab
- choose the type of visualization Data table
- From saved search - ssh-brute-countries
- Open Metric and change the field value to - Number of attacks
- Now we need to correlate the fields and count in the table "unique". Click split rows
- Aggregation - terms
- Field - geoip.country_name.raw
- Custom label - Country
If everything is entered correctly, the green play button will light up, after clicking on which we will see something like this:

- Save the visualization
Attacked servers:
- go to the Visualize tab
- choose the type of visualization Data table
- From saved search - ssh-brute-servers-under-attack
- Open Metric and change the field value to - Number of attacks
- Now we need to correlate the fields and count in the table "unique". Click split rows
- Aggregation - terms
- Field - host.raw
- Custom label - Server
If everything is entered correctly, the green play button will light up, after clicking on which we will see something like this:
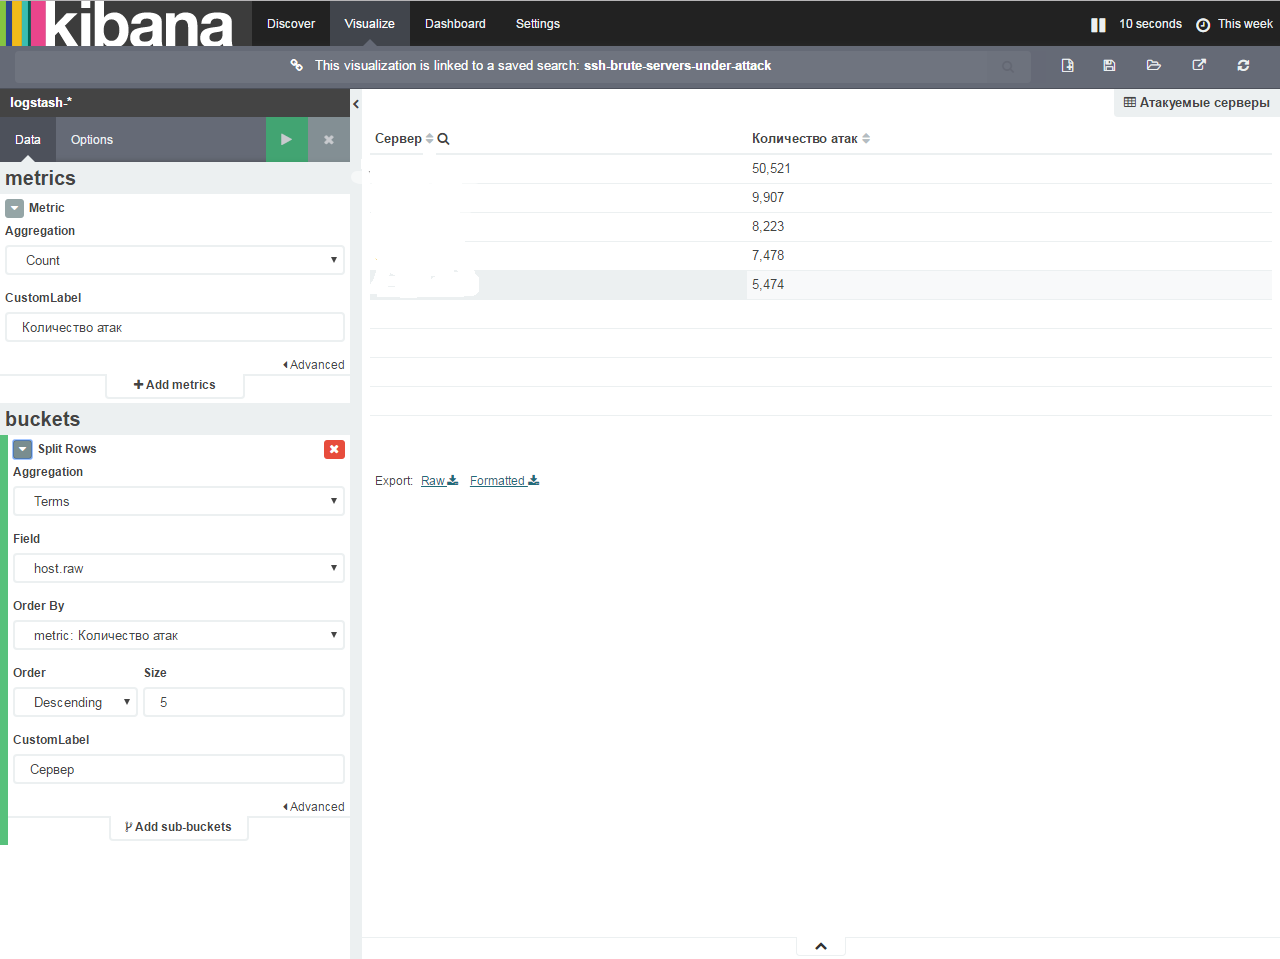
- Save the visualization
Map with pointers to attacking hosts (the most interesting)
- go to the Visualize tab
- choose the type of visualization Tile map
- From new search - Select an index pattern - logstash- *
- Open Geo Coordinates. If all steps were correct, automatically the Field will fill in geoip.location
- Go to Options
- We are changing the hosting of maps (since the MapRequest conditions have changed and we need to get a token and additionally do something). We put a check in - WMS compliant map server
- We give all the fields to the parameters:
WMS Url - basemap.nationalmap.gov/arcgis/services/USGSTopo/MapServer/WMSServer
WMS layers * - 0
WMS version * - 1.3.0
WMS format * - image / png
WMS attribution - Maps provided by USGS
WMS styles * - empty
As a result, we should see the attack map:
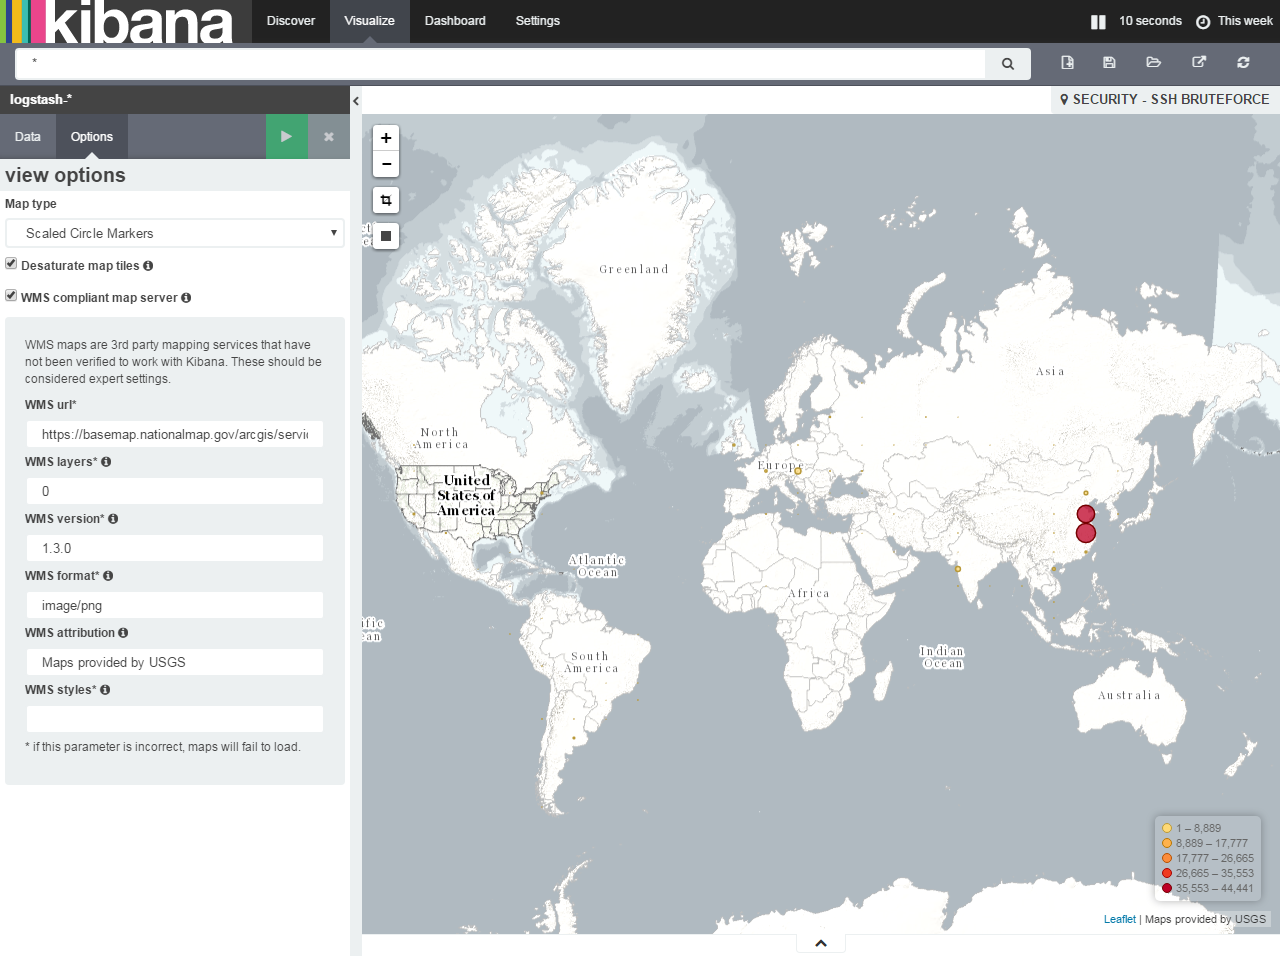
- Save the visualization
Now we have everything to make your dashboards.
Go to the Dashboard tab, click on Add visualization (plus in the circle on the top right) and add your saved visualizations to the screen and save the screen. Drag'n'Drop is supported. In the end, I got this screen:
Now, to connect new hosts to the system, it will be enough to indicate that they transfer the authorization logs to the logstash server and when events occur, the hosts and information will be added to the screen and to the elastic.
If you wish, you can always add the bruteforce logs of control panels, collect more detailed statistics and add to the screen by analogy with this article.
Rsyslog is used as a centralized log collection, and for structuring and visualizing elasticsearch + kibana. Everything would be fine, but when the number of connected machines grows, there is so much data that it takes (took) a lot of time to process and analyze them. Along with other interesting things, I always wanted to organize my own security center. A sort of multimonitor statistics with maps, graphs and other things.
In this article I want to describe my experience of creating a monitor of statistics on attacks on the Soviet Union. We will not consider protection in this regard, because programmers and others may not be able to connect to non-standard ports or use certificates.
Since we already have a deployed elastic with kibana, then we will base our system on its base.
')
So, we already have an installed docker and docker-compose , which means we will be raising services on it.
elastic:
elasticsearch: build: elasticsearch:2.3.4 container_name: elastic command: elasticsearch -Des.network.host=0.0.0.0 net: host ports: - "9200:9200" - "9300:9300" volumes: - "/srv/docker/elastic/etc:/usr/share/elasticsearch/config" - "/srv/docker/elastic/db:/usr/share/elasticsearch/data" - "/etc/localtime:/etc/localtime:ro" restart: always environment: - ES_HEAP_SIZE=2g /srv/docker/elastic/elasticsearch.yml:
cluster.name: Prod node.name: "central-syslog" http.port: 9200 network.host: _non_loopback_ discovery.zen.ping.multicast.enabled: false discovery.zen.ping.unicast.hosts: [ ] transport.publish_host: 0.0.0.0 #transport.publish_port: 9300 http.cors.enabled : true http.cors.allow-origin : "*" http.cors.allow-methods : OPTIONS, HEAD, GET, POST, PUT, DELETE http.cors.allow-headers : X-Requested-With,X-Auth-Token,Content-Type, Content-Length script.engine.groovy.inline.aggs: on /srv/docker/elastic/logging.yml:
logger: action: DEBUG com.amazonaws: WARN appender: console: type: console layout: type: consolePattern conversionPattern: "[%d{ISO8601}][%-5p][%-25c] %m%n" kibana:
kibana: image: kibana restart: always container_name: kibana environment: SERVICE_NAME: 'kibana' ELASTICSEARCH_URL: "http://xxxx:9200" ports: - "4009:5601" volumes: - "/etc/localtime:/etc/localtime:ro" logstash:
logstash: image: logstash:latest restart: always container_name: logstash hostname: logstash ports: - "1025:1025" - "1026:1026" volumes: - "/srv/docker/logstash/logstash.conf:/etc/logstash.conf:ro" - "/srv/docker/logstash/ssh-map.json:/etc/ssh-map.json:ro" command: "logstash -f /etc/logstash.conf" So. We launched elastic and kibana, but it remains to prepare logstesh for processing logs from external servers. I implemented the following scheme:
rsyslog → logstash → elastic → kibana.
It would be possible to use the connector built into rsyslog directly into elastic, but we need data on the fields and with the geoip for statistics.
On the servers connected to the monitoring, we add the following entry to the rsyslog config (usually /etc/rsyslog.d/50-default.conf):
auth,authpriv.* @@xxxx:1026 With this record we send all authorization events to our remote server (logstash).
Further, the logs received by a logshesh need to be processed and issued. To do this, we create a mapping of fields so that we can work comfortably at the output (/srv/docker/logstash/ssh-map.json):
{ "template": "logstash-*", "mappings": { "ssh": { "properties": { "@timestamp": { "type": "date", "format": "strict_date_optional_time||epoch_millis" }, "@version": { "type": "string" }, "username": { "type": "string" }, "src_ip": { "type": "string" }, "port": { "type": "long" }, } } } } During the creation of the mapping, I ran into one logstesh bug, namely assigning a geo_point value to a field (when creating its index, the geoip.location value is set to float), which will later be used to build a heatmap on the map. This bug is registered and as a workaround I had to use the standard index template logstash- *.
So, we have mapping. Now you need to prepare the logstash config so that it filters the incoming data and in the right format gives it into elastic (/srv/docker/logstash/logstash.conf):
input { tcp { port => 1026 type => "security" } } filter { grok { match => ["message", "Failed password for (invalid user |)%{USERNAME:username} from %{IP:src_ip} port %{BASE10NUM:port} ssh2"] add_tag => "ssh_brute_force_attack" } grok { match => ["message", "Accepted password for %{USERNAME:username} from %{IP:src_ip} port %{BASE10NUM:port} ssh2"] add_tag => "ssh_sucessful_login" } geoip { source => "src_ip" } } output { if "ssh_brute_force_attack" in [tags] { elasticsearch { hosts => ["xxxx:9200"] index => "logstash-%{+YYYY.MM.dd}" manage_template => true template_name => "ssh" template => "/etc/ssh-map.json" template_overwrite => true } } } The config is readable, understandable, so I consider it unnecessary to comment.
So. The sssy logs get into the logstesh, it processes them and sends them to elastic indexes. It remains only to customize the visualization:
- Open the web interface at xxxx : 4009 /
- Go to Settings and add work with our indexes (logstash- *)
Next we need to create search queries, visualization and dashboards in kibana.
In the Discover tab, after adding indices to kibana, we see our records - everything is set up correctly.
In the left column we see a list of fields for filtering, and we will work with them.
The first filter will be the list of attacked servers:
- near the host field click add
- save the search as ssh-brute-servers-under-attack (the name is variable)
The second filter will be the list of attacking countries:
- near the geoip.country_name field, click add
- save as ssh-brute-countries (variable name)
The third filter will be the total number of attacks:
- go to the Discovery tab
- save as ssh-brute-all
So, on the final screen we will have four different parameters:
1. The total number of attacks
2. Attacking countries
3. Attacked servers
4. Map with pointers to attacking hosts
The total number of attacks:
- go to the Visualize tab
- choose the type of visualization Metric
- From saved search - ssh-brute-all
- Open Metric and change the field value to - Total number of attacks
- Save the visualization
Attacking countries:
- go to the Visualize tab
- choose the type of visualization Data table
- From saved search - ssh-brute-countries
- Open Metric and change the field value to - Number of attacks
- Now we need to correlate the fields and count in the table "unique". Click split rows
- Aggregation - terms
- Field - geoip.country_name.raw
- Custom label - Country
If everything is entered correctly, the green play button will light up, after clicking on which we will see something like this:
- Save the visualization
Attacked servers:
- go to the Visualize tab
- choose the type of visualization Data table
- From saved search - ssh-brute-servers-under-attack
- Open Metric and change the field value to - Number of attacks
- Now we need to correlate the fields and count in the table "unique". Click split rows
- Aggregation - terms
- Field - host.raw
- Custom label - Server
If everything is entered correctly, the green play button will light up, after clicking on which we will see something like this:
- Save the visualization
Map with pointers to attacking hosts (the most interesting)
- go to the Visualize tab
- choose the type of visualization Tile map
- From new search - Select an index pattern - logstash- *
- Open Geo Coordinates. If all steps were correct, automatically the Field will fill in geoip.location
- Go to Options
- We are changing the hosting of maps (since the MapRequest conditions have changed and we need to get a token and additionally do something). We put a check in - WMS compliant map server
- We give all the fields to the parameters:
WMS Url - basemap.nationalmap.gov/arcgis/services/USGSTopo/MapServer/WMSServer
WMS layers * - 0
WMS version * - 1.3.0
WMS format * - image / png
WMS attribution - Maps provided by USGS
WMS styles * - empty
As a result, we should see the attack map:
- Save the visualization
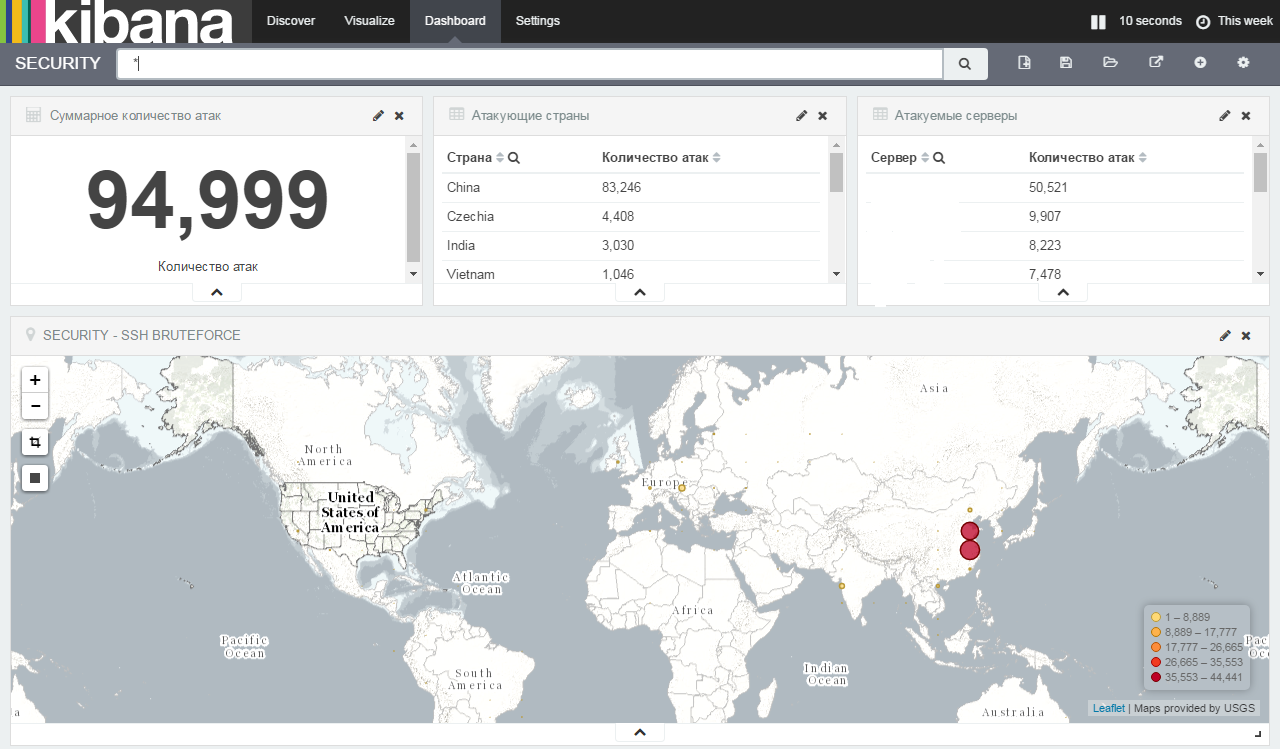
Now we have everything to make your dashboards.
Go to the Dashboard tab, click on Add visualization (plus in the circle on the top right) and add your saved visualizations to the screen and save the screen. Drag'n'Drop is supported. In the end, I got this screen:
Now, to connect new hosts to the system, it will be enough to indicate that they transfer the authorization logs to the logstash server and when events occur, the hosts and information will be added to the screen and to the elastic.
If you wish, you can always add the bruteforce logs of control panels, collect more detailed statistics and add to the screen by analogy with this article.
Source: https://habr.com/ru/post/324760/
All Articles