Splunk. Introduction to machine data analysis - part 2. Enrichment of data from external directories and work with geo-data

We continue to tell and show how Splunk works, in particular, to talk about the capabilities of the SPL search query language.
In this article, based on the test data (web server logs) available for everyone to download, we show:
')
- How to enrich logs with information from external directories
- How can you visualize geographic data (data with coordinates)
- How to group chains of events in a transaction and work with them
Under the cat you will find both the examples of search queries themselves and the result of their execution. You can download the free version of Splunk, download the test data and repeat everything on your local computer.
On how to install Splunk and download the test data we described in previous articles of our blog.
Enriching data with information from external directories
Consider the data we have.
sourcetype=access* 
These are access log events, which contain information about the actions of site visitors (according to legend, this is the website of the online store of the company that sells computer games). Therefore, in the logs we have such fields as (the most interesting for processing and requests):
- action - actions of the site visitor
- clientip - ip-address of the site visitor
- productId - product code
- categoryId - product category
- JSESSIONID - session id session
As we already told in the previous post , with the help of Splunk we can build various analytics through search queries. For example, we can calculate how much and what products were bought for a certain time period:
sourcetype=access* action=purchase | stats count by productId | sort -count 
But! Since in our logs there is no longer any information about the product other than productId, we do not see what kind of product it is, how much it costs, and so on. Therefore, it would be convenient to load the corresponding fields from the external directory.
As a reference, take a simple csv file with the information we are interested in about the product name and its price, and load it into Splunk. I must say that this is the easiest manual method of enrichment. It is clear that Splunk can take data from relational databases, make requests to the API, and more.
After you have downloaded the reference book, you need to upload it to Splunk and mark up the fields. Detailed instructions here . If you did everything correctly, you should get the following search query results:
| inputlookup prices_lookup 
In fact, we simply added a label with a reference book in Splunk, now let's make the system “add” the values of these fields to our events. It is clear that it will not change the initial events in any way, but simply logically tighten the fields.
Go to the tab Settings → Lookups → Automatic lookups → New
Name: - any name
Lookup table: prices_lookup (or how you set up your table)
Sourcetype: access_combined_wcookie
Lookup input fields: productId = productId
Lookup output fields: price = price, product_name = product_name, sale_price = sale_price

After that, we save everything and change Permissions to All Apps and Read / Write everyone as the previous instructions.
If everything is done correctly, then when searching for this sourcetype, the fields we added must be accessible (in order to display them at the bottom of each event, go to the All fields tab and select them as Interesting fields ). Note that the events themselves do not have this information, as they have not changed.
sourcetype="access_combined_wcookie" product_name="*" 
Now the results of our queries may be much more interesting. For example, we can calculate the same analytics only with reference to money and financial results.
sourcetype="access_combined_wcookie" action=purchase | eval profit=price-sale_price | stats values(productId) as " ", values(sale_price) as " ", values(price) as " ", count as "", sum(profit) as "", by product_name | sort -"" | rename product_name as "" 
It is clear that this example is more about the BI story. However, this example of connecting reference books is replicated in other subject areas. For example, if we talk about information security, we can load information from the vulnerability databases using the CVE code.
And yes, I completely forgot! For easy reference editing, Splunk has a special Lookup Editor application that you can download for free from SplunkBase.
Visualization of data with geographic coordinates
Sometimes it is very useful to put the results of analytical queries on a geographic map. Here the situation is divided into 2 cases: the first is when there are already fields in the data such as latitude and longitude (thanks to them we can put something on the map), the second is when there are no these fields. In our example, that is, in our data, just the second case (we have a lot of online store visitors from different places, but we don’t have data on their latitude and longitude, but we have their ip-address). Splunk has built-in functionality for determining latitude and longitude (as well as a city, country and region) based on ip-address, iplocation command.
sourcetype="access_combined_wcookie" | iplocation clientip As a result of this request, you should see fields with latitude, longitude, the name of the city, country and region.

Now we build some analytical query and plot it on the map. For example, let's calculate the profit for each product and see where it was bought. For this we use the built-in function geostats .
sourcetype="access_combined_wcookie" action=purchase | iplocation clientip | eval profit=price-sale_price | geostats sum(profit) by product_name 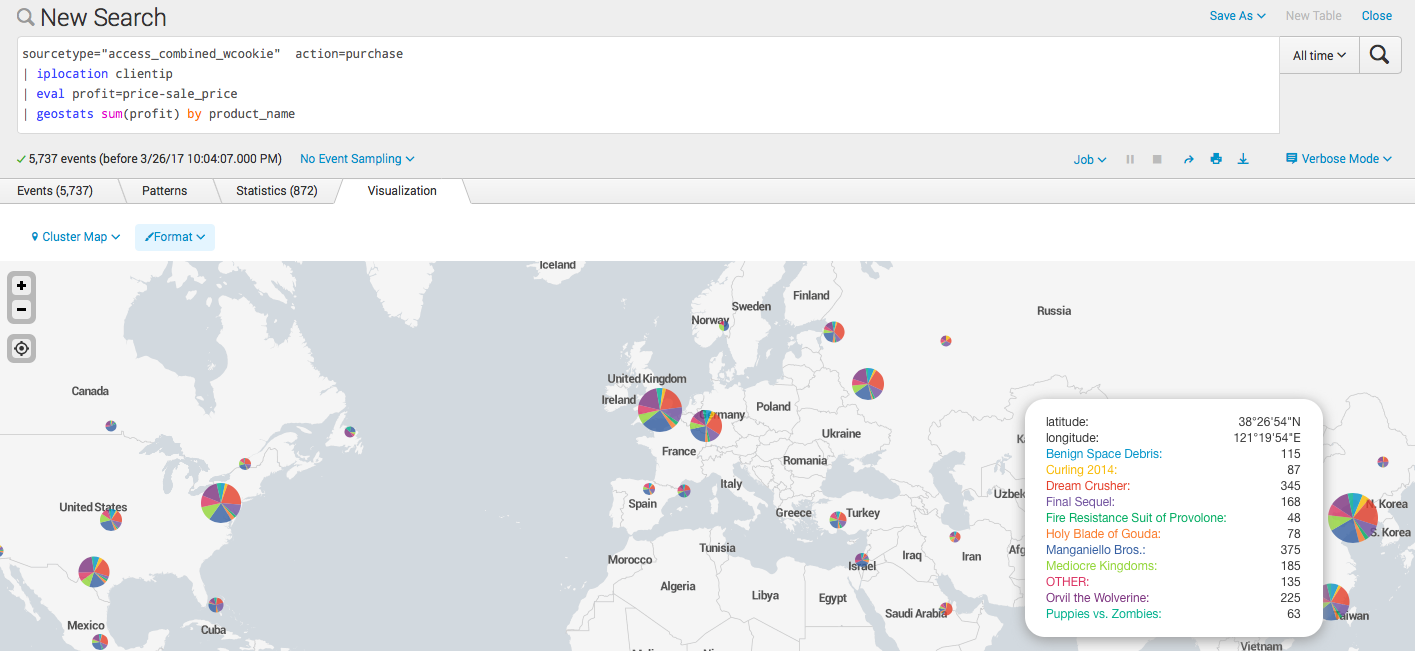
We can also use another option of visualization and see the profitability in the context of countries, for this the geom command is used.
sourcetype="access_combined_wcookie" action=purchase | iplocation clientip | eval profit=price-sale_price | stats sum(profit) by Country | geom geo_countries featureIdField=Country 
By default, there is mapping by country and state of the USA, but you can always make your own, based on latitude and longitude and add it to Splunk. For example, it can be regions of Rosii, or urban districts.
Transactions or grouping of chains of events in time
In the case when we have a consistent chain of events, for example, the process of sending e-mail, some kind of financial transaction, or, as is the case with our data - visiting a web site, it may be necessary to combine these events into a transaction. That is, from the group of individual events of events, it is obvious to separate the chain, grouping them by a specific attribute.
In our case, this JSESSIONID field is a unique user session number. For grouping use the transaction command.
sourcetype="access_combined_wcookie" | transaction JSESSIONID endswith="purchase" 
After that we get grouped events, as well as new fields: the duration of the transaction, and the number of grouped events.
Now you can calculate, for example, statistics on the duration of the sessions, that is, the time during which visitors decided to make a purchase.
sourcetype="access_combined_wcookie" | transaction JSESSIONID endswith="purchase" | search duration>0 | stats min(duration), max(duration), avg(duration) 
You can also count the number of competitive sessions in each period of time, for this there is a concurrency team.
sourcetype="access_combined_wcookie" | transaction JSESSIONID | concurrency duration=duration 
As a result, a new concurrency field is created, which considers competitive sessions, but, unfortunately, due to the fact that we have only one competitive session at a time, we have only one competitive session, so this example is not very effective.
Conclusion
Of course, the examples are very simple, but I hope, representative.
This concludes this article!
Write your questions if something doesn’t work or it didn’t work =)
Once again, links to download data and reference c prices .
PS
On June 28, 2018, “ Splunk Getting Started ” will be taught in Moscow , where in 6 hours the participants will receive a theoretical base and practical skills for working in Splunk. Learn more about learning and register at this link .
Source: https://habr.com/ru/post/324716/
All Articles