Go Web Application Profiling and Optimization

Hi, my name is Pavel Murzakov, I am a developer on the Features team in Badoo. It is important for us that our services consume as little resources as possible, since each additional server costs money. Therefore, we often profile and optimize the code. Part of our demons is written in Go, with the optimization of the code on which I had to work lately . Fortunately, the standard Go library has many ready-made tools for this.
Recently I came across this article, which collected information about many tools and a specific example shows how to start using them. In addition, it has some good recipes for writing effective code. This information will be useful to any novice Go-developer (more advanced will also be able to find something for themselves), so I made a translation for you. Enjoy!
Go has a powerful built-in profiler that supports profiling CPU, memory, gorutin and locks.
Connecting profiler
Go provides a low-level API for profiling runtime/pprof , but if you are developing a daemon, it’s more convenient to work with the high-level net/http/pprof .
All you need to connect the profiler is to import net/http/pprof ; Required HTTP handlers will be registered automatically:
package main import ( "net/http" _ "net/http/pprof" ) func hiHandler(w http.ResponseWriter, r *http.Request) { w.Write([]byte("hi")) } func main() { http.HandleFunc("/", hiHandler) http.ListenAndServe(":8080", nil) } If your web application uses its own URL router, you must manually register several pprof addresses:
package main import ( "net/http" "net/http/pprof" ) func hiHandler(w http.ResponseWriter, r *http.Request) { w.Write([]byte("hi")) } func main() { r := http.NewServeMux() r.HandleFunc("/", hiHandler) // pprof- r.HandleFunc("/debug/pprof/", pprof.Index) r.HandleFunc("/debug/pprof/cmdline", pprof.Cmdline) r.HandleFunc("/debug/pprof/profile", pprof.Profile) r.HandleFunc("/debug/pprof/symbol", pprof.Symbol) r.HandleFunc("/debug/pprof/trace", pprof.Trace) http.ListenAndServe(":8080", r) } That's all. Run the application, and then use the pprof tool:
go tool pprof [binary] http://127.0.0.1:8080/debug/pprof/profile One of the biggest advantages of pprof is that, due to its low overhead, it can be used in production without any noticeable performance loss.
But before we go into the details of pprof , let's look at a real-world example of how you can identify and solve performance problems in Go.
Example: left-pad microservice
Suppose you are developing a completely new microservice, which with specified characters complements the specified string from the left edge to the specified length:
$ curl "http://127.0.0.1:8080/v1/leftpad/?str=test&len=10&chr=*" {"str":"******test"} The service should collect statistics: the number of incoming requests and the duration of each request. It is assumed that all collected data is sent to a metric aggregator (for example, StatsD ). In addition, the service needs to log the request parameters: URL, IP address and User Agent.
The initial implementation of our example can be found on GitHub .
Compile and run the application:
go build && ./goprofex performance measurement
We need to determine how many requests per second our microservice can handle. This can be done using the ab - Apache benchmarking tool :
ab -k -c 8 -n 100000 "http://127.0.0.1:8080/v1/leftpad/?str=test&len=50&chr=*" # -k HTTP- (KeepAlive) # -c # -n , ab Not bad, but maybe faster:
Requests per second: 22810.15 [#/sec] (mean) Time per request: 0.042 [ms] (mean, across all concurrent requests) Note: the measurement was carried out on MacBook Pro Late 2013 (2.6 GHz Intel Core i5, 8 GB, 1600 MHz DDR3, macOS 10.12.3) using Go 1.8.
CPU profiling
Run the Apache benchmarking tool again, but with a large number of requests (1 million should be enough). And at the same time run pprof:
go tool pprof goprofex http://127.0.0.1:8080/debug/pprof/profile The CPU Profiler runs by default for 30 seconds. It uses sampling to determine which functions spend most of the CPU time. Runtime Go stops execution every ten milliseconds and records the current call stack of all working gorutin.
When pprof goes online, enter top to see the list of features that are most present in the sample as a percentage. In our case, all these functions are from the standard library and the runtime library (runtime), which is not informative for us:
(pprof) top 63.77s of 69.02s total (92.39%) Dropped 331 nodes (cum <= 0.35s) Showing top 10 nodes out of 78 (cum >= 0.64s) flat flat% sum% cum cum% 50.79s 73.59% 73.59% 50.92s 73.78% syscall.Syscall 4.66s 6.75% 80.34% 4.66s 6.75% runtime.kevent 2.65s 3.84% 84.18% 2.65s 3.84% runtime.usleep 1.88s 2.72% 86.90% 1.88s 2.72% runtime.freedefer 1.31s 1.90% 88.80% 1.31s 1.90% runtime.mach_semaphore_signal 1.10s 1.59% 90.39% 1.10s 1.59% runtime.mach_semaphore_wait 0.51s 0.74% 91.13% 0.61s 0.88% log.(*Logger).formatHeader 0.49s 0.71% 91.84% 1.06s 1.54% runtime.mallocgc 0.21s 0.3% 92.15% 0.56s 0.81% runtime.concatstrings 0.17s 0.25% 92.39% 0.64s 0.93% fmt.(*pp).doPrintf There is a more visual way to solve this problem - the web command. It generates a call graph in SVG format and opens it in a web browser:
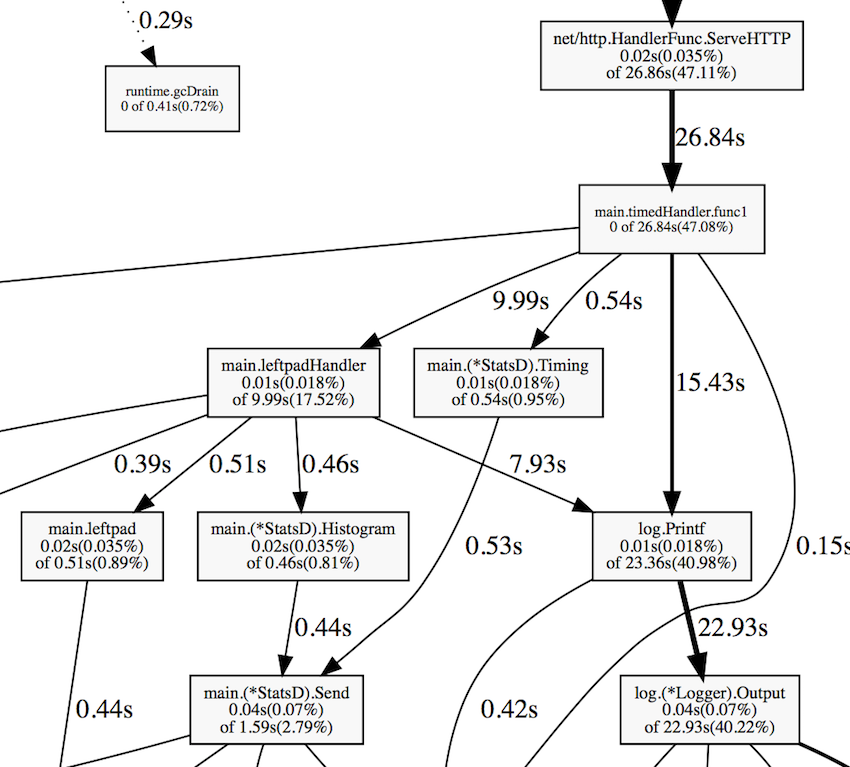
From this graph, it is clear that the application spends a significant part of the CPU time on logging and collecting metrics. Some time is spent on garbage collection.
Using the list command, you can examine each function in detail, for example, list leftpad :
(pprof) list leftpad ROUTINE ================= main.leftpad in /Users/artem/go/src/github.com/akrylysov/goprofex/leftpad.go 20ms 490ms (flat, cum) 0.71% of Total . . 3:func leftpad(s string, length int, char rune) string { . . 4: for len(s) < length { 20ms 490ms 5: s = string(char) + s . . 6: } . . 7: return s . . 8:} For those who are not afraid to look at the disassembled code, pprof includes the disasm command, which displays the actual processor instructions:
(pprof) disasm leftpad ROUTINE ======================== main.leftpad 20ms 490ms (flat, cum) 0.71% of Total . . 1312ab0: GS MOVQ GS:0x8a0, CX . . 1312ab9: CMPQ 0x10(CX), SP . . 1312abd: JBE 0x1312b5e . . 1312ac3: SUBQ $0x48, SP . . 1312ac7: MOVQ BP, 0x40(SP) . . 1312acc: LEAQ 0x40(SP), BP . . 1312ad1: MOVQ 0x50(SP), AX . . 1312ad6: MOVQ 0x58(SP), CX ... Heap profiling
Run the heap profiler:
go tool pprof goprofex http://127.0.0.1:8080/debug/pprof/heap By default, it shows the amount of memory used:
(pprof) top 512.17kB of 512.17kB total ( 100%) Dropped 85 nodes (cum <= 2.56kB) Showing top 10 nodes out of 13 (cum >= 512.17kB) flat flat% sum% cum cum% 512.17kB 100% 100% 512.17kB 100% runtime.mapassign 0 0% 100% 512.17kB 100% main.leftpadHandler 0 0% 100% 512.17kB 100% main.timedHandler.func1 0 0% 100% 512.17kB 100% net/http.(*Request).FormValue 0 0% 100% 512.17kB 100% net/http.(*Request).ParseForm 0 0% 100% 512.17kB 100% net/http.(*Request).ParseMultipartForm 0 0% 100% 512.17kB 100% net/http.(*ServeMux).ServeHTTP 0 0% 100% 512.17kB 100% net/http.(*conn).serve 0 0% 100% 512.17kB 100% net/http.HandlerFunc.ServeHTTP 0 0% 100% 512.17kB 100% net/http.serverHandler.ServeHTTP But we are more interested in the number of objects placed in a pile. Run pprof with the -alloc_objects option:
go tool pprof -alloc_objects goprofex http://127.0.0.1:8080/debug/pprof/heap Almost 70% of all objects were created by two functions - leftpad and StatsD.Send . We study them in more detail:
(pprof) top 559346486 of 633887751 total (88.24%) Dropped 32 nodes (cum <= 3169438) Showing top 10 nodes out of 46 (cum >= 14866706) flat flat% sum% cum cum% 218124937 34.41% 34.41% 218124937 34.41% main.leftpad 116692715 18.41% 52.82% 218702222 34.50% main.(*StatsD).Send 52326692 8.25% 61.07% 57278218 9.04% fmt.Sprintf 39437390 6.22% 67.30% 39437390 6.22% strconv.FormatFloat 30689052 4.84% 72.14% 30689052 4.84% strings.NewReplacer 29869965 4.71% 76.85% 29968270 4.73% net/textproto.(*Reader).ReadMIMEHeader 20441700 3.22% 80.07% 20441700 3.22% net/url.parseQuery 19071266 3.01% 83.08% 374683692 59.11% main.leftpadHandler 17826063 2.81% 85.90% 558753994 88.15% main.timedHandler.func1 14866706 2.35% 88.24% 14866706 2.35% net/http.Header.clone Other useful options for solving memory problems are:
• -inuse_objects , showing the number of objects in memory;
• -alloc_space , showing how much memory has been allocated since the program started.
Automatic memory management is convenient, but alas, there is nothing free in the world. Allocating memory on the heap is not only much slower than the allocation on the stack, but also indirectly affects performance. Each piece of memory that you allocate in the heap adds work to the garbage collector and forces you to use more processor resources. The only way to make an application spend less time collecting garbage is to reduce the number of allocations.
Escape analysis
Whenever you use the & operator to get a pointer to a variable or allocate memory for a new value with make or new , they are not necessarily placed on the heap:
func foo(a []string) { fmt.Println(len(a)) } func main() { foo(make([]string, 8)) } In the example above, make([]string, 8) allocates memory on the stack. Go uses escape analysis to determine if it is safe to allocate memory on the stack instead of a heap. You can add the -gcflags=-m option to see the results of the escape analysis:
5 type X struct {v int} 6 7 func foo(x *X) { 8 fmt.Println(xv) 9 } 10 11 func main() { 12 x := &X{1} 13 foo(x) 14 } go build -gcflags=-m ./main.go:7: foo x does not escape ./main.go:12: main &X literal does not escape The Go compiler is smart enough to use the stack instead of allocating memory on the heap in some cases. But the situation worsens when you start working, for example, with interfaces:
// 1 type Fooer interface { foo(a []string) } type FooerX struct{} func (FooerX) foo(a []string) { fmt.Println(len(a)) } func main() { a := make([]string, 8) // make([]string, 8) escapes to heap var fooer Fooer fooer = FooerX{} fooer.foo(a) } // 2 func foo(a interface{}) string { return a.(fmt.Stringer).String() } func main() { foo(make([]string, 8)) // make([]string, 8) escapes to heap } Dmitry Vyukov’s article Go Escape Analysis Flaws describes other cases where escape analysis is not good enough to understand whether it is safe to allocate memory on the stack.
In general, for small structures that you do not need to change, it is preferable to use the transfer by value, not by reference.
Note: for large structures it is cheaper to pass the pointer than to copy the entire structure and pass it by value.
Profiling gorutin
When the profiler runs gorutin, we get their call stack and the number of running gorutins:
go tool pprof goprofex http://127.0.0.1:8080/debug/pprof/goroutine 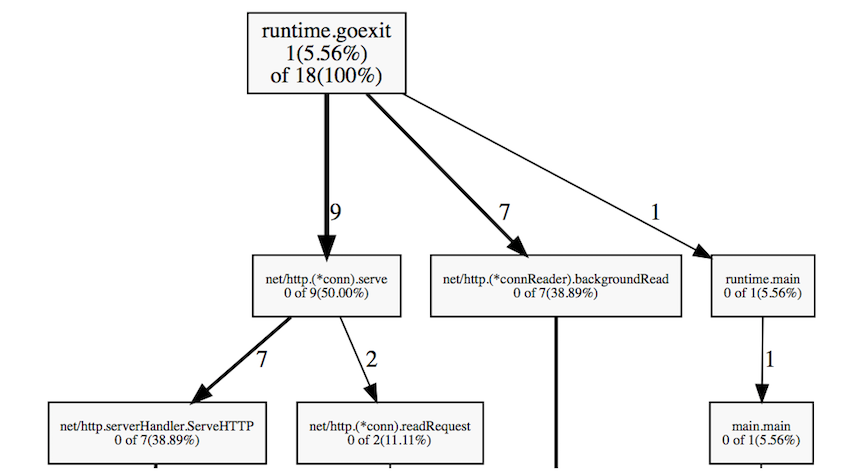
The graph shows only 18 active gorutin, which is very small. Often you can find thousands of running gorutin without significant performance degradation.
Locking Profiling
The lock profiler shows where delays occur in the program due to locks caused by synchronization objects such as mutexes and channels.
Before starting the lock profiler, you need to set the level of profiling using the runtime.SetBlockProfileRate function. You can add its call to your main or init function.
go tool pprof goprofex http://127.0.0.1:8080/debug/pprof/block 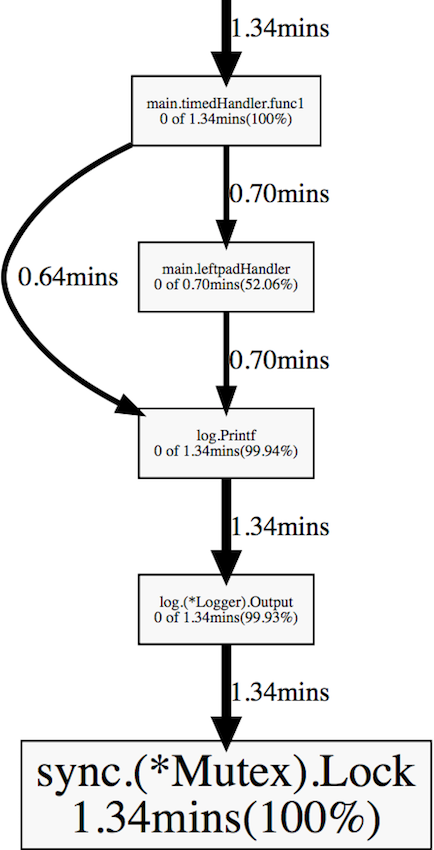
timedHandler and leftpadHandler spend a lot of time on mutexes inside log.Printf . The reason is that the implementation of the log package uses a mutex to synchronize access to a file shared by several Gortuins.
Benchmarking
As noted above, the biggest offenders in terms of performance are the functions of the log , leftpad and StatsD.Send . We found a bottleneck. But before embarking on optimization, it is necessary to develop a reproducible way of measuring the performance of the code of interest. Such a mechanism is included in the testing package. You need to create a function like func BenchmarkXxx(*testing.B ) in the test file:
func BenchmarkStatsD(b *testing.B) { statsd := StatsD{ Namespace: "namespace", SampleRate: 0.5, } for i := 0; i < bN; i++ { statsd.Incr("test") } } You can also use the net/http/httptest to benchmark the entire HTTP handler:
func BenchmarkLeftpadHandler(b *testing.B) { r := httptest.NewRequest("GET", "/v1/leftpad/?str=test&len=50&chr=*", nil) for i := 0; i < bN; i++ { w := httptest.NewRecorder() leftpadHandler(w, r) } } We start the benchmark:
go test -bench=. -benchmem It shows the time taken for each iteration, as well as the volume and number of memory allocations:
BenchmarkTimedHandler-4 200000 6511 ns/op 1621 B/op 41 allocs/op BenchmarkLeftpadHandler-4 200000 10546 ns/op 3297 B/op 75 allocs/op BenchmarkLeftpad10-4 5000000 339 ns/op 64 B/op 6 allocs/op BenchmarkLeftpad50-4 500000 3079 ns/op 1568 B/op 46 allocs/op BenchmarkStatsD-4 1000000 1516 ns/op 560 B/op 15 allocs/op Productivity increase
Logging
A good but not always obvious way to make an application faster is to make it work less. Except for debugging cases, the line log.Printf("%s request took %v", name, elapsed) does not have to be present in our service. Before deploying the application in production, all unnecessary logs should be removed from the code or disabled. This problem can be solved using one of the many logging libraries .
Another important thing related to logging (and, in general, with all I / O operations) is the use of possibly buffered I / O, which reduces the number of system calls. Usually there is no need to write every logger call to the file — use bufio to implement buffered I / O. We can simply wrap the io.Writer object io.Writer to the bufio.NewWriter in bufio.NewWriter or bufio.NewWriterSize :
log.SetOutput(bufio.NewWriterSize(f, 1024*16)) leftpad
leftpad again to the leftpad function:
func leftpad(s string, length int, char rune) string { for len(s) < length { s = string(char) + s } return s } Concatenation of strings in a loop is not the smartest thing, because each iteration of the loop results in the placement of a new string in memory. The best way to build a string is to use bytes.Buffer :
func leftpad(s string, length int, char rune) string { buf := bytes.Buffer{} for i := 0; i < length-len(s); i++ { buf.WriteRune(char) } buf.WriteString(s) return buf.String() } Alternatively, we can use string.Repeat , which allows us to slightly reduce the code:
func leftpad(s string, length int, char rune) string { if len(s) < length { return strings.Repeat(string(char), length-len(s)) + s } return s } StatsD
The following code snippet that we need to change is the StatsD.Send function:
func (s *StatsD) Send(stat string, kind string, delta float64) { buf := fmt.Sprintf("%s.", s.Namespace) trimmedStat := strings.NewReplacer(":", "_", "|", "_", "@", "_").Replace(stat) buf += fmt.Sprintf("%s:%s|%s", trimmedStat, delta, kind) if s.SampleRate != 0 && s.SampleRate < 1 { buf += fmt.Sprintf("|@%s", strconv.FormatFloat(s.SampleRate, 'f', -1, 64)) } ioutil.Discard.Write([]byte(buf)) // TODO: Write to a socket } Here are some possible improvements:
The
sprintffunction is convenient for formatting strings. And that's fine if you don't call it thousands of times a second. It spends CPU time parsing the incoming formatted string and places a new line in memory on each call. We can replace it withbytes.Buffer+Buffer.WriteString/Buffer.WriteByte.The function does not have to create a new
Replacerinstance every time; it can be declared as a global variable or as part of theStatsDstructure.- Replace
strconv.FormatFloatwithstrconv.AppendFloatand pass it the buffer allocated on the stack. This prevents additional heap memory allocation.
func (s *StatsD) Send(stat string, kind string, delta float64) { buf := bytes.Buffer{} buf.WriteString(s.Namespace) buf.WriteByte('.') buf.WriteString(reservedReplacer.Replace(stat)) buf.WriteByte(':') buf.Write(strconv.AppendFloat(make([]byte, 0, 24), delta, 'f', -1, 64)) buf.WriteByte('|') buf.WriteString(kind) if s.SampleRate != 0 && s.SampleRate < 1 { buf.WriteString("|@") buf.Write(strconv.AppendFloat(make([]byte, 0, 24), s.SampleRate, 'f', -1, 64)) } buf.WriteTo(ioutil.Discard) // TODO: Write to a socket } This reduces the amount of memory allocation from 14 to one and speeds up the Send call by about four times:
BenchmarkStatsD-4 5000000 381 ns/op 112 B/op 1 allocs/op Result measurement
After all the optimizations, the benchmarks show a very good performance increase:
benchmark old ns/op new ns/op delta BenchmarkTimedHandler-4 6511 1181 -81.86% BenchmarkLeftpadHandler-4 10546 3337 -68.36% BenchmarkLeftpad10-4 339 136 -59.88% BenchmarkLeftpad50-4 3079 201 -93.47% BenchmarkStatsD-4 1516 381 -74.87% benchmark old allocs new allocs delta BenchmarkTimedHandler-4 41 5 -87.80% BenchmarkLeftpadHandler-4 75 18 -76.00% BenchmarkLeftpad10-4 6 3 -50.00% BenchmarkLeftpad50-4 46 3 -93.48% BenchmarkStatsD-4 15 1 -93.33% benchmark old bytes new bytes delta BenchmarkTimedHandler-4 1621 448 -72.36% BenchmarkLeftpadHandler-4 3297 1416 -57.05% BenchmarkLeftpad10-4 64 24 -62.50% BenchmarkLeftpad50-4 1568 160 -89.80% BenchmarkStatsD-4 560 112 -80.00% Note: I used benchcmp to compare the results.
Run ab again:
Requests per second: 32619.54 [#/sec] (mean) Time per request: 0.030 [ms] (mean, across all concurrent requests) Now the web service can handle about 10,000 additional requests per second!
Optimization Tips
- Avoid unnecessary heap allocation.
- For smaller structures, use parameter passing by value, not by reference.
- Pre-allocate memory for maps and slices, if you know the size.
- Do not log needlessly.
- Use buffered I / O if you perform many consecutive reads or writes.
- If your application makes extensive use of JSON, then consider using parsers / serializers (I personally prefer easyjson).
- In hot places, any operation can lead to a significant decrease in performance.
Conclusion
Sometimes a bottleneck may not be what you expect. Therefore, profiling is the best (and sometimes the only) way to find out the real performance of your application.
You can find the complete source for our example on GitHub . The initial version is marked as v1 , and the optimized version as v2 . Here is a link to compare the two versions.
')
Source: https://habr.com/ru/post/324682/
All Articles