Monitoring of engineering infrastructure in the data center. Part 2. Power supply system
Part 1. Monitoring of engineering infrastructure in the data center. Highlights.
Part 2. How is the monitoring of power supply in the data center.
Part 3. Monitoring of cold supply by the example of the NORD-4 data center.
Part 4. Network infrastructure: physical equipment.
We continue a series of articles about the work of engineering infrastructure monitoring systems in our data centers. In the first part we have analyzed theoretical points, today we turn to practice. Let's start with the most critical system - power supply. Before reading we recommend refreshing knowledge about the power supply device in the data center.

One of the schemes for monitoring the power supply system in the OST-2 data center.
')
The monitoring of power supply has its own nuances. Here are some general tips for those who are just going to design and customize the system.
Monitor everything you can. There are no unimportant areas in the power supply system. Track the basic parameters of each element of the system: from transformer to PDU in the rack.
Monitor the system as a whole. It is not enough just to put all the equipment on monitoring. It is important to display the existing relationships between all elements of the system. This will help to quickly identify problems and not get confused in dozens of error alerts.
Circuit diagrams, maps and other visualization is best suited for these purposes. The picture at the beginning of the post is just an example of such a scheme. When power is lost in the rack, it will be easier to understand what caused the accident using such schemes.
Survey equipment as often as possible. Frequent polling will help not to miss important events in the life of the energy supply system: disconnection of the city power supply, errors that the diesel-gas plant did not cause. Such critical nodes as the main switchboard, diesel generator set, UPS, we recommend polling every second.
Monitor phase balancing and paired loads . These are derived indicators of the power supply system. They are calculated directly in the monitoring system on the basis of information received from the equipment.
Collect statistics. Only online data and alerts are not enough, you need to collect long-term statistics. It is useful for many things - from capacity management (capacity management) to the calculation of the budget for the purchase of spare parts.
The system works on the open-source Nagios solution. It collects equipment parameter values and sends notifications when threshold values are reached. Total 8 stands deployed with Nagios.
Information on 7 data centers and all monitoring systems is collected in a single interface based on Thruk .

Web interface Thruk .
We build statistics and graphs based on it using the built-in Nagios and Cacti services.
Another way of presenting information is schematic diagrams. Such a tuning process structures and simplifies the perception of a large amount of data. A complete picture can be obtained at a glance at the monitor.
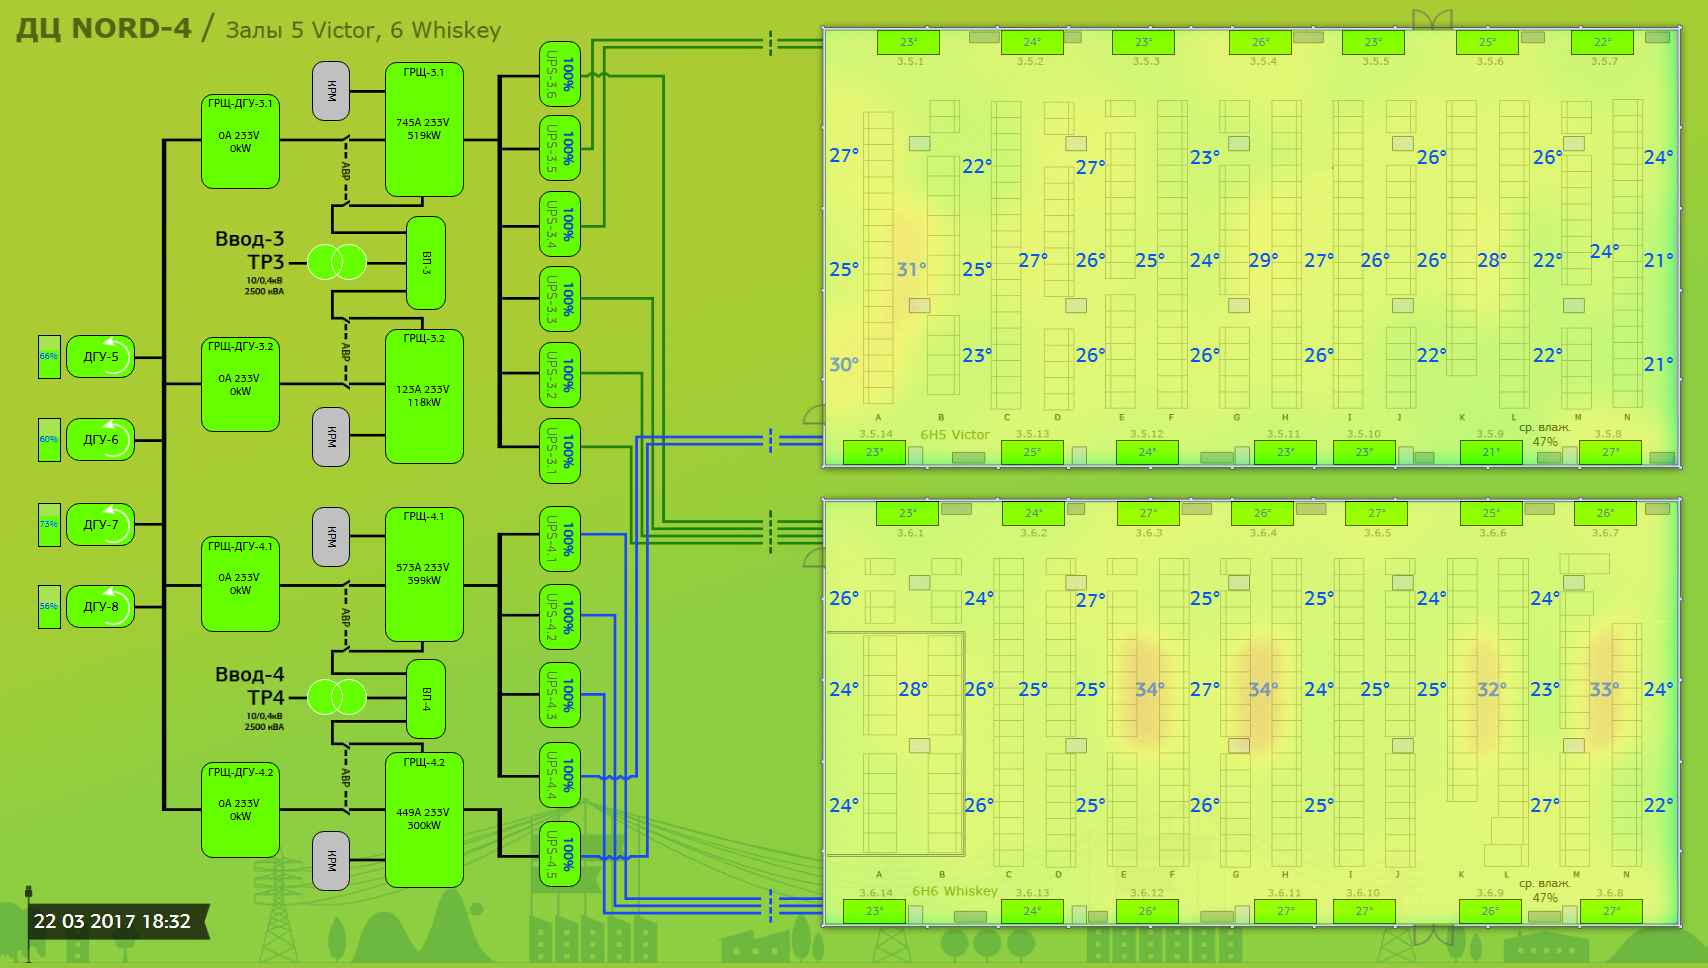
Scheme for monitoring the power center and machine rooms of the NORD-4 data center.
Let's see what, how and on what equipment you can track.
Under high load, the transformers heat up. If overheating occurs, protection will operate and the transformer will turn off. Thanks to monitoring, we can track overheating in time and take the necessary measures.
If the transformer has not yet been commissioned, then thermoelectric pyrometers can be installed on the case. In already working transformers we use remote infrared pyrometers.
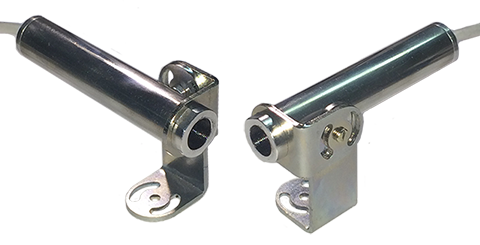
This is how infrared pyrometers look.
Monitoring at this site of the system gives us information about the availability of power from the city and its characteristics for current and voltage.
From each transformer, three copper buses come to the main switchboard (MSB). To obtain data on currents and voltages, a current transformer is installed on each bus. Its primary winding is connected to the bus, and the secondary winding is closed to the measuring device - network analyzer .
Similarly, the current transformer is mounted on the bus in the DGU board.
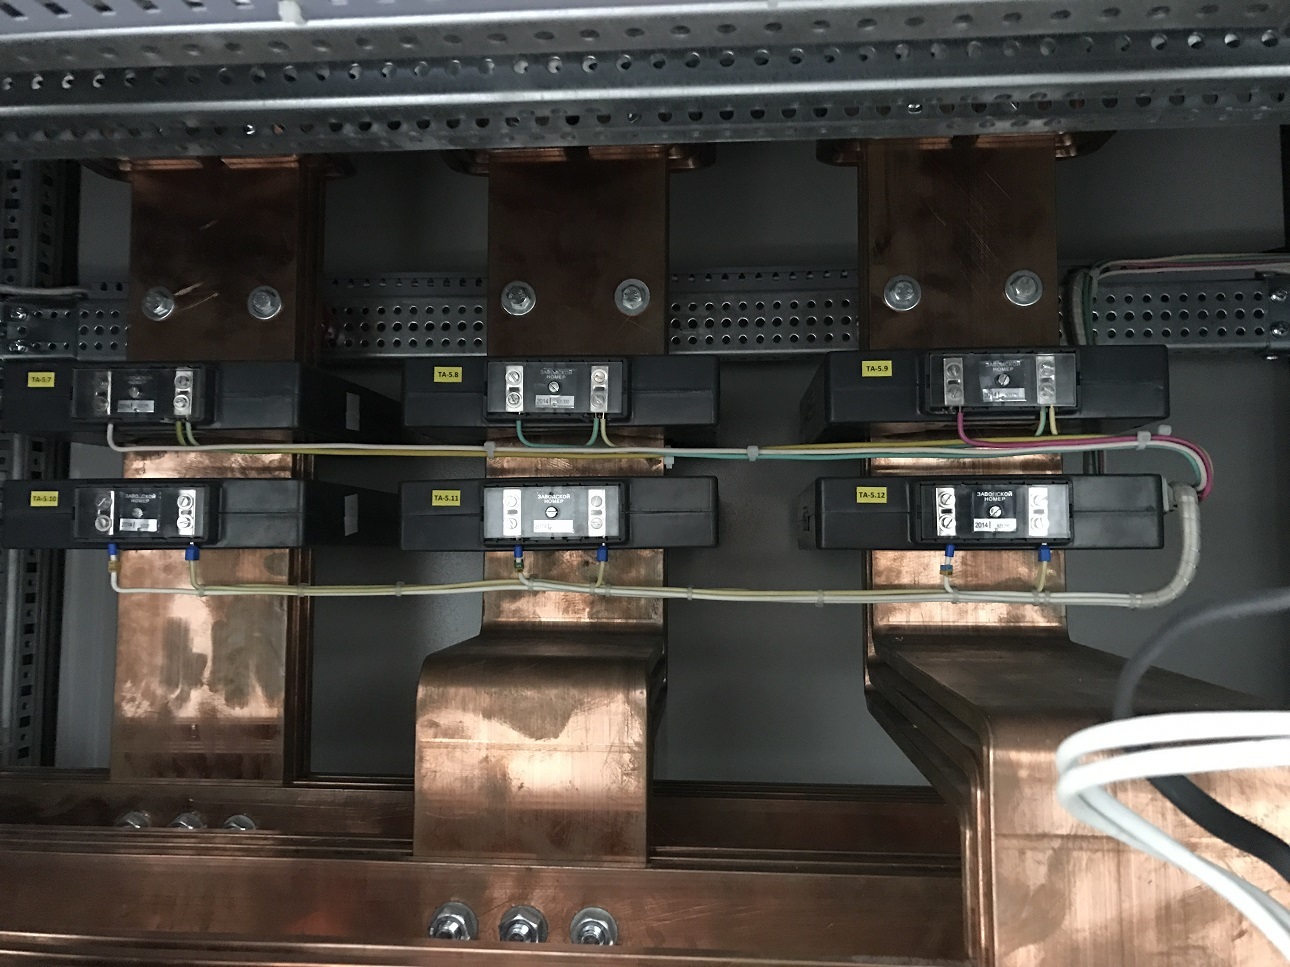
Black rings on copper tires - these are current transformers.

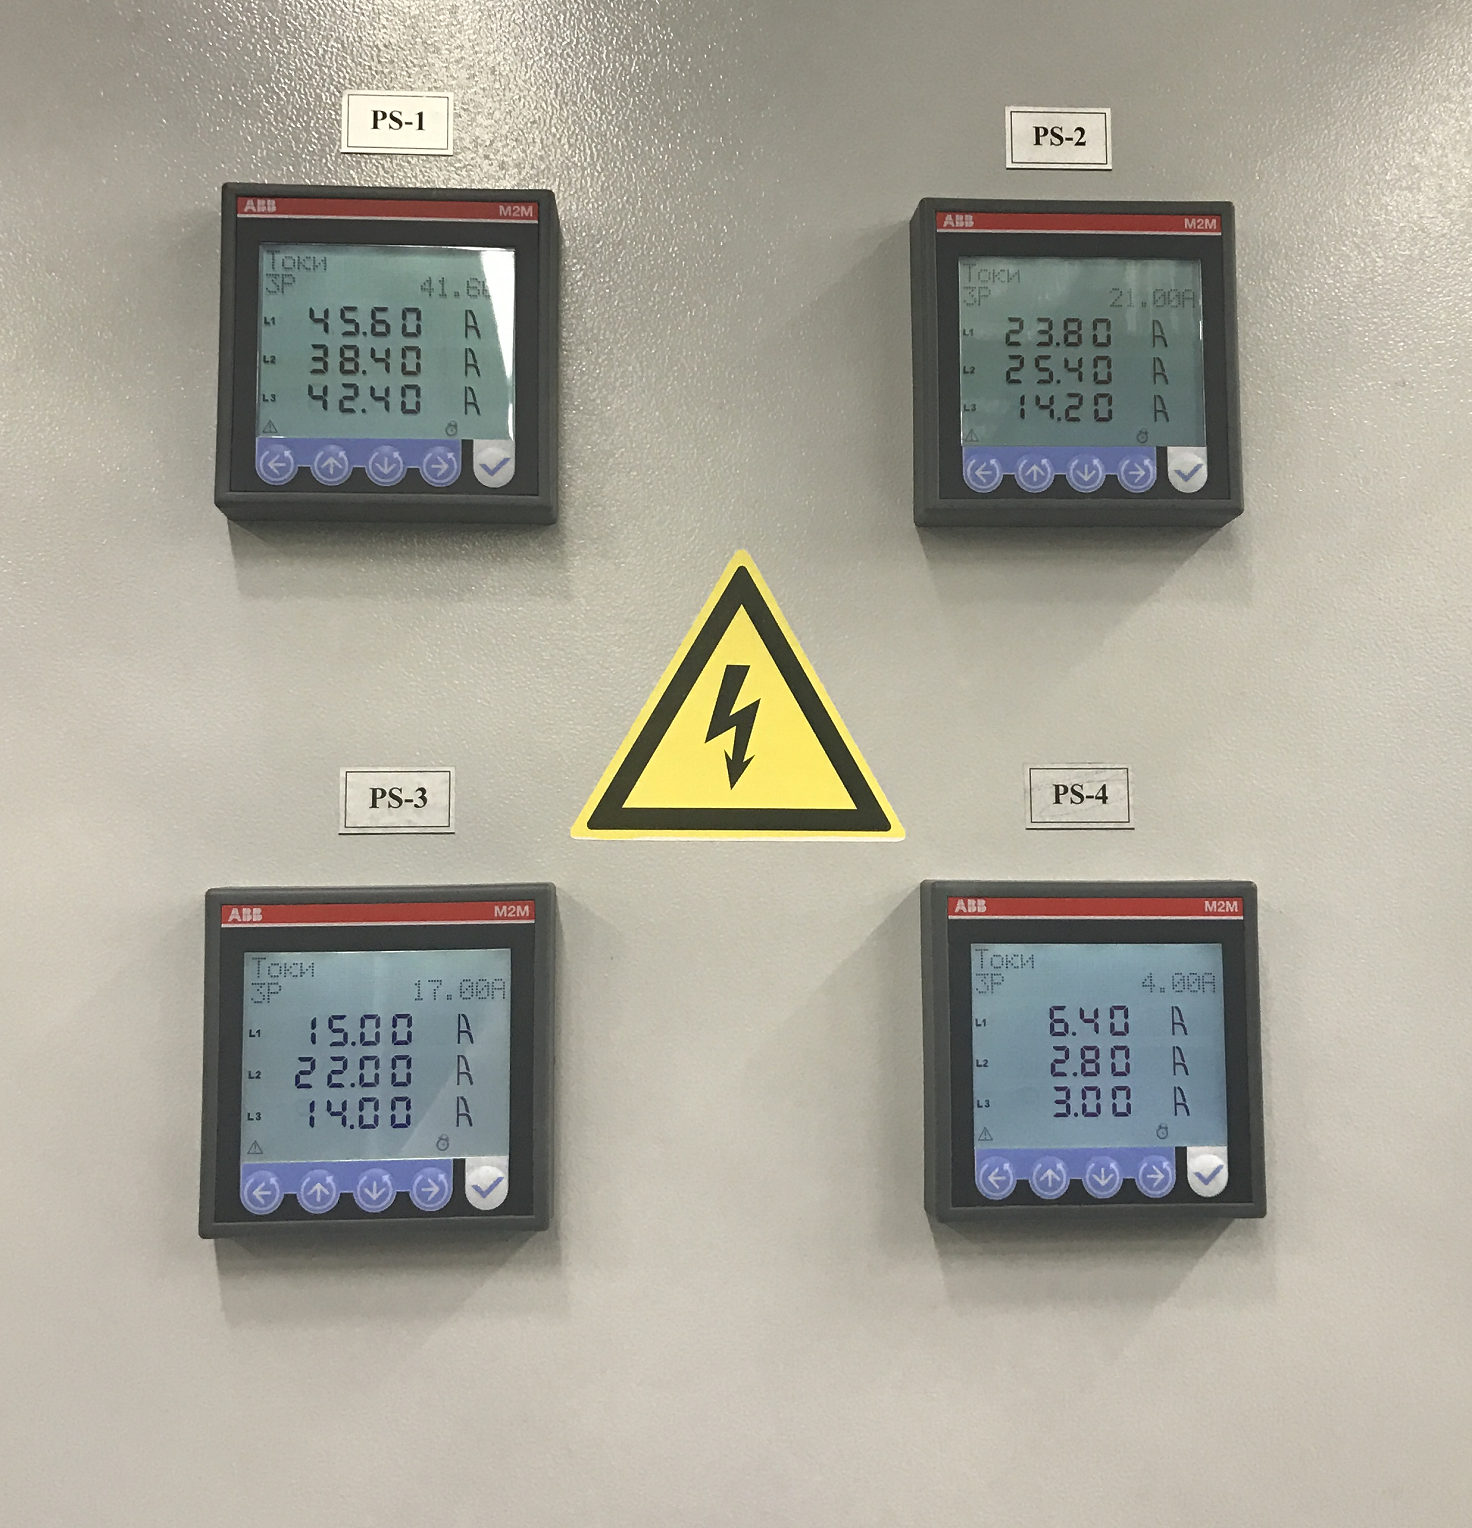
The network analyzer is attached to the switchboard door.
The monitoring system polls network analyzers using the ModBus protocol. The data goes to the monitoring server and is displayed in a single Thruk web interface.
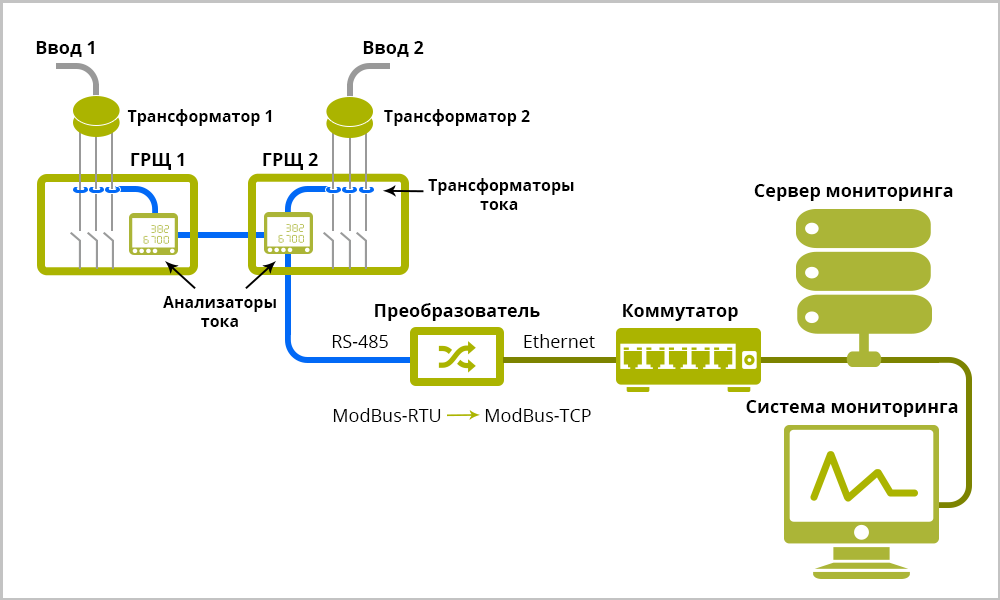
Connection diagram of network analyzers to the monitoring system.
In a similar way, monitoring is arranged in the remaining switchboards (W). For each section of the ShchR, a separate analyzer is installed, and the total - for the entire ShchR.

Current transformers in the distribution room of the machine room.
Network analyzers in the distribution room of the machine room.
From network analyzers we get about 20 parameters. Here are the main ones:
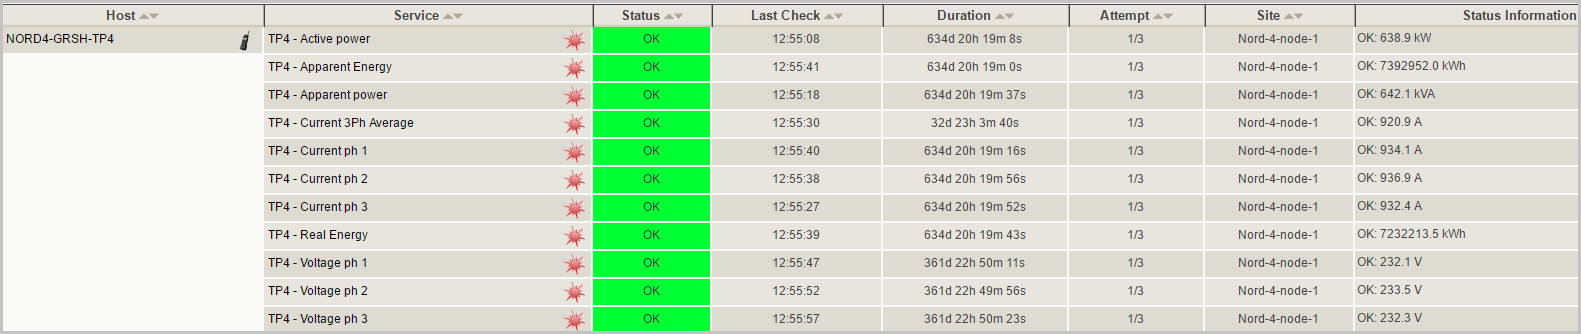
Some parameters for MSB in the monitoring system.
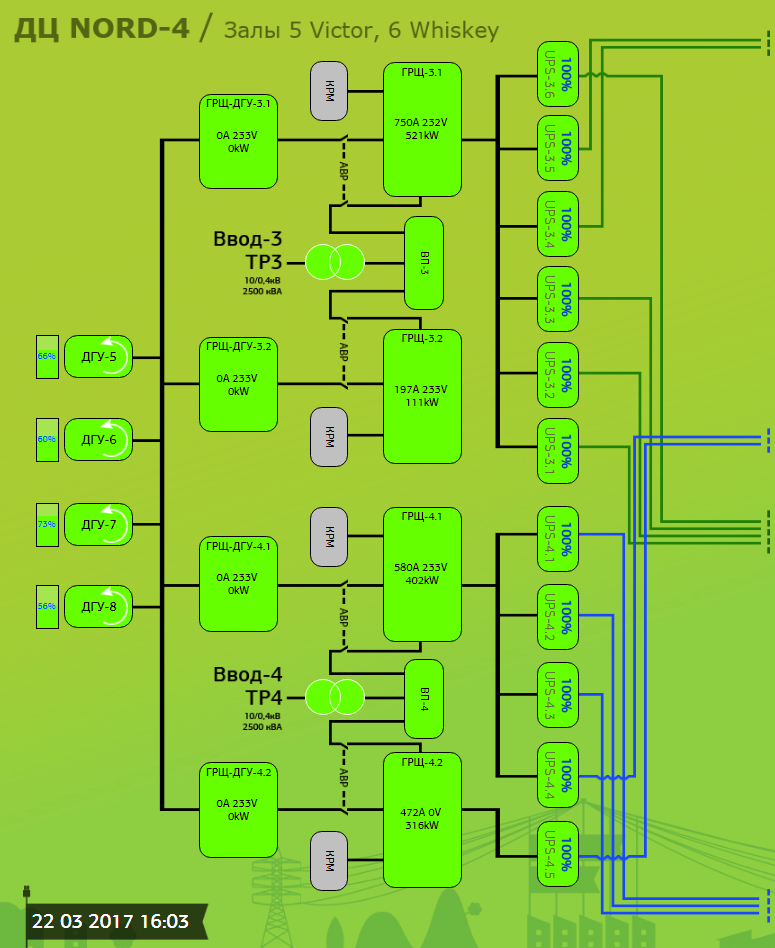
All the main parameters for MSB are displayed on schematic diagrams.
According to this system, we monitor the state of the DGU boards, fuel tanks and, of course, the DGU themselves. The monitoring system receives data from diesel power stations from the DGU control panel.
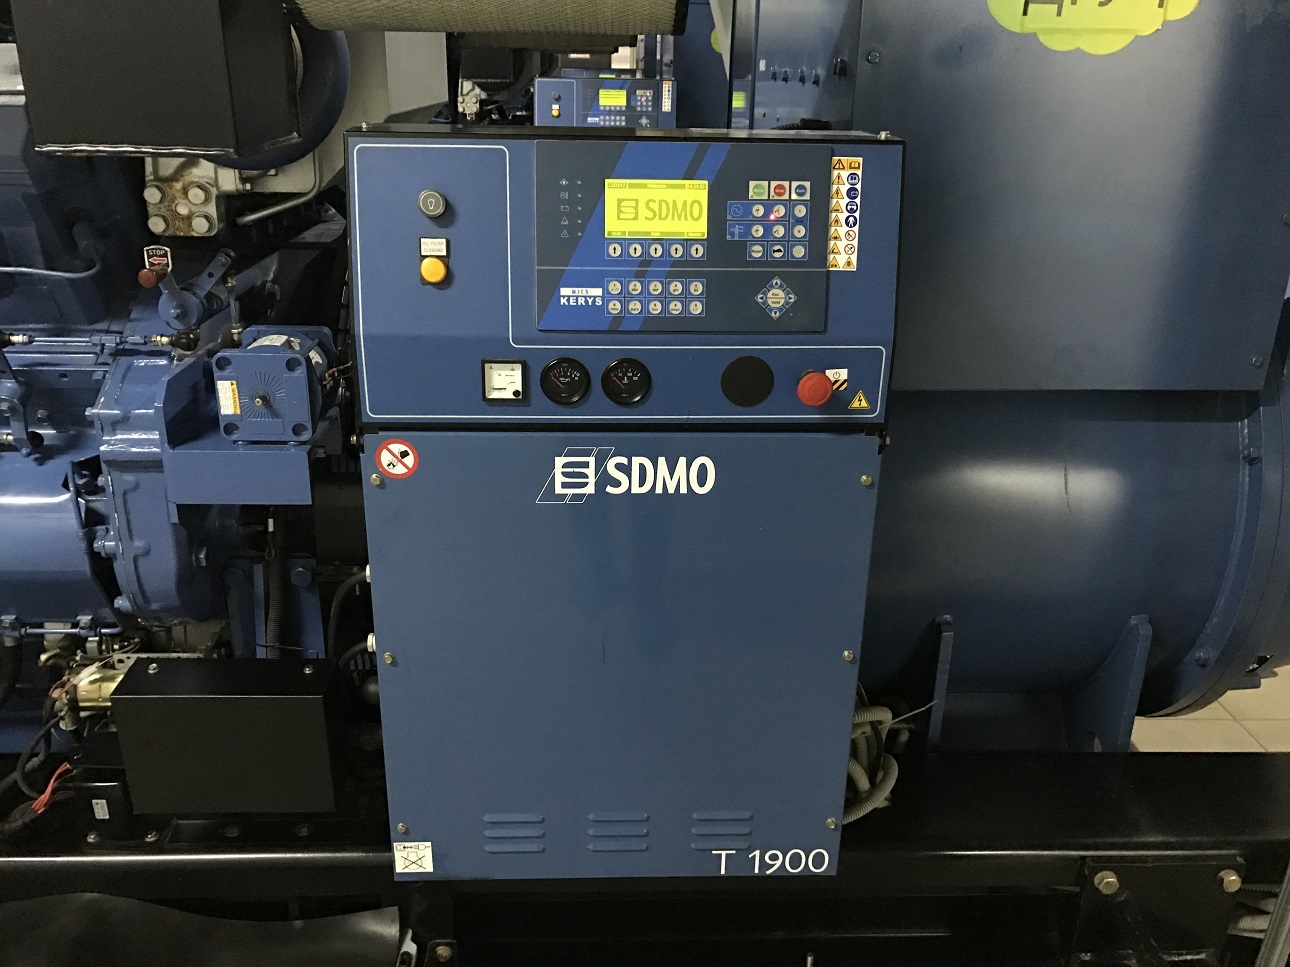
DGU control panel.
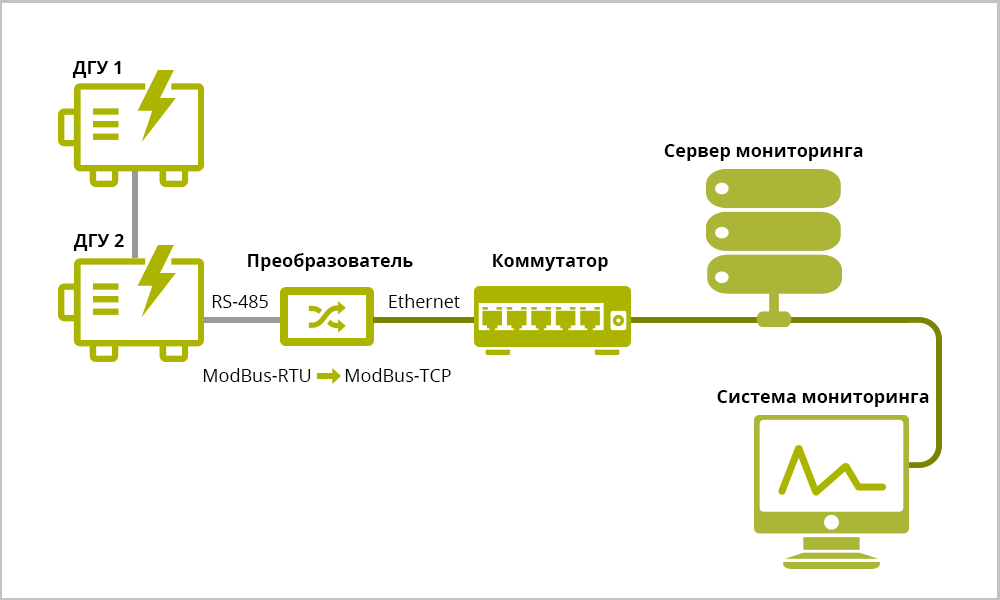
Connection diagram of the DGS to the monitoring system.
The main parameters of the DSU:
Be sure to monitor the level of fuel in the DGU tanks so as not to be left without fuel at the X hour. The equipment of many tanks already includes mechanical fuel level sensors that are only suitable for visual monitoring: you need to go to the tank to see how much is left there. This is also an option, but to get rid of the human factor and automate the process, use digital sensors.
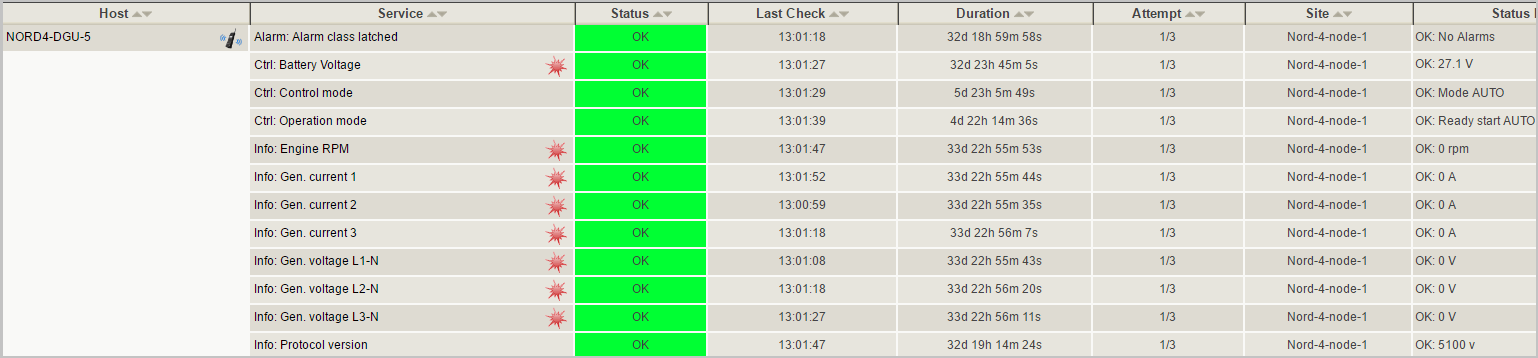
List of the main parameters of the DGS in the monitoring system.
If the UPS has a module for remote monitoring, then data collection is not difficult: just set up a survey of bespereboynik via SNMP protocol.
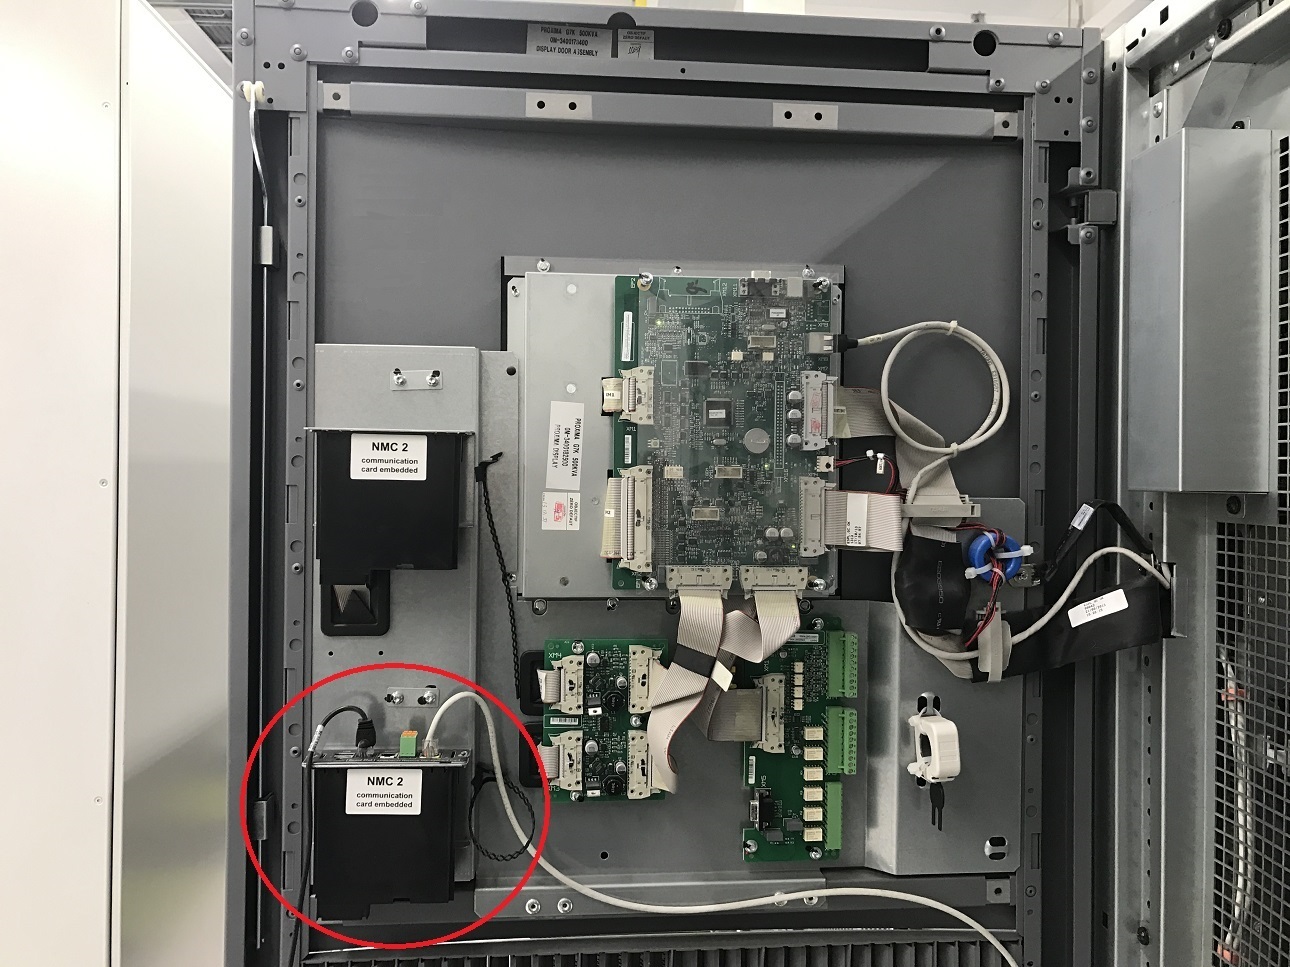
UPS from the inside. Red is the monitoring module that connects to the monitoring server.
The main parameters monitored are:
Usually, the UPS can monitor the battery parameters (batteries):
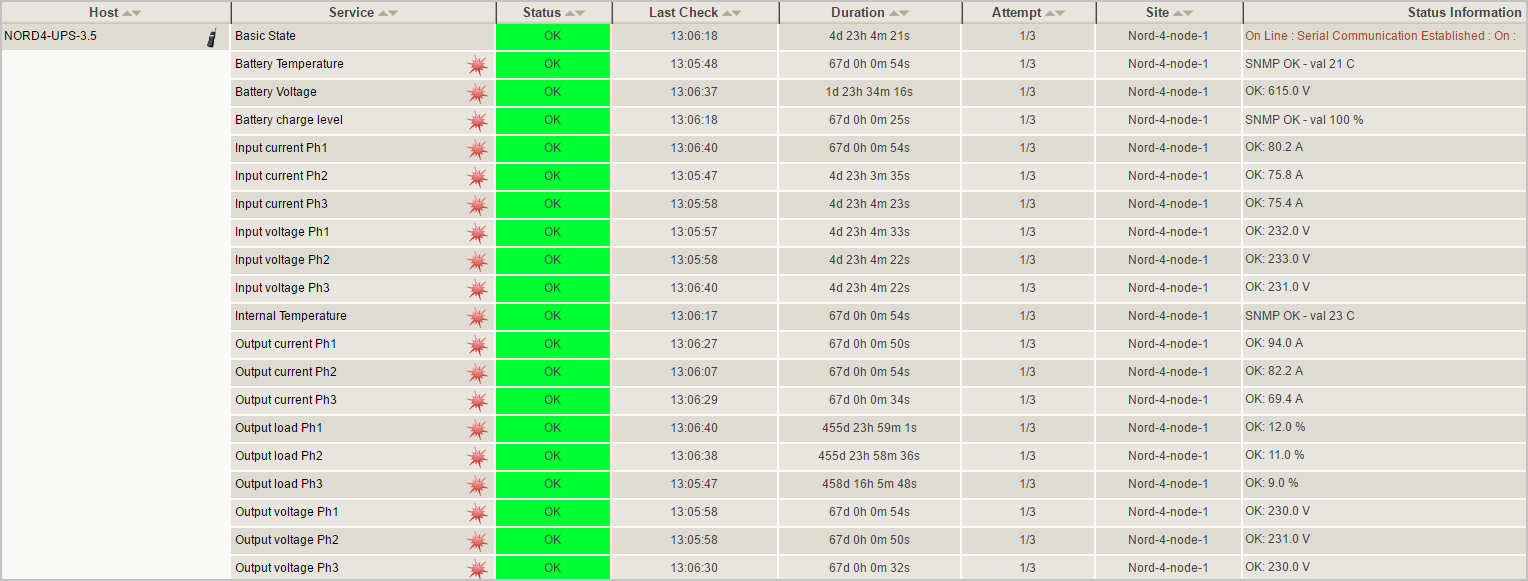
The parameters of the UPS in the monitoring system.
PDU monitoring allows you to record the loss of power on one or more beams in the rack with the equipment. It is enough to use a PDU with the ability to poll via the SNMP protocol. PDU with management and specialized software is also possible, but in this case a separate interface will be added.
The same applies to the monitoring of rack-mount ABP.
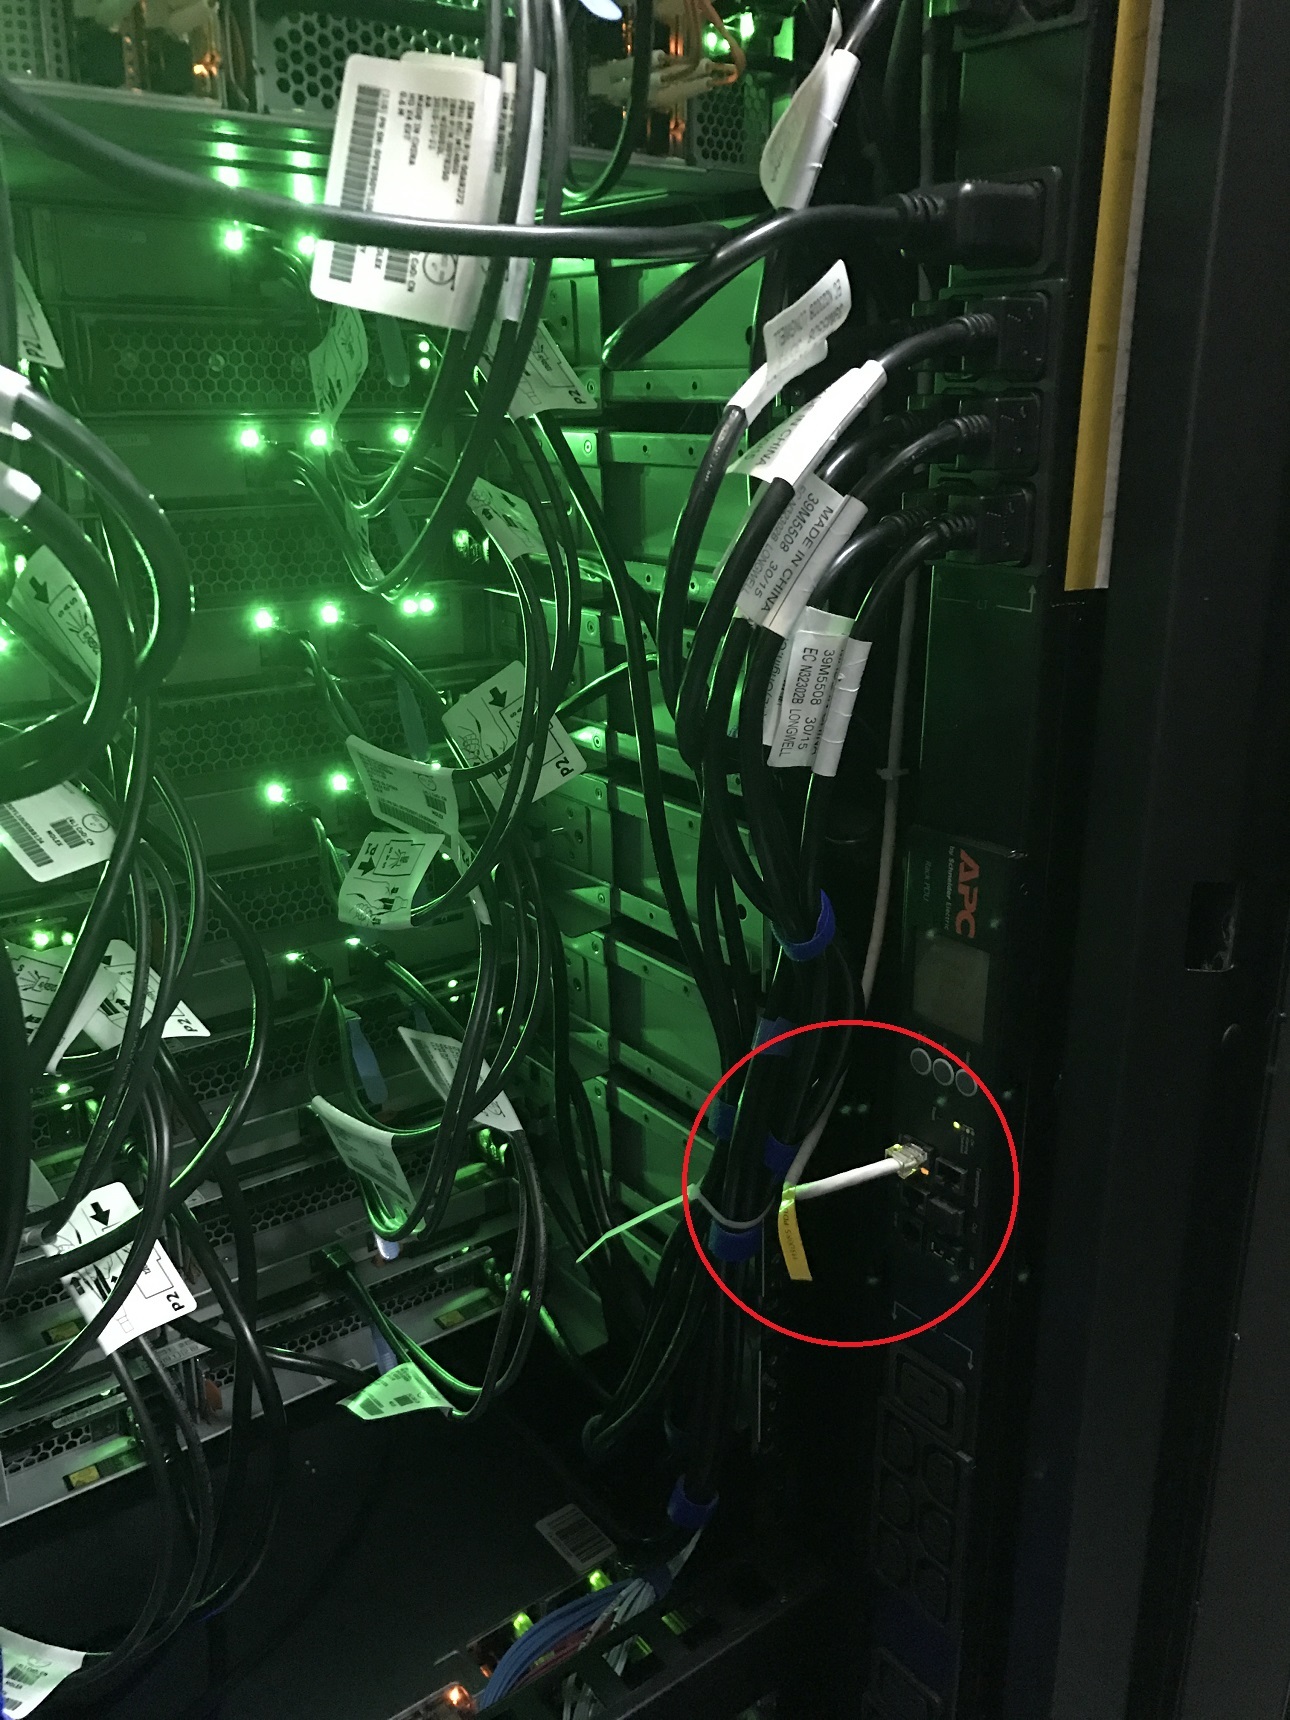
Connect the PDU to the monitoring system.
Based on the data received from network analyzers in distribution boards, UPS monitoring modules, PDUs, several derived parameters are calculated in the monitoring system.
Phase load. If the load is distributed evenly across the phases, then the power of the cable and the machines will be used efficiently. When one or two phases are overloaded, and one or two are underloaded, the so-called phase distortion occurs. This will, at a minimum, mean that the available power is not optimally used. In the worst case, this will lead to the disconnection of the machine and overheating of the cable.
Phase load in the monitoring system
Paired loads on two rays. In our data centers, the reserve power supply system 2N.
Each rack fits two independent power supply beam. And if something happens to one of the power rays, the other takes on the load of the failed. It turns out that each beam should be loaded only half of the rated power. Only in this case, the remaining beam in the system will withstand double the load.
To do this, we monitor that the load on one beam does not exceed more than 50% of the nominal, and the total load on two beams - 100% of the nominal.
If you do not monitor this parameter, then you can “miss” the situation when we do not have a reserve for the second beam, since the pair load exceeds the nominal power of the machine.
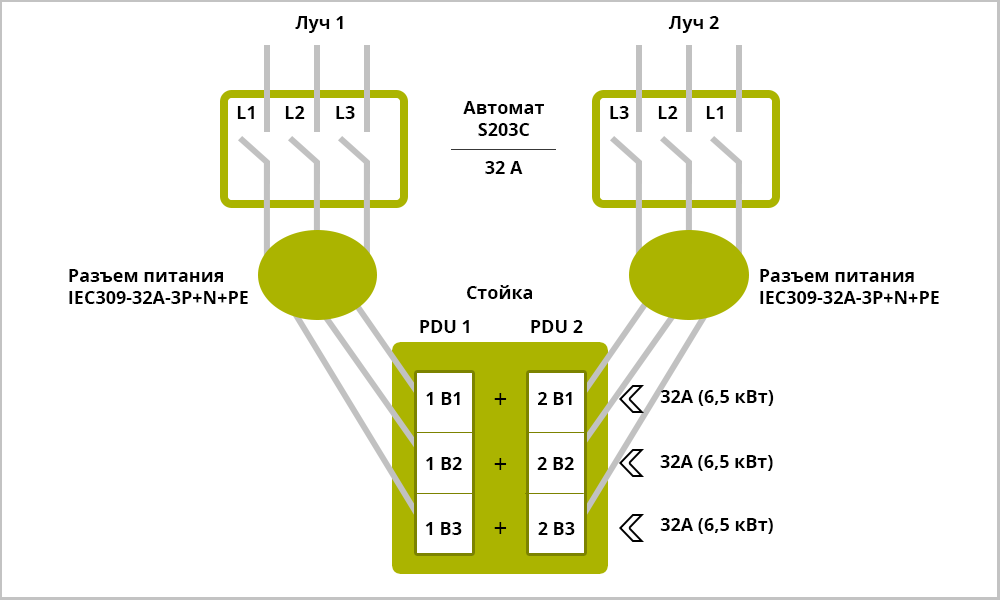
Both principles must be respected at the same time. Consider this in practice. Suppose we have a rack with a three-phase power supply of 32 A per phase. The equipment connects to two PDUs. Each PDU has three sections (B1, B2, B3), each section corresponds to a phase, i.e. we are dealing with a three-phase PDU. If we follow the above rules, it turns out that the total load on the two beams should be below 32 A (see the figure below).
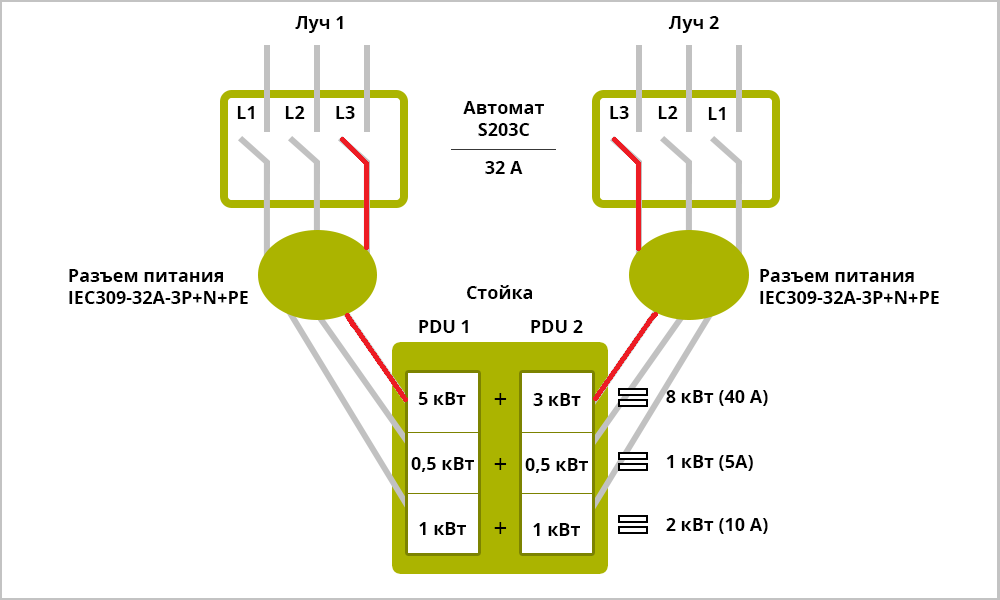
It seems everything is clear, but let's consider this case. In the same rack, we connect the equipment (see figure below). It would seem that out of 19.5 kW (three sections of 6.5 kW each), we have only 11 kW occupied, and we can sleep in peace. But at some point we have one beam off, and the entire stand is left without power. The following has happened. We overloaded the first section (phase) on one of the beams. The total load was greater than nominal. When one of the beams took over this excessive load, the machine dismounted.
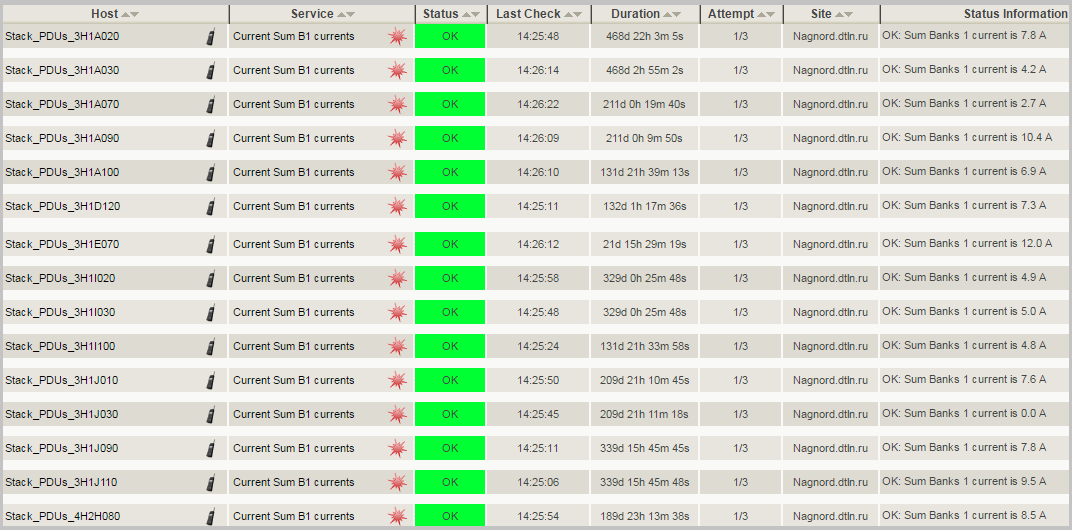
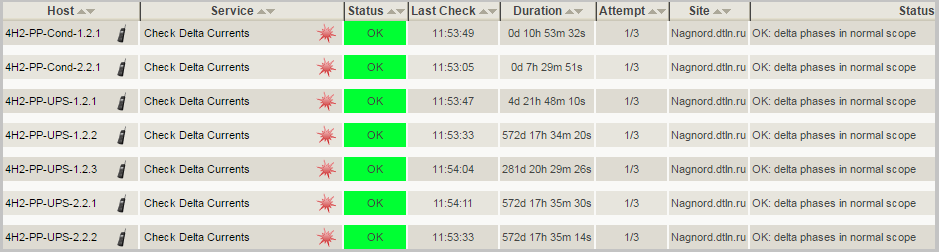
Paired loads on the first PDU section (B1) in the monitoring system.
So pair load is measured at the level of the rack. By the same principle, we track:

Paired loads on the UPS in the monitoring system.
On this stop. Ask questions in the comments. If you have questions about load balancing in racks or switchboards, write in the comments, in a personal or on consulting@dtln.ru .
In the next article we will talk about the monitoring of cold supply .
More articles about monitoring and power supply in the data center:
Part 1. Monitoring of engineering infrastructure in the data center. Highlights
The path of electricity in the data center
How to test the DSU in the data center
Part 2. How is the monitoring of power supply in the data center.
Part 3. Monitoring of cold supply by the example of the NORD-4 data center.
Part 4. Network infrastructure: physical equipment.
We continue a series of articles about the work of engineering infrastructure monitoring systems in our data centers. In the first part we have analyzed theoretical points, today we turn to practice. Let's start with the most critical system - power supply. Before reading we recommend refreshing knowledge about the power supply device in the data center.
One of the schemes for monitoring the power supply system in the OST-2 data center.
')
Features of power system monitoring
The monitoring of power supply has its own nuances. Here are some general tips for those who are just going to design and customize the system.
Monitor everything you can. There are no unimportant areas in the power supply system. Track the basic parameters of each element of the system: from transformer to PDU in the rack.
Monitor the system as a whole. It is not enough just to put all the equipment on monitoring. It is important to display the existing relationships between all elements of the system. This will help to quickly identify problems and not get confused in dozens of error alerts.
Circuit diagrams, maps and other visualization is best suited for these purposes. The picture at the beginning of the post is just an example of such a scheme. When power is lost in the rack, it will be easier to understand what caused the accident using such schemes.
Survey equipment as often as possible. Frequent polling will help not to miss important events in the life of the energy supply system: disconnection of the city power supply, errors that the diesel-gas plant did not cause. Such critical nodes as the main switchboard, diesel generator set, UPS, we recommend polling every second.
Monitor phase balancing and paired loads . These are derived indicators of the power supply system. They are calculated directly in the monitoring system on the basis of information received from the equipment.
Collect statistics. Only online data and alerts are not enough, you need to collect long-term statistics. It is useful for many things - from capacity management (capacity management) to the calculation of the budget for the purchase of spare parts.
A few words about our monitoring
The system works on the open-source Nagios solution. It collects equipment parameter values and sends notifications when threshold values are reached. Total 8 stands deployed with Nagios.
Information on 7 data centers and all monitoring systems is collected in a single interface based on Thruk .
Web interface Thruk .
We build statistics and graphs based on it using the built-in Nagios and Cacti services.
Another way of presenting information is schematic diagrams. Such a tuning process structures and simplifies the perception of a large amount of data. A complete picture can be obtained at a glance at the monitor.
Scheme for monitoring the power center and machine rooms of the NORD-4 data center.
Let's see what, how and on what equipment you can track.
Transformers
Under high load, the transformers heat up. If overheating occurs, protection will operate and the transformer will turn off. Thanks to monitoring, we can track overheating in time and take the necessary measures.
If the transformer has not yet been commissioned, then thermoelectric pyrometers can be installed on the case. In already working transformers we use remote infrared pyrometers.
This is how infrared pyrometers look.
Inputs at the main switchboard
Monitoring at this site of the system gives us information about the availability of power from the city and its characteristics for current and voltage.
From each transformer, three copper buses come to the main switchboard (MSB). To obtain data on currents and voltages, a current transformer is installed on each bus. Its primary winding is connected to the bus, and the secondary winding is closed to the measuring device - network analyzer .
Similarly, the current transformer is mounted on the bus in the DGU board.
Black rings on copper tires - these are current transformers.
The network analyzer is attached to the switchboard door.
The monitoring system polls network analyzers using the ModBus protocol. The data goes to the monitoring server and is displayed in a single Thruk web interface.
Connection diagram of network analyzers to the monitoring system.
In a similar way, monitoring is arranged in the remaining switchboards (W). For each section of the ShchR, a separate analyzer is installed, and the total - for the entire ShchR.
Current transformers in the distribution room of the machine room.
Network analyzers in the distribution room of the machine room.
From network analyzers we get about 20 parameters. Here are the main ones:
- phase current;
- linear and phase voltage;
- frequency;
- power active, reactive and full.
Some parameters for MSB in the monitoring system.
All the main parameters for MSB are displayed on schematic diagrams.
Guaranteed power supply
According to this system, we monitor the state of the DGU boards, fuel tanks and, of course, the DGU themselves. The monitoring system receives data from diesel power stations from the DGU control panel.
DGU control panel.
Connection diagram of the DGS to the monitoring system.
The main parameters of the DSU:
- state: in auto mode, in work;
- the number of revolutions of the engine per minute;
- the presence of errors in the work.
Be sure to monitor the level of fuel in the DGU tanks so as not to be left without fuel at the X hour. The equipment of many tanks already includes mechanical fuel level sensors that are only suitable for visual monitoring: you need to go to the tank to see how much is left there. This is also an option, but to get rid of the human factor and automate the process, use digital sensors.
List of the main parameters of the DGS in the monitoring system.
Uninterrupted power supply
If the UPS has a module for remote monitoring, then data collection is not difficult: just set up a survey of bespereboynik via SNMP protocol.
UPS from the inside. Red is the monitoring module that connects to the monitoring server.
The main parameters monitored are:
- operating mode: powered by city / DGU, powered by batteries, bypass operation;
- voltage and currents at the input and output of the UPS;
- UPS internal temperature.
Usually, the UPS can monitor the battery parameters (batteries):
- battery voltage;
- battery charge level;
- battery life assessment;
- battery temperature.
The parameters of the UPS in the monitoring system.
PDU and AVR Rack Monitoring
PDU monitoring allows you to record the loss of power on one or more beams in the rack with the equipment. It is enough to use a PDU with the ability to poll via the SNMP protocol. PDU with management and specialized software is also possible, but in this case a separate interface will be added.
The same applies to the monitoring of rack-mount ABP.
Connect the PDU to the monitoring system.
Derivative parameters: phase and beam load balancing
Based on the data received from network analyzers in distribution boards, UPS monitoring modules, PDUs, several derived parameters are calculated in the monitoring system.
Phase load. If the load is distributed evenly across the phases, then the power of the cable and the machines will be used efficiently. When one or two phases are overloaded, and one or two are underloaded, the so-called phase distortion occurs. This will, at a minimum, mean that the available power is not optimally used. In the worst case, this will lead to the disconnection of the machine and overheating of the cable.
Phase load in the monitoring system
Paired loads on two rays. In our data centers, the reserve power supply system 2N.
Each rack fits two independent power supply beam. And if something happens to one of the power rays, the other takes on the load of the failed. It turns out that each beam should be loaded only half of the rated power. Only in this case, the remaining beam in the system will withstand double the load.
To do this, we monitor that the load on one beam does not exceed more than 50% of the nominal, and the total load on two beams - 100% of the nominal.
If you do not monitor this parameter, then you can “miss” the situation when we do not have a reserve for the second beam, since the pair load exceeds the nominal power of the machine.
Both principles must be respected at the same time. Consider this in practice. Suppose we have a rack with a three-phase power supply of 32 A per phase. The equipment connects to two PDUs. Each PDU has three sections (B1, B2, B3), each section corresponds to a phase, i.e. we are dealing with a three-phase PDU. If we follow the above rules, it turns out that the total load on the two beams should be below 32 A (see the figure below).
It seems everything is clear, but let's consider this case. In the same rack, we connect the equipment (see figure below). It would seem that out of 19.5 kW (three sections of 6.5 kW each), we have only 11 kW occupied, and we can sleep in peace. But at some point we have one beam off, and the entire stand is left without power. The following has happened. We overloaded the first section (phase) on one of the beams. The total load was greater than nominal. When one of the beams took over this excessive load, the machine dismounted.
Paired loads on the first PDU section (B1) in the monitoring system.
So pair load is measured at the level of the rack. By the same principle, we track:
- paired loads in the sections of the switchboards of machine rooms;
- paired loads on the schR in general;
- paired load on the UPS.
Paired loads on the UPS in the monitoring system.
On this stop. Ask questions in the comments. If you have questions about load balancing in racks or switchboards, write in the comments, in a personal or on consulting@dtln.ru .
In the next article we will talk about the monitoring of cold supply .
More articles about monitoring and power supply in the data center:
Part 1. Monitoring of engineering infrastructure in the data center. Highlights
The path of electricity in the data center
How to test the DSU in the data center
Source: https://habr.com/ru/post/324610/
All Articles