Badoo time-series storage: so she was called Cassandra

Hi, Habr! My name is Evgeny Guguchkin, I am a Badoo developer on the Platform team.
Our team is working on interesting and necessary tasks. One of them is the development of a distributed time series repository, in the decision of which I was directly involved.
We recently completed a large and complex phase, and we wanted to share with you our successes, to tell why we were engaged in this task and what results we achieved.
Why do we need a time series repository?
Imagine a system with complex behavior, consisting of many components and connections between them. To assess the state of this system, deviation from the norm, the reason for this deviation is a non-trivial task. Badoo is one example of such a system. We collect and store the values of a huge number of metrics, the bill goes to hundreds of millions. And it is vital for the company, because it allows you to detect problems in the early stages and quickly find the sources of these problems.
In order to have the fullest possible picture, we collect quite a few different metrics, ranging from purely technical, related to the profiling of the code and components of our architecture, and ending with a lot of “product” metrics.
We have to save this big data stream. Where? Right! In the time series repository.
We currently store over 300 million metrics, updating them at a speed of about 200,000 values per second. This data occupies 16 TB on 24 servers.
What kind of storage we have used so far
For many years now, we have been using RRDtool , a set of utilities for working with time series. Despite the fact that it was created 18 years ago and has not been developed for a long time, it has its advantages:
- "Out of the box" can draw graphics;
- can make calculations on the fly with time series;
- the volume occupied by one metric does not change no matter how much data is written there.
The last property is especially important for us, and I will tell you more about it. Each metric is stored in a separate file in the RRD format. The file contains special structures: circular archives.
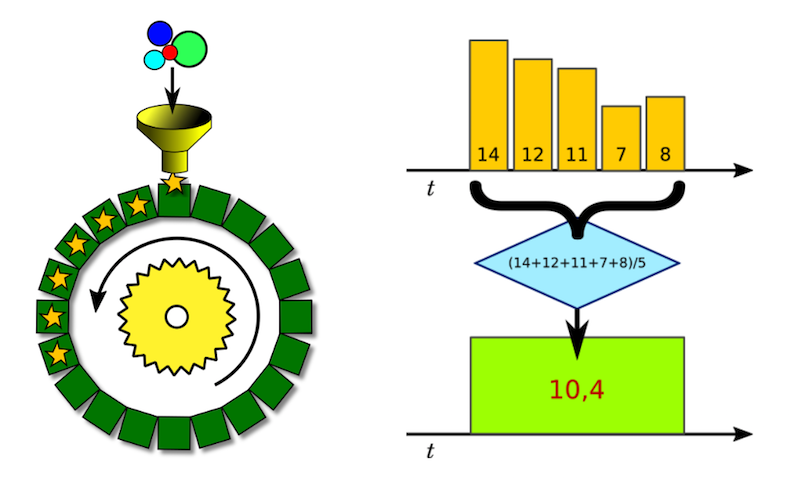
We can imagine the ring archive as a fixed set of cells, each of which stores one value for a certain time interval.
Suppose the time interval covered by a cell is five minutes, and our aggregation function is the calculation of the arithmetic average. This means that the cell will contain the sum of all the measurements that fall into our five-minute divided by the number of these measurements.
This process is shown schematically in the figure above. We call it downsampling, because with its help we lower the level of data detail.
Since we want to see recent measurements with good detail, we store several circular archives for each metric. And even in this case, reducing the level of detail gives us a significant savings in disk space.
In general, over the years of using RRDtool, we have evaluated:
- high reading speed: RRDtool is written in C, reads data from a local disk, performs all calculations and immediately sends the finished image in PNG format; it is unlikely that any other solution will surpass it in speed of the request;
- no need to think about all the nuances associated with looping and aggregation: RRDtool does everything by itself, we just send data there;
- Controlled dataset size: we only need to know the number of metrics and do not need to take into account the frequency of measurements.
Why do we think about the new repository? It's time to talk about the shortcomings and problems that we faced.
Why we needed a new repository
Inefficient disk usage
Apparently, the developers of RRDtool did not expect to write large amounts of data, because already when updating 300 metrics per second we begin to rest on the disk.
The reason is, firstly, that read before write is used, that is, with each update, it is necessary to read the metrics file from the disk and write a new version or part of it.
Secondly, such an operation is performed with each metric. This means that for three hundred metrics we have, respectively, several hundred disk operations with random access per second.
To solve this problem, we use a special rrdcached daemon, which buffers several incoming values of one metric in memory, say, ten minutes and then writes them in one iteration. So we were able to reduce the number of disk operations by an order of magnitude and, consequently, increase the throughput.
The next step was the use of SSD, which also gave a tenfold increase in bandwidth to write.
As a result, we achieved a record of 30 thousand records per second. Nevertheless, due to the above features of RRDtool on our rrd servers, we have:
- thousands of disk operations per second with random access and, as a result, high iowait: 15–20%;
- high write intensity, which ultimately leads to SSD wear;
- RAM consumption: in our configuration it is more than 30 GB for buffering, and more than 16 GB of OS allocates for inode cache (we have tens of millions of metric files in the file system).
Backup Issues
The incremental backups approach does not work with RRDtool: by sending one value to the metric, we change the entire file with the metric, and in the next backup we need to save the whole new version. And so for each of the tens of millions of metrics on the server. It takes so much time that we had to give up regular backups.
Local File Access
 This feature in itself is not a problem, as long as we are located on the same server and do not plan to scale horizontally.
When we stepped beyond the limits of a single server, we solved this problem in a conservative way: each application working with time series is written on a specific server and runs only where its data is stored.
 It works, although it causes inconvenience:
- each time you create a new application, you have to think about where it is better to “share it”;
- if suddenly your colleague at the same time chose the same server, a situation of "overpopulation" may arise;
- It is often necessary to transfer applications with all its data manually from server to server.
In the end, this approach has also exhausted itself: sooner or later, an application should appear, the data of which does not fit on one server. And this moment has come - an application has appeared, for which we have allocated a separate server, but the free space is rapidly ending. The score went on for days. Then we quickly made a relatively simple implementation for the distribution of writing and reading through a single entry point in the form of a REST API.
From the very beginning this decision was considered by us as temporary. However, we solved the tactical task: we removed the obstacles to growth. It worked, and in this form, the dataset of our application grew to six servers.
But this added new difficulties: not only did the temporary solution be inconvenient in operation and required improvements, a critical problem for us was added - low fault tolerance: when one node was stopped, the entire recording stopped. In addition, this repository inherited all the problems RRDtool, which I described above.
In general, at this stage it became obvious that a more suitable solution should be sought, devoid of these shortcomings.
And since we decided to look for a replacement, it would be nice to take into account a few more problematic points, a little less critical for us.
- I would like to be able to rewrite or append data in hindsight . RRDtool, for example, requires that each new metric value be over a time longer than the previous one. This makes it necessary to collect all the data in one place, arrange it by time and send it to the storage one by one. In addition, we are forced to reserve a certain time interval during which we are waiting for all the data to reach our central queue if possible.
- The problem with long names of metrics . Since in RRDtool we display the name of the metric on the file name, we rest on the limitations of the file system, where the full path of the file should not exceed 255 characters.
- Compactness . In the case of storage of sparse time series in the RRD format, the fixed file size turns to us with its ... dark side: even one recorded value reserves space on the disk as for a full metric.
In addition, we added such a requirement as longevity , since, as it turned out, some of the solutions in question under certain conditions lose the data stored in them.
What alternatives have we considered
So, we have compiled a list of requirements and evaluated the most popular open-source solutions in this subject area. Here's what we got:
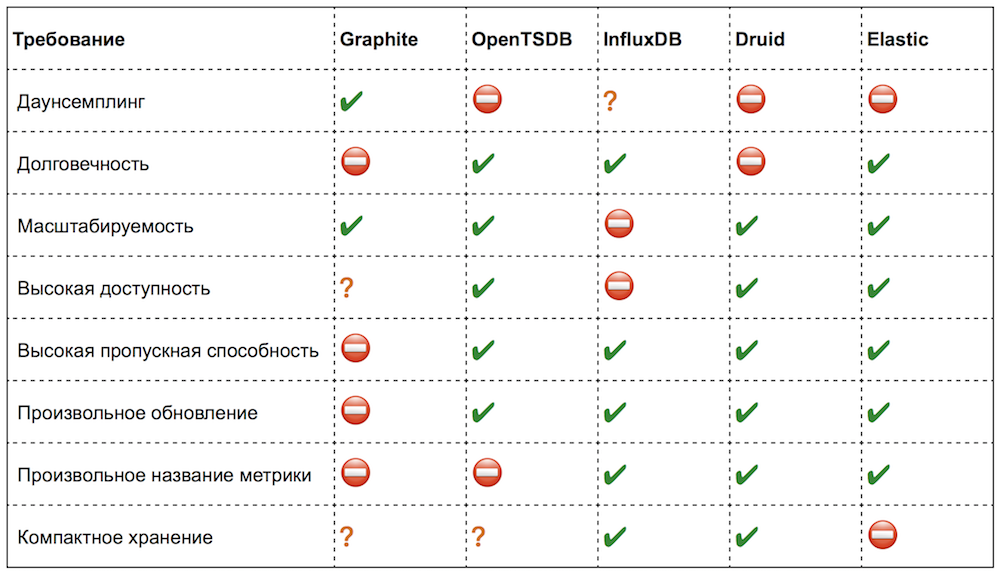
In fact, it is not always possible to clearly determine compliance with a particular requirement (where the situation is ambiguous, I put a question mark).
Personally, I really liked the solutions that we considered. In all there are interesting ideas and just convenient features. But now I will not dwell on them in detail, but I will try to identify only points that are important for us and critical shortcomings.
Graphite
It has most of the drawbacks of RRDtool, besides it consumes a lot of CPU. But the main complaint - Graphite "silently" loses data when it lacks resources, if, for example, it does not have time to process or write.
OpenTSDB
With all the advantages of this solution, it also has a number of annoying restrictions:
- no downsampling during recording and storage;
- the inability to understand which metrics (and how many) are written into it;
- restrictions on the names of metrics;
- the lack of a simple way to remove a metric (and we regularly delete obsolete ones);
- a request to get the last metric value leads to scanning data on the disk and is very inefficient;
- restrictions in the mass reading API and, as a result, difficulties in the implementation of downsampling.
And all these problems are not due to architectural constraints, but simply unfinished functionality.
InfluxDB
This solution seemed perfect. Only one, the most important point was missing - it did not scale out of the box. However, its open-source version does not scale even now: the authors worked on clustering for more than a year and eventually decided to close this functionality. A pity, we very much hoped ...
Druid
When we got to know him, it was not so much a service as a framework. Besides almost without documentation. To get from him what we wanted, perhaps, would have to append or rewrite some of its parts.
Elasticsearch
Elasticsearch is actually a slightly different product. But lately, functions for analytical queries have appeared in it. In general, he proved that he copes with the task of storing "raw" data, but at the same time he demanded four times more disk space and consumed five times more CPU than OpenTSDB. And we also faced a strange feature: the more shards in the index, the slower it works on writing (although common sense dictates that it should be the other way around).
As a result, none of these solutions out of the box satisfied our requirements. It was necessary either to continue the search, or to “take up the file” in order to achieve the desired.
Cassandra. Why did we choose her
It must be said that we were particularly interested in the two solutions from the table, so we integrated these storage facilities at the level of proof of concept into our framework for testing in real applications on real workload.
Speech about InfluxDB and OpenTSDB. Unfortunately, InfluxDB was dropped after the developers refused to support clustering in the open version, and OpenTSDB did not support downsampling and some other necessary functions that we already mentioned (deleting metrics, getting the last value, etc.).
However, OpenTSDB showed very good performance, scalability, fault tolerance. In general, the most important points in our table.
If to understand, OpenTSDB is a “wrapper” over the distributed Apache HBase DBMS, which adds REST API access and is able to pack data for the DBMS accordingly. All the qualities we like are provided by the distributed DBMS, and all the missing functions are easily implemented on top of it.
When we finally realized that a suitable repository does not exist, we decided to make it ourselves by analogy with OpenTSDB based on a distributed DBMS, adding circular archives there, as in RRDtool.
But now we have a choice of distributed DBMS. This time we did not conduct a large-scale study, but limited ourselves to comparing the already mentioned Apache HBase and another distributed DBMS - Apache Cassandra . Both databases are based on the Google Bigtable data model. Apache Cassandra also borrowed some ideas from Amazon DynamoDB , which only benefited it.
As usual, each option has both advantages and disadvantages. Nevertheless, both of them are able to cope with our task. How did we choose between these DBMS?
In my opinion, every story of choice is always a little subjective story. Nevertheless, I will try to justify our choice. The table below lists the differences that influenced our decision. It would be wrong to say that these are HBase drawbacks — no, just features that need to be kept in mind when developing.
| Cassandra | Hbase |
|---|---|
| No dependencies | Wanted ZooKeeper and Hadoop |
| Easy setup | Need to configure all components |
| CQL query language | Cumbersome API |
| Decentralized | There is a master node - SPOF |
| Uniform load distribution | Hotspot problem |
| Materialized views | Application-side implementation |
| Secondary indexes | Application-side implementation |
| Logged batches | Application-side implementation |
| Productive driver for PHP 7 | PHP Thrift Client |
As you can see from the table, working with Cassandra is simpler and more convenient on many points. This is a simpler installation, configuration, and its own query language, and good documentation. Unlike HBase, Cassandra does not have a master node and, accordingly, does not need to duplicate it to ensure high resiliency. With Cassandra, it is not necessary to ensure that the data is distributed evenly among the nodes, while in HBase there are possible distortions in the load, and the application itself must monitor how the data is distributed. Not the last role was played by the presence of a driver for PHP 7, which we then switched to.
How we store time series in Cassandra
A detailed description of Apache Cassandra would not fit into the whole article. In addition, the Internet has a sufficient amount of good materials on this topic, including on Habré. However, some common points are worth mentioning.
- The data in Cassandra is distributed in a cluster in such a way that each record has copies on its neighboring nodes. The number of copies of the record (replication factor) is a configurable parameter.
- In the event that one of the nodes becomes unavailable, both read and write requests continue to be serviced by neighboring nodes containing replicas of the unavailable node.
- Adding new nodes occurs without downtime. Data is automatically redistributed across the cluster.
- Productivity increases linearly with increasing cluster size.
- LSM-tree is used for data storage - a structure that provides very effective data update and insertion of new records.

- For access to data, Cassandra offers a tabular data model and CQL query language, but this is all syntactic sugar, but in reality, the key-value model lies under the hood. But unlike the simple key-value-model, where both the key and the values are of type BLOB, in Cassandra value is a structure, namely, an associative array, ordered by key value. Wherein:
• you can change and add one or more elements of such an array at a time;
• elements of each such associative array are stored on the disk as consistently as possible;
• this allows very efficiently, in one access to the disk, to receive both one element of the array and the range of values, and, of course, the entire array as a whole.
It is precisely at the level of this key-value-model that I will try to explain on the fingers how we implemented the storage of time series.
 First, let's look at the storage of primary, non-aggregated data. They consist of the name of the metric and its values. Each value is a pair of timestamp: double. Put this data in the Points table.
As you can see, this structure fits very well on the internal presentation of data in Cassandra. But there is one caveat: so we can easily exceed the constraint of Cassandra on the size of the associative array. Formally, this is 2 billion, but in practice it is better not to exceed 100 thousand.
 This restriction is easily circumvented by sharding the data of one metric by day. In the name of the key, the date is added to the name of the metric. Now the metric values will be stored in several associative arrays - one for each day. Let's call these shards with primary data daily segments, or simply segments. If you write values to the metric every second, then the size of the segment will not exceed 86,400 values.
 With the primary data, it seems, everything is clear. But remember, we wanted to store historical data in the form of aggregated circular archives. This data will be stored in the new table Rollups.
Here we will have a complex key. , . , , RRDtool: , .
:
- the key is the K cell number calculated by the formula
K = floor(time % retention / granularity); - value - a tuple consisting of a pair: the time corresponding to the cell, and the actual value of the cell.
As a result, the data of one metric were scattered in different tables and keys. The metric has primary data in several segments and several archives with different details.
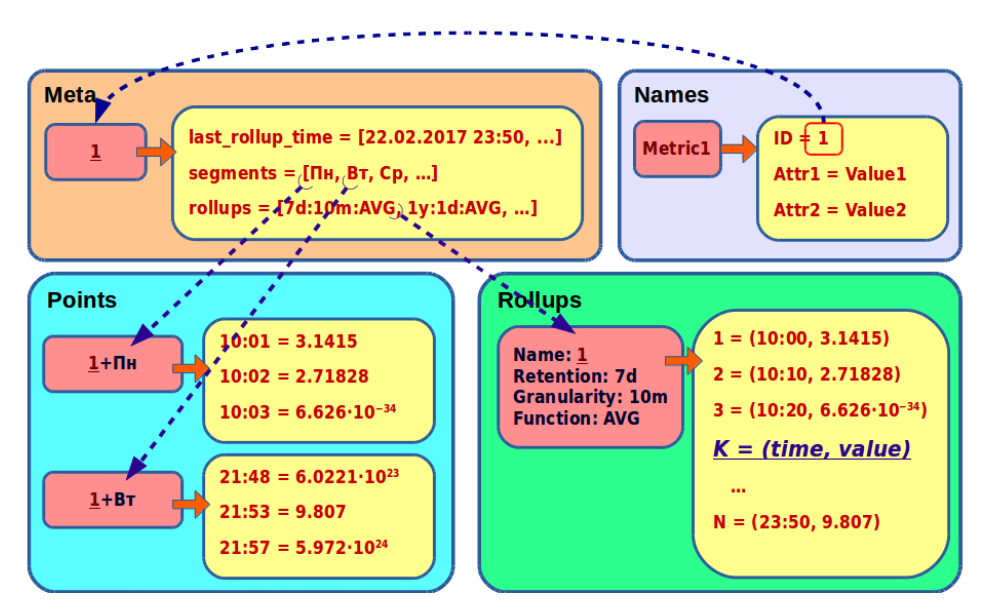
To read all the metrics, you need to know its keys - what are its segments and archives. We will collect such information in a separate Meta table.

Here by the name of the metric we store:
- a list of its segments;
- a list of its archives;
- the oldest cell among all the metrics archives (on the timeline, this can be represented as the right border of the archived data; with its help, we can always calculate the left border and choose the most suitable archive corresponding to the query).
You may notice that the name of the metric is included in all keys. This complicates the operation of its renaming and increases the consumption of disk space, because the metrics we have are really long, with an average of at least 100 characters. We decided to use an identifier instead of a name and store it in a separate Names table.
Now we just need to create a new entry in the Names table - and we renamed the metric. In addition, in future, it will be possible to assign attributes to metrics and make complex sampling of metrics by the values of these attributes.
Data overwriting and downsampling
We decided to store both primary and aggregated data. Primary, in the Points table, are stored for several days, after which whole segments are aggregated and sent to the archive. This allows us on the one hand to overwrite data in hindsight (although only within the last seven days), and on the other - to store data in a compact archive.
We have high demands for downsampling performance. To keep up, you need to process 700 metrics per second, or more than 60 million per day. That is how many segments we create per day at the moment. How to ensure this and not load disks? Cassandra allows you to sequentially scan the entire table or some part of it. And due to this, it is possible to avoid ineffective random access to the disk. With current volumes, we can subtract all the raw data in six to eight hours in several streams. Due to this, the maximum performance of our downsampling is 170 million daily segments per day.
Reading data
The read request contains the following parameters:
- metric_name is the name of the metric;
- start - the beginning of the requested interval;
- end - the end of the requested interval;
- func - aggregation function;
- step - the step of detailing.
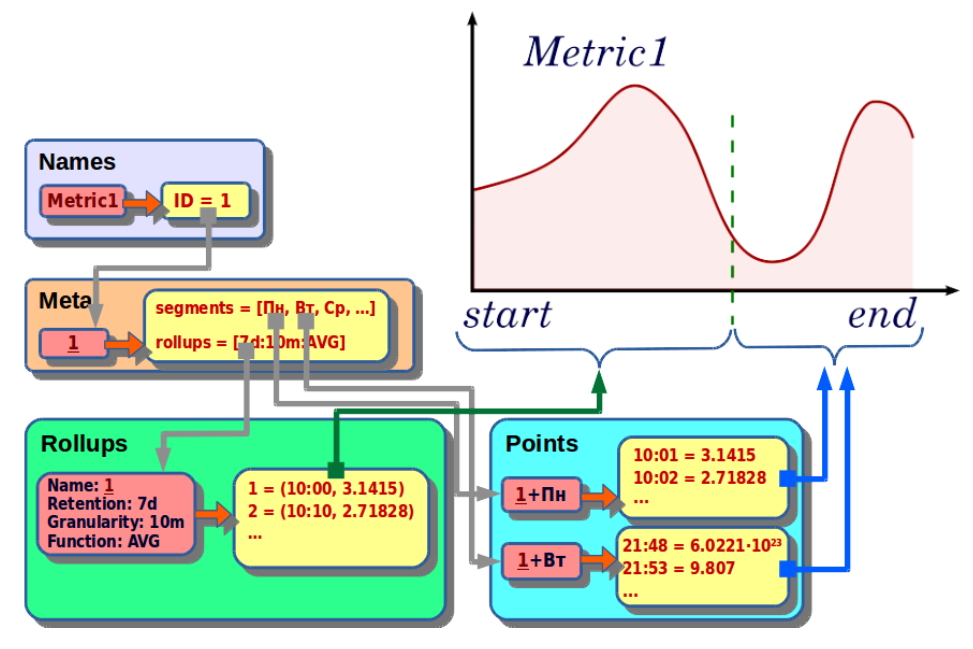
This request is executed by the following algorithm:
- By the name of the metric we find the identifier.
- By identifier we obtain meta information about the metric: a list of segments, a list of archives and the maximum time of archives.
- We select the appropriate archive in such a way that it corresponds to the aggregating function, covers the requested time interval and has the appropriate granularity.
- Select the segments included in the desired interval.
- Archives and raw data are combined and resampled with the detail step we need.
- At the output we get a set of metric values from start to end with step step.
REST API
To be able to write to our repository not only from PHP, we have accessed it through the REST API. And implemented it, of course, on our favorite nginx and PHP.
The important point is the use of the cache, where we store the identifiers of the metrics by their names. We need a fast cache, from where we plan to read more than 200 thousand times per second. We use APCu cache .
To prevent the REST API from becoming a bottleneck, we made it distributed. And in order to increase the hit rate and make the use of the metrics cache efficient, we assign the metric to a specific server by its hash.
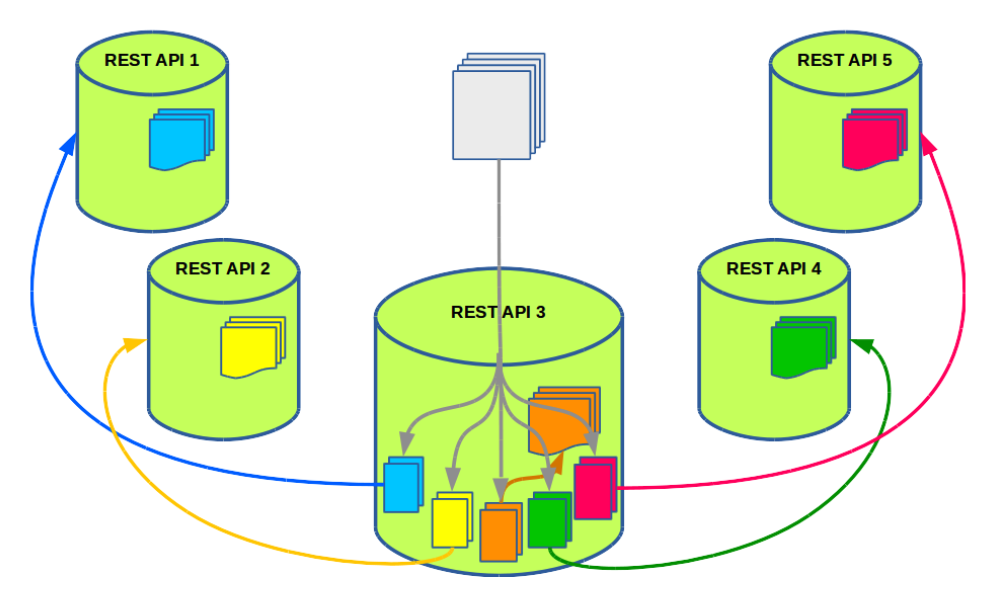
For the client, all nodes are the same, and it is not necessary for him to know about the binding of the metric to the server. How are requests processed in this case? Let's look at the example of five nodes.
The client selects one of the five nodes of the REST API cluster randomly. Suppose a node request for writing 100 metrics comes to node 3. On the server, these 100 metrics are grouped into five subqueries. So in each group there are approximately 20 metrics assigned to one server. Subsequently, these subqueries are sent to their neighboring nodes.
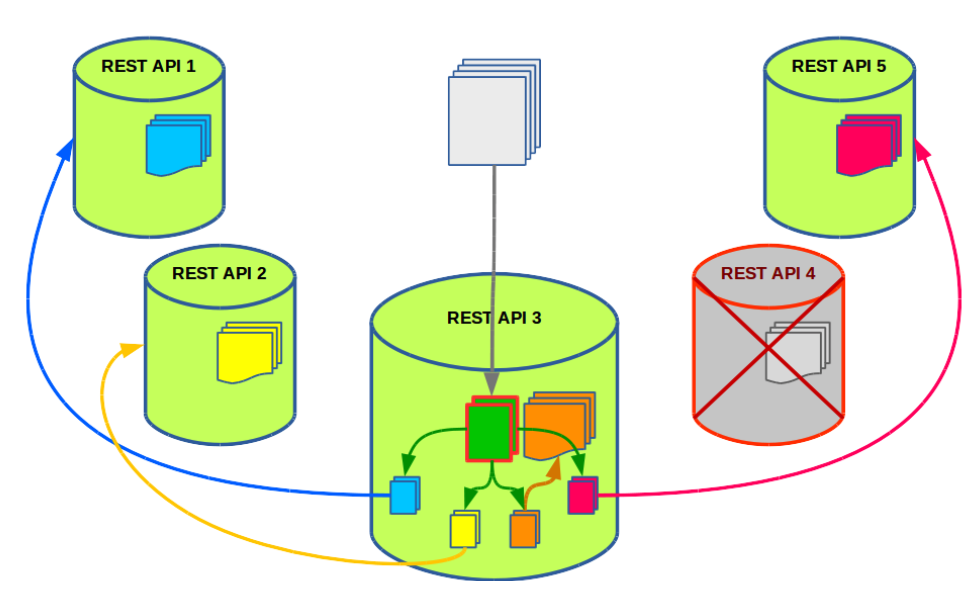
In such a scheme, when the metric should be processed only on a specific node, we get a problem in the event of a node falling. That is, it is not enough for us to have fault tolerant storage — we need a failover cluster of REST API nodes.

In our case, this is not difficult. We implemented a simple failover.
Imagine that node 4 is inaccessible. In this case, one of the subqueries remains unprocessed. And we can not stop processing and wait until node number 4 rises.
The solution is obvious: we repeat the procedure with the grouping of metrics imperceptibly for the client, but now only for one raw subquery, and distribute the subqueries only between the live nodes.
The data about native metrics is cached by nodes for a day, and the data about aliens for only one hour. Thus, the fall of one node does not particularly affect the hit rate: most metrics are still serviced by their nodes, and foreign metrics do not occupy the cache for a long time.
What results have we achieved
To date, we have transferred part of the data to the new storage. These are metrics of that application which dataset was not located on one server and for which we made an improvised cluster of six servers.
This is what we ended up with:
- The new cluster consists of nine servers;
- 180 million metrics are currently stored there;
- maximum recording capacity - 250 thousand per second;
- maximum downsampling speed –170 million segments per day;
- for the time series itself, we use a replication factor of two;
- data volume - approximately 9 TB;
- REST API cluster is located on the same servers as the Cassandra cluster.
Comparing the new storage with our RRD-cluster, we should separately mention such an indicator as the average size of the metric. Formally, all other things being equal, the average size of a metric in Cassandra is 30% less than in RRD storage. But the LSM trees used for storage in Cassandra require the reservation of free disk space for temporary files (for a process called compaction).
In our case, we have to reserve about 60% of the size of the dataset. As a result, the average size of the metric with this in mind turned out to be 20% larger than in the old storage. This can be seen as a price for performance and fault tolerance.
Summing up, we can say that our new solution for storing time series provides us with fault tolerance and scalability, while exceeding the old storage in performance. And most importantly - even with some reservations, but we have achieved almost all the goals we set for ourselves.
Unfortunately, within the framework of one article it is impossible to consider all the issues of implementation. So, we have not touched on issues such as consistency in reading and writing; how we manage without transactions, full support of which is absent in Cassandra; how we use materialized representations; what optimizations we plan to do; and many others. Perhaps this will be devoted to one of our next posts.
')
Source: https://habr.com/ru/post/324510/
All Articles