Factors Affecting Failures and Conversions According to Artificial Intelligence
Soasta provides a number of services for analytics and testing sites. The company's specialists used a huge array of data collected by their analytics system in machine learning in order to determine which relationships between different indicators will be found by artificial intelligence. Tammy Everts from Soasta and Pat Minan from Google presented the results at the 2016 Velocity conference in New York in September 2016.
The study was conducted in relation to the two end results of user interaction with the site - failures and conversions. That is, the researchers tried to teach artificial intelligence to “guess” with a high probability based on various signs whether the user would leave the page without performing any actions (failure), and whether he would perform a conversion.
Conclusion 1: Only a very limited number of parameters affect the failure rate.
Initially, researchers assumed that almost any parameter is important for prediction. It turned out to be wrong.
')
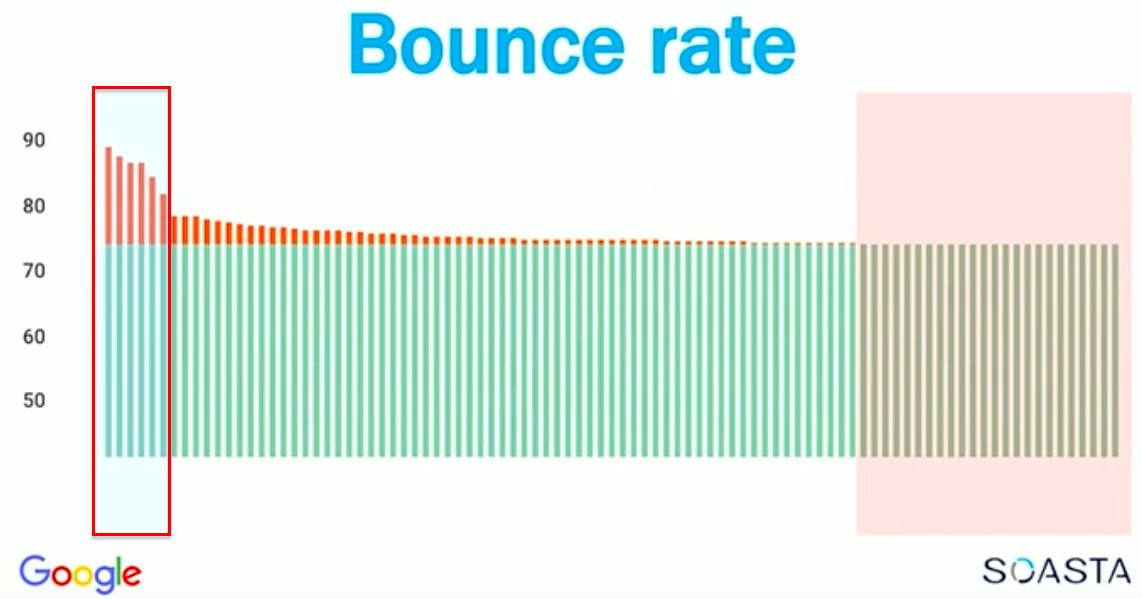
The graph below shows that for a given lower bound of the probability of predicting a failure of 70%, only knowing 6 factors significantly improves the accuracy of the forecast. A large number of factors do not significantly affect the quality of the forecast, and about a quarter does not affect them at all.
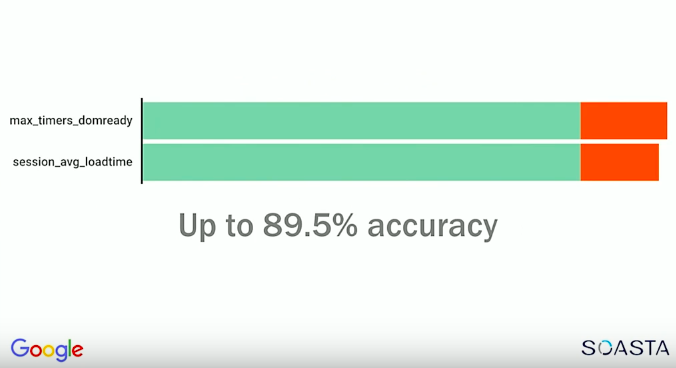
Conclusion 2: The speed of the occurrence of the DOM Ready event and the page load speed were the best predictors of failures.
Knowledge of these parameters made it possible, with a probability of 89.5%, to predict whether the user would fail on the page. The prediction accuracy never reaches 100%, and the 50% prediction probability is almost equivalent to a coin toss. Therefore, everything above 50% can be considered an “improvement in the forecast”, and 89.5% is a really good probability of the forecast.
The following graph shows the probability of a page crash depending on the speed at which the DOM Ready event occurs and the page loads.

Obviously, any site should aim to load no longer than 4 seconds, because a longer page load will lead to a very large percentage of failures.
Another important point: there is no lower limit of the download speed in terms of improving the percentage of failures. Starting from 5 seconds and further in the direction of reducing the download speed, the probability of failure decreases almost linearly.
On the 3rd place in terms of the impact on the accuracy of the prediction of failure was the speed at which the page began to appear (start render event).
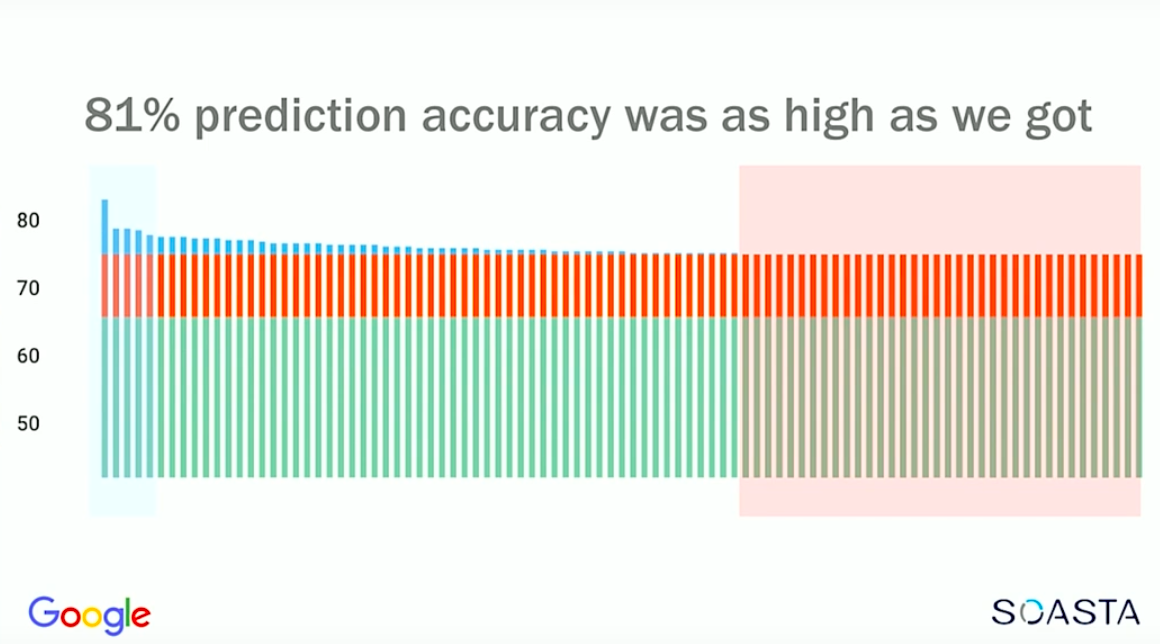
Conclusion 3: Predicting the conversion was more difficult. Maximum accuracy - 81%.
As shown in the graph below, 81% is the maximum accuracy achieved, with much more factors not affecting the conversion at all.
Conclusion 4: The more scripts on the page, the worse it converts.
In this case, the number of scripts is the number of elements beginning with the tag
<script> .The graph below shows the probability of conversion depending on the number of
<script> tags.
Conclusion 5: The number of DOM elements greatly affects the conversion.
As you can see from the graph below, pages with maximum conversion contain from 400 to 700 DOM elements.
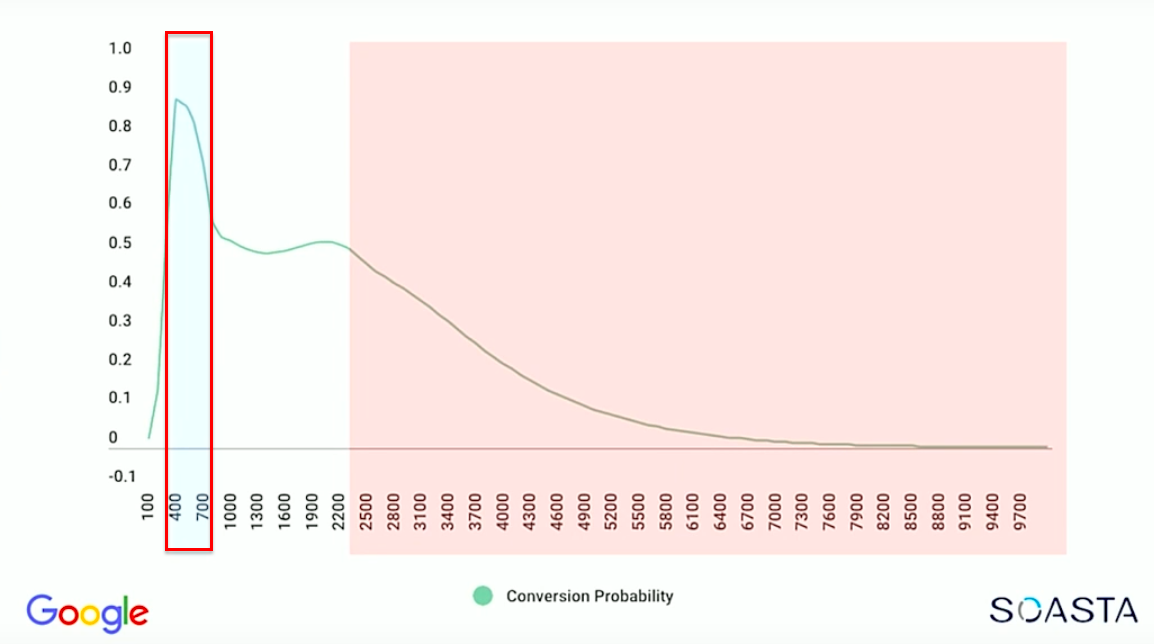
We can safely assume that the more overloaded the page becomes (more than 2,200 DOM elements), the worse it converts.
Conclusion 6: Indicators related to users of mobile devices are not predictors of conversion.
Parameters such as, for example, channel width, device type, or connection type for mobile users did not affect the accuracy of conversion prediction.

The researchers came to the following interpretation of these results. They believe that users do not divide the Internet into “mobile” and “normal” in their minds. They are accustomed to the fact that the pages load quickly, and therefore react in about the same way regardless of the device from which they view the pages.
Conclusion 7: not all results should be taken on faith.
Machine learning determines the relationship between different data points, but the results should be taken with caution and look for interpretations in cases where the result is contrary to common sense.
As an example, the researchers give a graph below, which shows that checkout pages with a server response time of 8 seconds convert the best.

However, this result rather indicates that the checkout pages just work relatively slowly. Typically, these pages contain various additional scripts, for example, card number checks that access external sources. And the decision of the user that he wants to buy some item was made much earlier - on the item card or on the landing page.
In conclusion, it is worth noting that these results were obtained according to data from Soasta customers. Perhaps in your case, the impact of these indicators on the percentage of failures and conversion will be different. However, it is difficult to dispute the fact that the acceleration of the site helps to reduce failures and improve conversion.
Source: https://habr.com/ru/post/324454/
All Articles