Tracking js errors with Metrics
Using the tracking system js-errors can not be overestimated. Even on the site covered by tests js-errors occur, it is important to find and fix them. I'll tell you how I was looking for a suitable solution.
There are three types of js error tracking systems.
First view
Samopisnaya system. Add a compact js-code to the site:
window.onerror = function(msg, file, line, col) { new Image().src = '/jserrors/?msg=' + msg + ...; } Make a "handle" to save errors, parsim logs. At the best, we write the interface for the analysis of errors. Then we are engaged in refinement and support.
Second kind
Paid service with advanced features, but with restrictions, for example, on the number of js-errors per day or month. It’s impossible to put this system on any website, every time you have to choose which of your websites is “worthy” of a paid service. And do not forget to pay for services.
You will need to add an external script to the site, which will adversely affect the speed of loading your site.
Third type
To use the analytics system for collecting errors, for this you need to install its full-fledged tracking code on the site.
Since the tracking code is loaded asynchronously, sending errors will be available only after it is loaded. This system should have reports that can be independently generated.
Decision
Combine the first and third species. Errors will be manually sent to Yandex.Metrica using a compact js-code. The Metric has the necessary reports and tools for data analysis, there are no special restrictions on the number of counters and data collected, and it is free.
To collect errors, the report “ Visit parameters ” is suitable.
Let's start a separate counter.
Add to the page in front of all the scripts compact code:
<script> // 320 . window.onerror = function(msg, file, line, col, err) { // . if (!window.JSON) { return; } var counterId = 12345, // . siteInfo = {}, pointer = siteInfo, // . path = [ 'JS errors', // 1 msg, // 2 err && err.stack || (file + ':' + line + ':' + col) // 3 // ? ! ]; // . for (var i = 0; i < path.length - 1; i++) { var item = path[i]; pointer[item] = {}; pointer = pointer[item]; } pointer[path[i]] = 1; new Image().src = 'https://mc.yandex.ru/watch/' + counterId + '/?site-info=' + encodeURIComponent(JSON.stringify(siteInfo)) '&rn=' + Math.random(); }; </script>Do not forget to specify your counter number (counterId) in the code.
- We get something like this report :
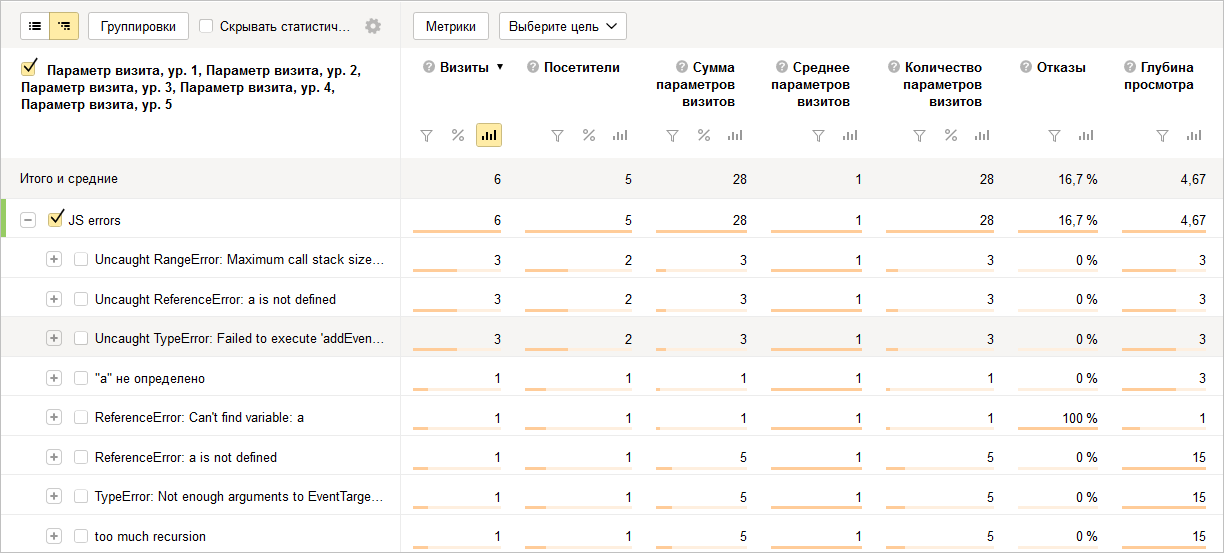
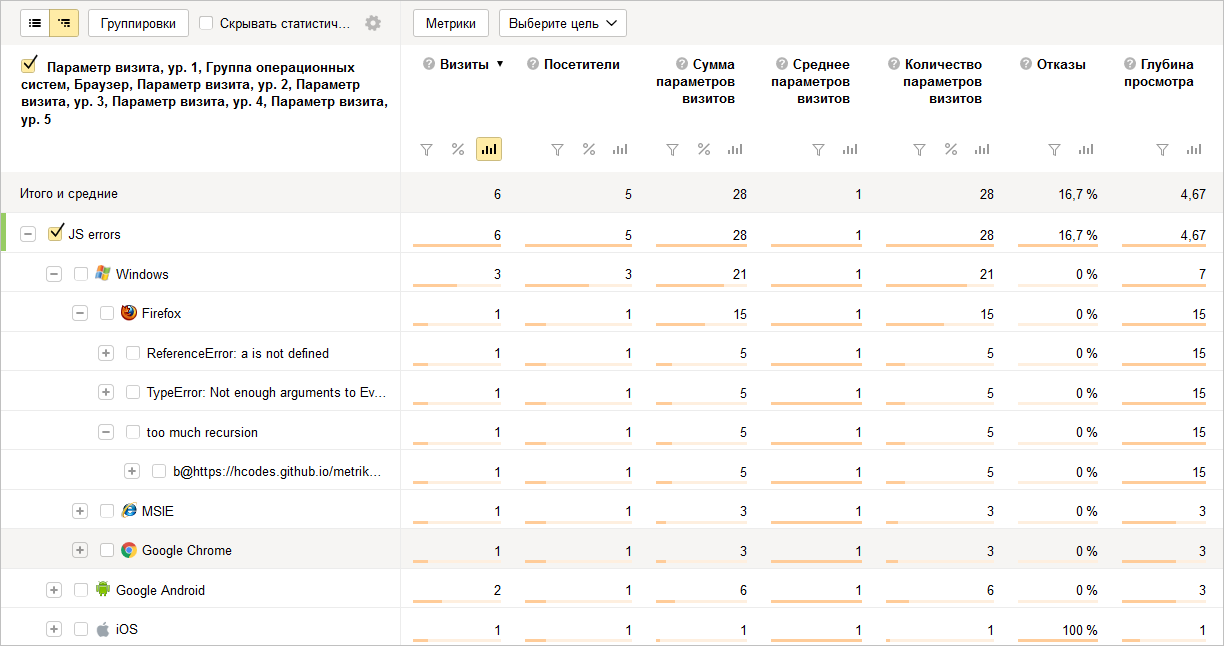
The structure and order of parameters in the report can be changed on the fly, as well as add new parameters. Let's add a browser and OS to the report using the “Grouping” button.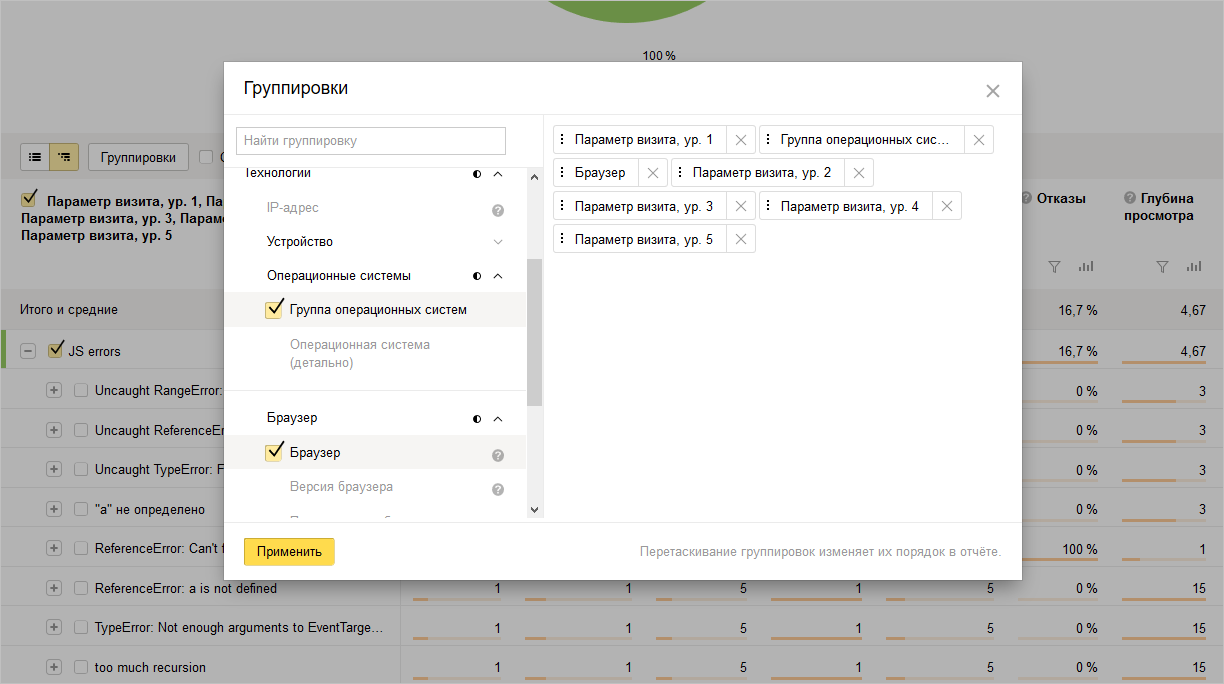
And one more thing, if the scripts on the site are loaded from another domain (CDN), then the report will most likely see messages like “Script error” and without a stack.
To return a normal view to messages, you need to add the crossorigin="anonymous" attribute to the scripts and the Access-Control-Allow-Origin:"*" HTTP header Access-Control-Allow-Origin:"*" .
<script src="https://mycdn.com/folder/file.js" crossorigin="anonymous"></script> Gradually, the report will contain errors from browser extensions, viruses, and external scripts (advertising systems, social networking buttons, etc.). To separate these errors, we will add check of the domain at scripts by means of the regular expression.
Additionally, add a limit on the collected number of errors (no more than 5) on the page. For example, the same type of errors that occur when moving the mouse, can create hundreds of requests to the Metric.
In modern browsers, we will send data via sendBeacon .
<script> window.onerror = function handler(msg, file, line, col, err) { if (!window.JSON || handler.count > 5) { return; } var counterId = 12345, // . siteInfo = {}, pointer = siteInfo, stack = err && err.stack, path = [ // , . 'JS ' + (!file || /mysite\.ru|cdn\.com/.test(file) ? 'in' : 'ex') + 'ternal errors', 'message: ' + msg, stack ? 'stack: ' + stack : (file ? 'file: ' + file + ':' + line + ':' + col : 'nofile'), 'href: ' + location.href ]; for (var i = 0; i < path.length - 1; i++) { var item = path[i]; pointer[item] = {}; pointer = pointer[item]; } pointer[path[i]] = 1; var url = 'https://mc.yandex.ru/watch/' + counterId + '/' + '?site-info=' + encodeURIComponent(JSON.stringify(siteInfo)) + '&rn=' + Math.random(); if (typeof navigator.sendBeacon === 'function') { navigator.sendBeacon(url, ' '); } else { new Image().src = url; } if (handler.count) { handler.count++; } else { handler.count = 1; } }; </script> And yet, data on errors can be obtained using the API and do anything with them.
Do not forget to add links to error reports in your documentation in a prominent place.
And to give access to the reports to the other developers from the group so that the correction of errors turned into a competition.
References:
- Github
- Report " Parameters of visits "
- Sample Report in Metric
')
Source: https://habr.com/ru/post/324366/
All Articles