Simple, reliable and convenient monitoring of servers on Linux
If you administer servers on Linux, for sure, you are in a state of constant search for simple, reliable and convenient tools for solving various tasks. One of them - monitoring the status of machines. And, although there are plenty of monitoring tools, it is usually not so easy to find something that will go into the everyday set of programs. That is why today I want to talk about one of these finds, the utility, which I use every day.

The program, which will be discussed, is called Nigel's Monitor , or simply nmon. She, using a simple interface ncurses, is able to display, in real time, information about various indicators characterizing the state of the server. Among them are data on the processor and memory, information about network resources, disk drives, file system and NFS, and processes. The set of displayed indicators can be customized. Nmon has a text interface, therefore, to work with it, it is enough to connect to the server via SSH.
')
I suggest you install nmon and talk about how to use it.
The nmon utility can be installed from standard repositories of server OS distributions. That is, you are unlikely to encounter any difficulties. If your system uses
For distributions using
As you can see, everything is simple. Go to work with nmon.
So, nmon is installed, now you can start it by running the

The nmon main window contains tips for enabling and disabling various sections of system information.
Let's say you're interested in disk drives. If you press the
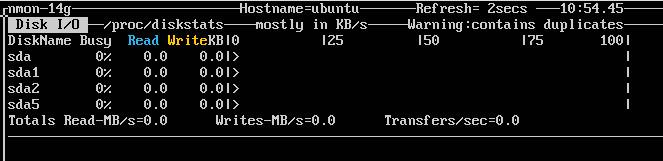
Nmon monitoring tool displays disk data
Next, add informational sections with network and memory information by pressing the
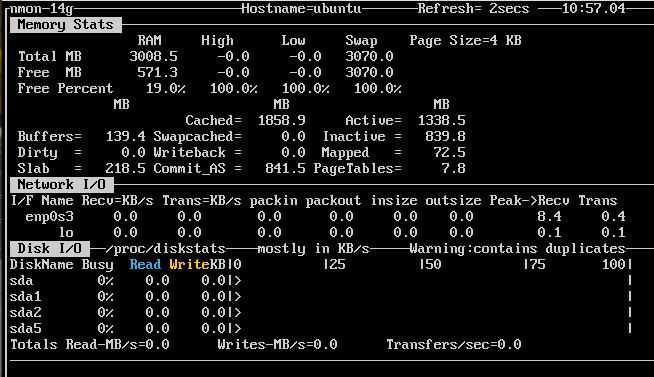
Adding to the monitoring window information about the network subsystem and memory
You can turn off the display of certain sections using the same keys that were used to display them on the screen. In addition, nmon supports the ability to change the data update rate. This is done using the "
To exit nmon, press the
The tool includes the ability to capture data and save it to a file. This can be very handy if you need to analyze data on the state of the system for a certain period of time.
Suppose it takes 30 "snapshots" of the system state, which must be done every 60 seconds. You can organize this by using the following command:
Here, the
Half an hour after the execution of the above command in the current working directory will be the file of interest with the extension
You can analyze this file, for example, with the help of the nmonchart utility, which will create from it a web page containing nice graphics.
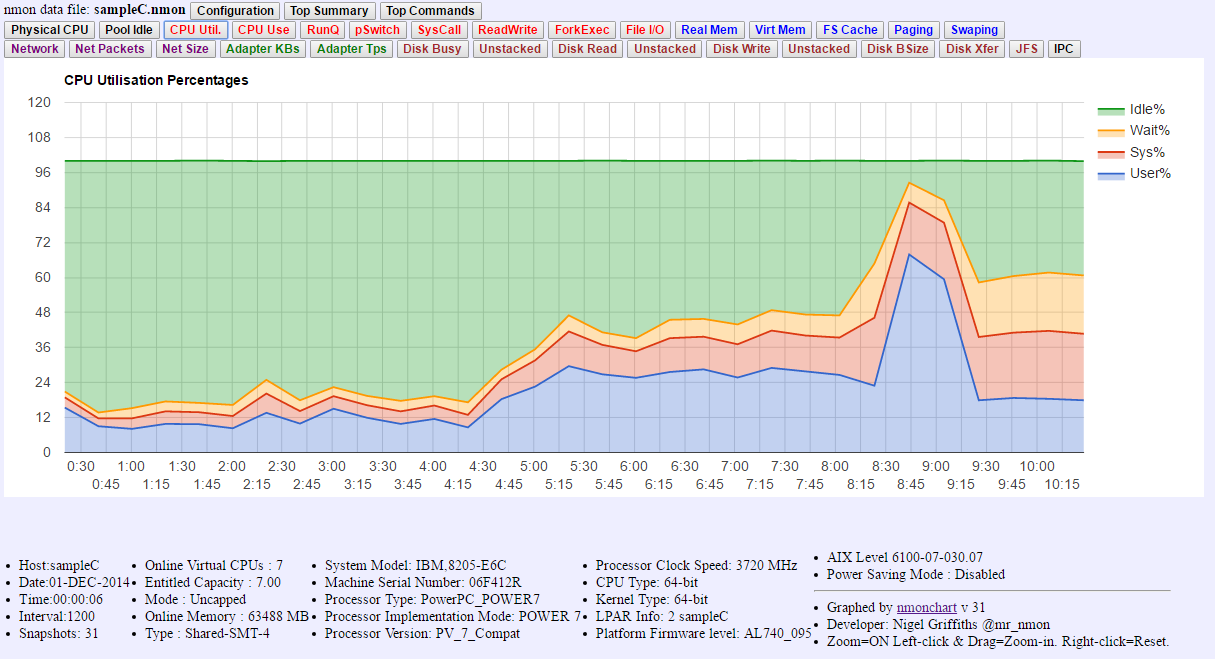
Analyzing nmon data using nmonchart
If you need to organize a regular collection of data on the performance of the server, for example, to identify recurring problems, you can use cron tasks. It is done this way. First, create a bash script, say,
The file must be saved and given its permission to execute with the command
After saving the changes, the cron task will be executed daily at 11:30 am. You, of course, substitute here the time that you need, having received a convenient tool at your disposal to identify the causes of server problems.
I am sure that it will not be easy for you to find a simpler and more convenient solution for monitoring Linux servers, suitable for monitoring systems in real time and for collecting data that is planned to be analyzed later.
Perhaps nmon is, so to speak, Masthev for each system administrator.
Dear readers! And which Linux administration tools do you use all the time and can you recommend them to others?
The program, which will be discussed, is called Nigel's Monitor , or simply nmon. She, using a simple interface ncurses, is able to display, in real time, information about various indicators characterizing the state of the server. Among them are data on the processor and memory, information about network resources, disk drives, file system and NFS, and processes. The set of displayed indicators can be customized. Nmon has a text interface, therefore, to work with it, it is enough to connect to the server via SSH.
')
I suggest you install nmon and talk about how to use it.
Installation
The nmon utility can be installed from standard repositories of server OS distributions. That is, you are unlikely to encounter any difficulties. If your system uses
apt (this is Debian, Ubuntu, and others), you need to execute the following commands in the terminal: sudo apt-get update sudo apt-get install nmon For distributions using
dnf (among them Red Hat, Fedora, CentOS), the installation will look like this: dnf install epel-release dnf install nmon As you can see, everything is simple. Go to work with nmon.
Working with nmon
So, nmon is installed, now you can start it by running the
nmon command. In the utility window shown in the figure below, you need to specify exactly what information you are interested in, including and disabling the corresponding information sections.The nmon main window contains tips for enabling and disabling various sections of system information.
Let's say you're interested in disk drives. If you press the
d key on the keyboard, nmon will display information about all drives connected to the server.Nmon monitoring tool displays disk data
Next, add informational sections with network and memory information by pressing the
n and m keys. As a result, a set of data about the system will be supplemented with indicators of interest to us.Adding to the monitoring window information about the network subsystem and memory
You can turn off the display of certain sections using the same keys that were used to display them on the screen. In addition, nmon supports the ability to change the data update rate. This is done using the "
- " and " + " keys on the keyboard. The first, respectively, reduces the rate of updating indicators, the second - increases.To exit nmon, press the
q key, this will return to the usual bash prompt.Data collection with nmon
The tool includes the ability to capture data and save it to a file. This can be very handy if you need to analyze data on the state of the system for a certain period of time.
Suppose it takes 30 "snapshots" of the system state, which must be done every 60 seconds. You can organize this by using the following command:
nmon -f -s 60 -c 30 Here, the
-f indicates that the data should be written to a file, the -s specifies the time intervals, in seconds, between “snapshots”, and the -c switch tells the program that we need 30 sets of indicators.Half an hour after the execution of the above command in the current working directory will be the file of interest with the extension
.nmon .You can analyze this file, for example, with the help of the nmonchart utility, which will create from it a web page containing nice graphics.
Analyzing nmon data using nmonchart
Data collection planning
If you need to organize a regular collection of data on the performance of the server, for example, to identify recurring problems, you can use cron tasks. It is done this way. First, create a bash script, say,
nmon.sh , with the following contents: #! /bin/sh nmon -f -s 60 -c 30 The file must be saved and given its permission to execute with the command
chmod u+x nmon.sh Now open the crontab file for editing with the crontab -e command and enter the following: 30 11 * * * ~/nmon.sh After saving the changes, the cron task will be executed daily at 11:30 am. You, of course, substitute here the time that you need, having received a convenient tool at your disposal to identify the causes of server problems.
Results: really simple and really useful
I am sure that it will not be easy for you to find a simpler and more convenient solution for monitoring Linux servers, suitable for monitoring systems in real time and for collecting data that is planned to be analyzed later.
Perhaps nmon is, so to speak, Masthev for each system administrator.
Dear readers! And which Linux administration tools do you use all the time and can you recommend them to others?
Source: https://habr.com/ru/post/324194/
All Articles