Java memory leak diagnostics
In this article I want to show how to identify and fix memory leaks in Java using an example from my daily work. We will not consider here the possible causes of leaks, this will be a separate article, since the topic is quite extensive. It is worth noting that the discussion will focus on the diagnosis of Heap Memory, there will be a separate article on leaks in other areas of memory.
To successfully diagnose, we need two tools: Java Mission Control (jmc) and Eclipse Memory Analyzer. In general, you can do only Memory Analyzer, but the picture will be more complete with JMC.
First of all, you need to run the application with the following JVM flags:
Do not use these options on the production system without purchasing a special Oracle license!
These options allow you to run Flight Recorder, a utility that helps you gather information about memory usage (and a lot of other important information) during program execution. I will not describe here how to run Flight Recorder, this information is easily googled. In my case, it was enough to run FR for 10-11 minutes.
')
Consider the following figure, which shows the classic memory “saw”, as well as an important signal that something is wrong with memory usage:

You can see that after each memory cleanup cycle, the heap gets more and more filled, I highlighted it with a yellow triangle. “Saw” creeps up all the time. This means that some objects are not reachable for cleaning and accumulate in the old space, which over time will lead to overflow of this memory area.
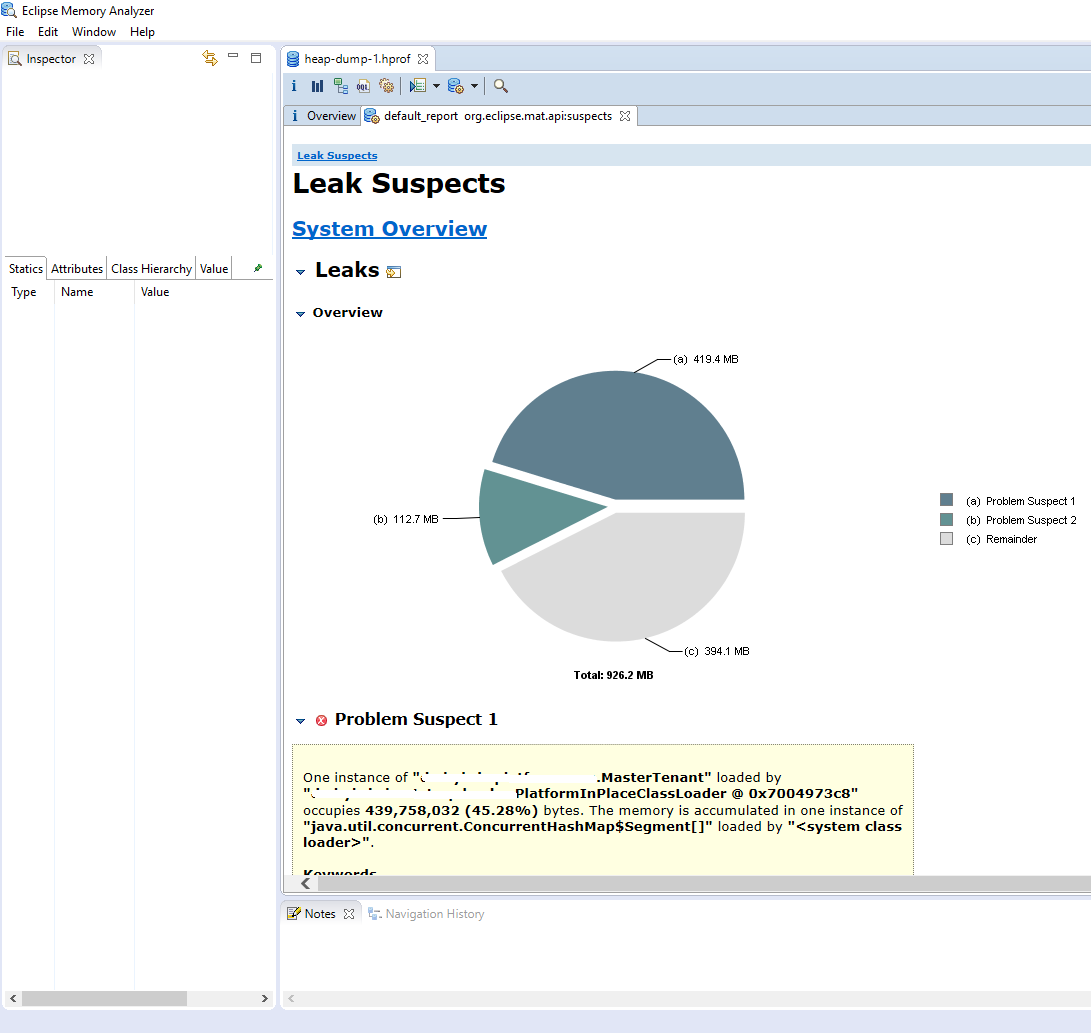
The next step is to find out what is not available for cleaning and Memory Analyzer will help us with this. First of all, you need to load a working application with a supposed memory leak into the heap dump program. This can be done using File → Acquire Heap Dump . After downloading, in the “Getting Started Wizard” dialog, select “Leak Suspects Report” and then a brief overview of possible memory leaks will open:
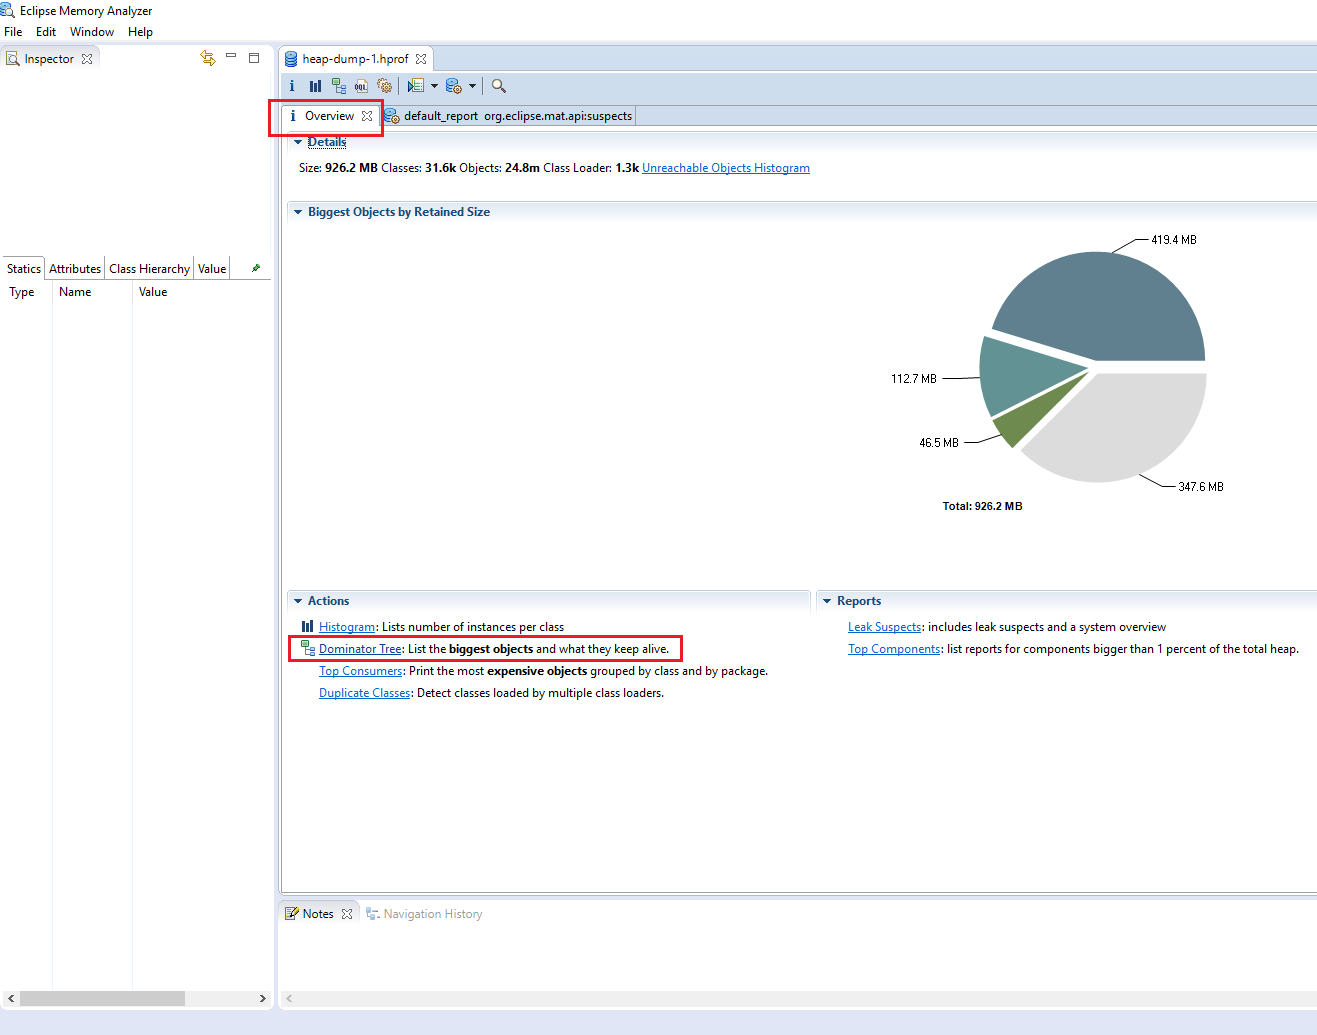
If you go back to the “Overview” tab and select the “Dominator Tree” , you can see a more detailed picture:
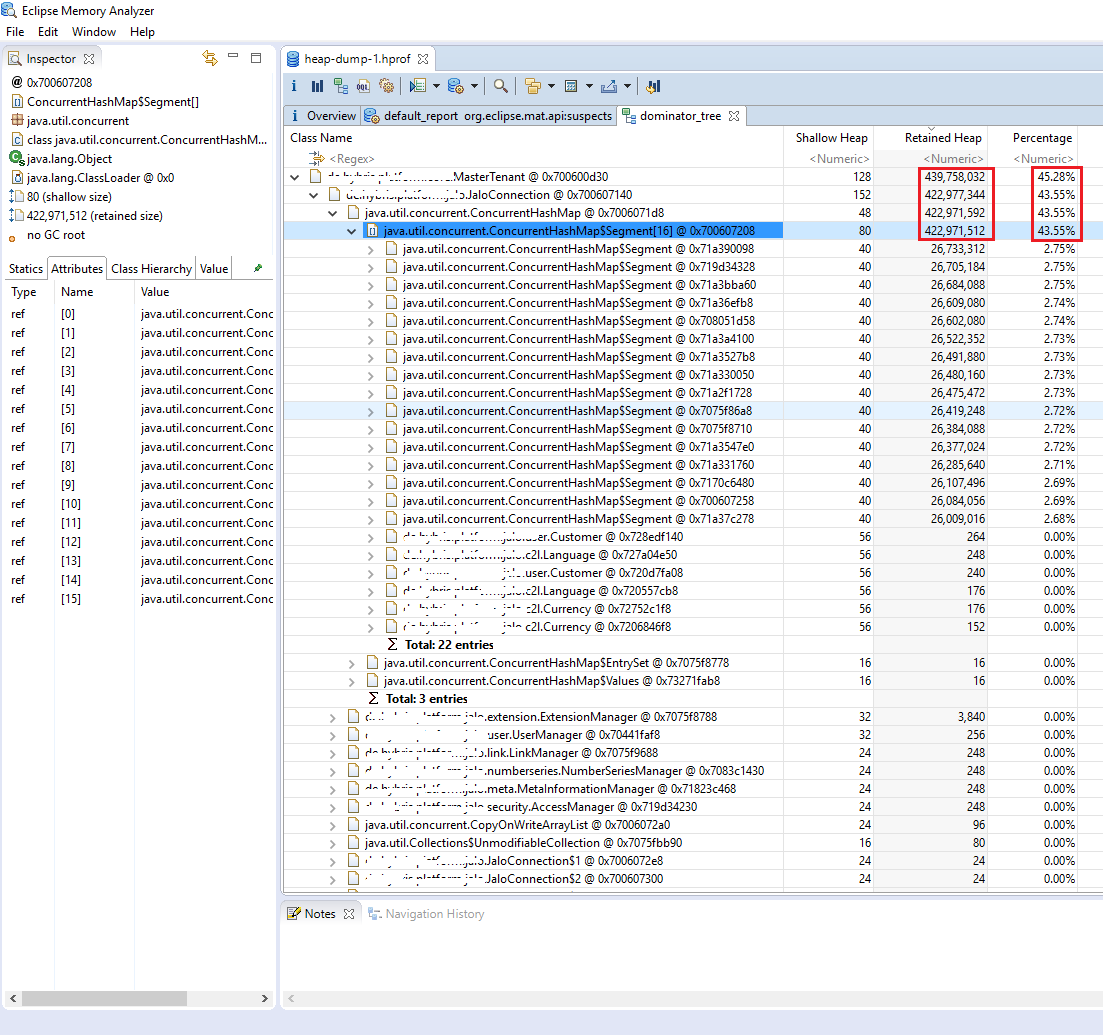
The tree shows the structure of the "heavy" object, as well as the size of its fields (by type). You can see that one of the fields in the MasterTenant object occupies more than 45% of the memory.
Having the result of the analysis from the previous paragraph, the next step is the elimination of accumulation of the memory object. It all depends on the specific code. General recommendation - you need to find and analyze all the places where initialization or change of the corresponding field or fields takes place in order to understand the memory accumulation mechanism. In my case, the collection is constantly added records from the set (about 150) threads under certain conditions.
After finding and repairing the leak, it will not be superfluous to go through all the steps again, analyze the memory and the Memory Analyzer report to make sure that the fix helped.
Instruments
To successfully diagnose, we need two tools: Java Mission Control (jmc) and Eclipse Memory Analyzer. In general, you can do only Memory Analyzer, but the picture will be more complete with JMC.
- JMC is included in the JDK (starting at 1.7)
- Memory Analyzer can be downloaded from: MAT
Memory usage analysis
First of all, you need to run the application with the following JVM flags:
-XX:+UnlockCommercialFeatures
-XX:+FlightRecorder
Do not use these options on the production system without purchasing a special Oracle license!
These options allow you to run Flight Recorder, a utility that helps you gather information about memory usage (and a lot of other important information) during program execution. I will not describe here how to run Flight Recorder, this information is easily googled. In my case, it was enough to run FR for 10-11 minutes.
')
Consider the following figure, which shows the classic memory “saw”, as well as an important signal that something is wrong with memory usage:
You can see that after each memory cleanup cycle, the heap gets more and more filled, I highlighted it with a yellow triangle. “Saw” creeps up all the time. This means that some objects are not reachable for cleaning and accumulate in the old space, which over time will lead to overflow of this memory area.
Leak Detection
The next step is to find out what is not available for cleaning and Memory Analyzer will help us with this. First of all, you need to load a working application with a supposed memory leak into the heap dump program. This can be done using File → Acquire Heap Dump . After downloading, in the “Getting Started Wizard” dialog, select “Leak Suspects Report” and then a brief overview of possible memory leaks will open:
If you go back to the “Overview” tab and select the “Dominator Tree” , you can see a more detailed picture:
The tree shows the structure of the "heavy" object, as well as the size of its fields (by type). You can see that one of the fields in the MasterTenant object occupies more than 45% of the memory.
Leak elimination
Having the result of the analysis from the previous paragraph, the next step is the elimination of accumulation of the memory object. It all depends on the specific code. General recommendation - you need to find and analyze all the places where initialization or change of the corresponding field or fields takes place in order to understand the memory accumulation mechanism. In my case, the collection is constantly added records from the set (about 150) threads under certain conditions.
After finding and repairing the leak, it will not be superfluous to go through all the steps again, analyze the memory and the Memory Analyzer report to make sure that the fix helped.
Source: https://habr.com/ru/post/324144/
All Articles