Using the ArcGIS API for Python in Jupyter Notebook

Hello! This is the blog of the company Technoserv. In the production process on projects that we carry out, interesting technological cases are born. There are so many of them that we decided to start sharing them with the world. And yes, this is our first publication.
The honor to start a blog fell to me, and I write about what is close and loved to me: about geo-information technologies. I work in the department of Big Data, where I develop high-load geographic information systems and services based on engines for distributed computing. We will talk more about high matters, and today we will gradually begin immersion in GIS.
Increasingly, data analysts (or as they call them Data Scientist) need to visualize data on a map. What tool is now considered the most convenient for the work of the analyst? Of course, notebooks! Until recently, the possibilities for visualization of geodata were not so much. You could make static rasters in matplotlib, sometimes you could even add basemaps. Interesting was the library for working with Leaflet, where you can open geojson files. Today I want to talk about the ArcGIS API for Python from Esri.
This article will be useful both for analysts who want to study examples of working with GIS, as well as for cartographers and GIS specialists who are interested in trying their hand at writing code.
What is the ArcGIS API for Python?
It is an easy-to-use and functional-rich library for visualizing and analyzing geodata, as well as for managing a corporate GIS (Geographic Information System), from spatial data to administration. An important feature of this library is "Pythonic" (Pythonic) using standard constructions, structures and idioms, which distinguishes it from the arcpy standard ArcGIS library, which sometimes caused developers to rage with both code style and speed.
This article discusses the features that are available without purchasing ArcGIS licenses or an ArcGIS Online subscription. To work, you will need a free ArcGIS Online account (I’ll omit the details of its creation - it’s quite simple to do at http://www.arcgis.com ). In this variant there is a restriction on 1000 objects in the layer.
The API is distributed as a cong-package arcgis. Inside the package, which is a conceptual GIS model, the functionality is organized in several different modules, which makes it easy to use and understand. Each module has several types and functions that cover a specific aspect of GIS.
I will consider a small part of the API as an introductory material.
arcgis.gisprovides a basic information model for both corporate GIS and ArcGIS Online. This module provides management functions (create, read, update, and delete) by users, groups, and content. Actually, this is your entry point to GIS.arcgis.widgetsis, in fact, a module for managing cartographic widgets (MapView) in Jupyter notebook.
Installation
At the moment, the library is distributed only inside Anaconda for Python 3x. Put everything simple.
%%cmd conda install -c esri arcgis I hope everything went well. Now you can start using.
If you don’t want to install Anaconda, but you want to test the library, you can try the Esri sandbox: https://notebooks.esri.com .
Using
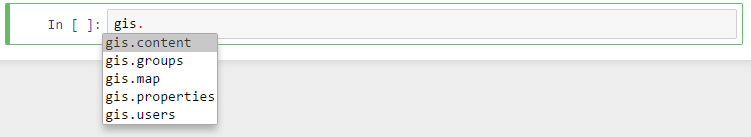
The GIS object in the gis module is the most important point in the ArcGIS API for Python, your entry point. He personifies the GIS that you work with, be ArcGIS Online or corporate ArcGIS. The object allows you to work with geo-content or to administer GIS. Let's start with the initialization of the GIS object
import arcgis from arcgis.gis import GIS For work, you can use it as a basic anonymous connection to ArcGIS Online ...
gis = GIS() ... and with login.
my_gis = GIS(url='http://arcgis.com', username='andrey_zhukov', password='') For any tool you can call help, for example
gis? In addition, contextual input is also supported.
Embed the map - it's easy!
Let's initialize the object of the map hello_map with the center in Moscow and with a zoom level of 15.
hello_map = my_gis.map("", zoomlevel = 15) Now let's call him ...
hello_map 
Welcome!
The basic elements work in the map - dragging with the mouse (pan) and zooming (zoom) with the mouse wheel (or the corresponding gesture on the touchpad), and with on-screen buttons.
Subsequent manipulations with the hello_map object will be reflected in the frame above.
What can be controlled from the card?
For example, zoom.
hello_map.zoom = 10 Increase the area of the map
hello_map.height = '600px' Such picture will turn out:

Let's look at the list of available base maps.
hello_map.basemaps ['streets', 'satellite', 'hybrid', 'topo', 'gray', 'dark-gray', 'oceans', 'national-geographic', 'terrain', 'osm'] Can I see everything? Of course!
from time import sleep for basemap in hello_map.basemaps: hello_map.basemap = basemap sleep(5) In the frame of the map you can see something like this:

OpenStreetMap - quite familiar, dwell on it.
hello_map.basemap = 'osm' Look for addresses. Find the address of the BC Omega Plaza and approx map to it.
Geocoding at one address is absolutely free, but batch geocoding already requires credits to the organization’s account.
location = arcgis.geocoding.geocode(', , 19', max_locations=1)[0] hello_map.extent = location['extent'] 
You can add content from the ArcGIS Online gallery to the map. Let's look for something interesting ...
from IPython.display import display items = gis.content.search('title:Moscow', item_type='Feature Collection') for item in items: display(item) 
Moscow Walking Tour - great! Refine item.
my_layer = items[2] display(my_layer) 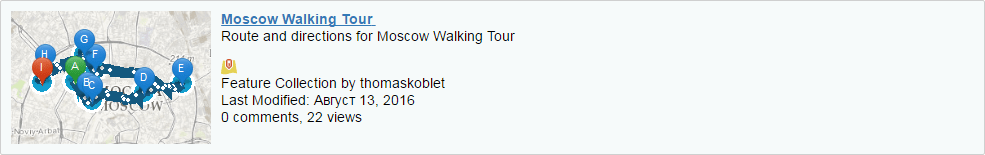
Add a service and look at our hello_map
hello_map.add_layer(my_layer) hello_map.zoom = 10 
We received a web map embedded in a frame inside a notebook. It supports navigation and information output by clicking on objects. Today, many organizations use ArcGIS technology not only at the corporate level, but also to publish open data. Some of these open data are available for search and use on ArcGIS Online, others can be found through the open data portal ( https://opendata.arcgis.com/ ) and uploaded to ArcGIS Online.
Happy hacking mapping!
Work with objects
Of course, every Data Scientist working in Jupyter Notebook is used to pandas and DataFrame. Let's work with a complete dataset using pandas and ArcGIS.
To do this, we first import csv into pandas, and then convert it to a map layer.
As an example, I will take a layer of Moscow parking machines. I have already conjured a bit with the original csv. I recoded to utf8 and renamed the columns to avoid unexpected problems.
import pandas as pd parkomats = pd.read_csv(r'.\data\data-417-2017-02-14.csv', sep=';') Let's see the resulting object. It already has latitude and longitude, as well as a pseudo-geojson-field geoData. When importing data, ArcGIS itself attempts to identify geometry fields or addresses. If we needed to collect data by addresses, we would have to collect an address from several fields.
parkomats.tail() 
Now import the DataFrame from pandas into gis objects. To do this, simply call the import_data function. As a result, we have a FeatureCollection object.
geoparkomats = my_gis.content.import_data(parkomats) geoparkomats <FeatureCollection> Now add objects to the map. To do this, initialize the new map object and add our new layer to it.
parkomat_map = my_gis.map('', zoomlevel=12) parkomat_map.basemap = 'osm' parkomat_map.height = '600px' parkomat_map.add_layer(geoparkomats) parkomat_map 
Already not bad! But it would be nice to issue this data. Let's try to decorate them. For starters, just by parking zones
parkomat_cat_map = my_gis.map('', zoomlevel=10) parkomat_cat_map.basemap = 'gray' parkomat_cat_map.add_layer(geoparkomats, {"renderer":"ClassedColorRenderer", "field_name":"ParkingZoneNumber"}) parkomat_cat_map.height = '600px' parkomat_cat_map 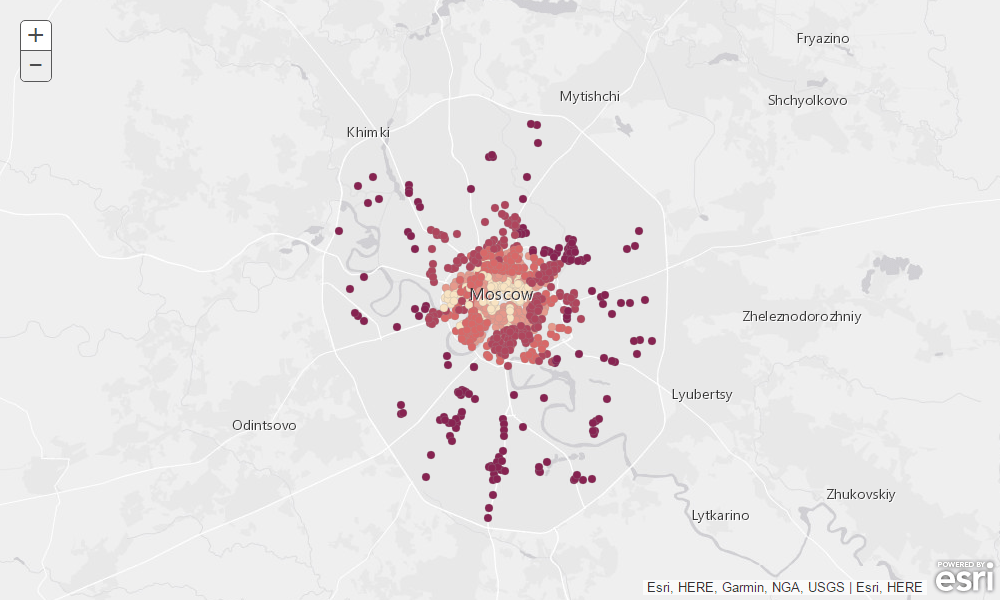
Many people like heatmaps. Let's try to do it.
parkomat_heat_map = my_gis.map('', zoomlevel=11) parkomat_heat_map.basemap = 'dark-gray' parkomat_heat_map.add_layer(geoparkomats, {"renderer":"HeatmapRenderer"}) parkomat_heat_map.height = '600px' parkomat_heat_map 
As you can see, adding and styling a layer is not difficult.
In addition, you can arrange all the cards nearby. To do this, create and configure three new frames and enter them into one box.
just_map = my_gis.map('', zoomlevel=10) just_map.basemap = 'osm' just_map.add_layer(geoparkomats) cat_map = my_gis.map('', zoomlevel=10) cat_map.basemap = 'gray' cat_map.add_layer(geoparkomats, {"renderer":"ClassedColorRenderer", "field_name":"ParkingZoneNumber"}) heat_map = my_gis.map('', zoomlevel=10) heat_map.basemap = 'dark-gray' heat_map.add_layer(geoparkomats, {"renderer":"HeatmapRenderer"}) from ipywidgets import * just_map.layout=Layout(flex='1 1', padding='5px') cat_map.layout=Layout(flex='1 1', padding='5px') heat_map.layout=Layout(flex='1 1', padding='5px') box = HBox([just_map, cat_map, heat_map]) box.height = '300px' box Conclusion
So, you’ve learned how easy it is to use high-grade web maps in Jupyter Notebook using the ArcGIS API for Python. This is a new product, barely out of beta, but already quite interesting, with great prospects. With questions on work and suggestions for improving the API, you can either comment in the article or write to the Russian representative of Esri in Russia - esri-cis.ru.
The materials of this article are posted on GitHub ( https://github.com/fall-out-bug/arcgis_python ). Esri's library code and extensive material can also be found on GitHub ( https://github.com/Esri/arcgis-python-api )
Happy mapping!
')
Source: https://habr.com/ru/post/324124/
All Articles