Common Bird Census, or bioinformatics in ornithology. Project in good hands
Good time, friends.
When we think of bioinformatics, we usually imagine some complex DNA sequences, protein folding or, at worst, modeling of virus diffusion.
In this article, we will discuss a slightly different topic, much closer, one might say, machine vision and document analysis, or even applied automation, than to high science. But in fact, the topic is important and relevant, if only because it exists in a very interesting ecological niche.
')
KDPV:
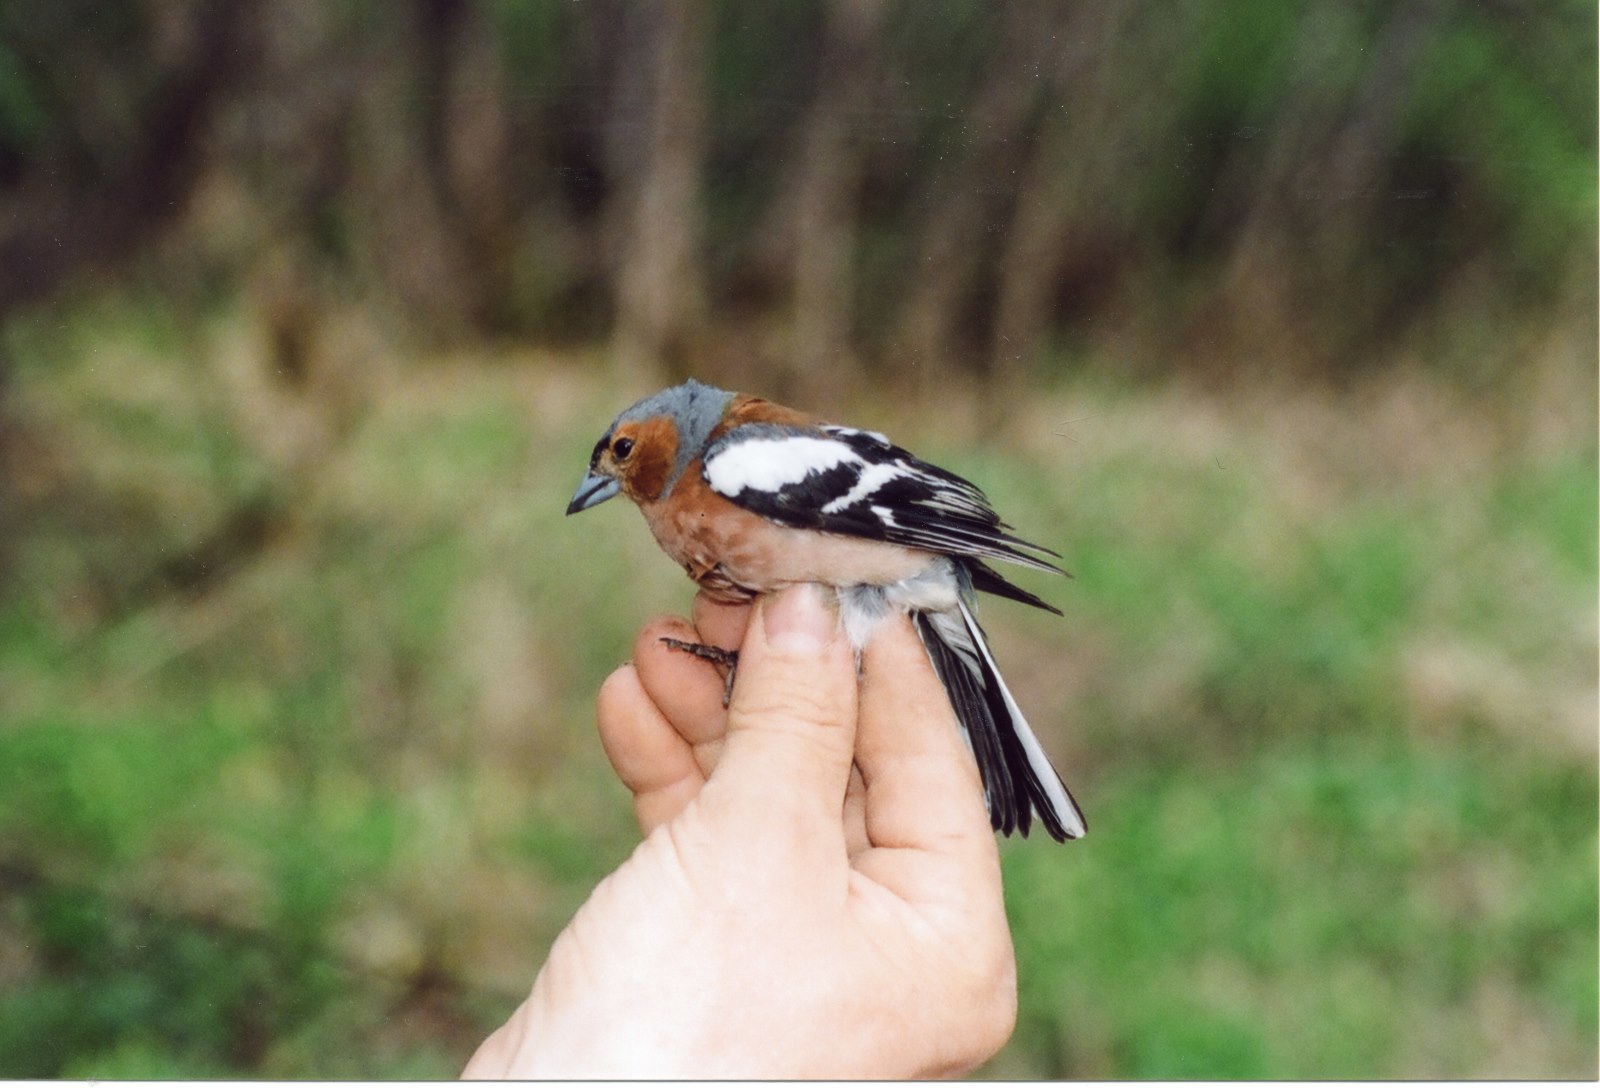
Who are interested - I ask under the cat.
TL; DR:
Presentation of the project on the recognition of cards drawn by hand.
The project has a website: biorec.sourceforge.net
The code is uploaded to SVN: sourceforge.net/p/biorec/code/HEAD/tree
/ Tl; dr;
This story has several “roots” and I will try, without going too deep into the wilds, yet briefly describe them in order to create a more complete picture in the mind of the reader.
For a start, what is ornithology? Ornithology is a section of ecology, the science of bird behavior, how they behave and how they choose strategies for survival in this complex world.
It can be said that the main fundamental task of ecology is to find out why we have such types, and not any others. What kind of energy minima exist in a strange multidimensional space, which is our life, allowing some species to survive (for example, domestic cows have adapted very well, and are unlikely to ever die), and some die off (say, mammoths).
Ornithology solves this problem as applied to birds.
Say, for sure, many of the readers, when asked what the ornithologists are doing, will say “they put rings on birds and look where they will fly”.
Indeed, this is one of the methods used by ornithologists. In particular, for example, thanks to him, it is possible to establish on which routes migratory birds move from one end of ours extensively, but still such a small Earth to another.
Picture:
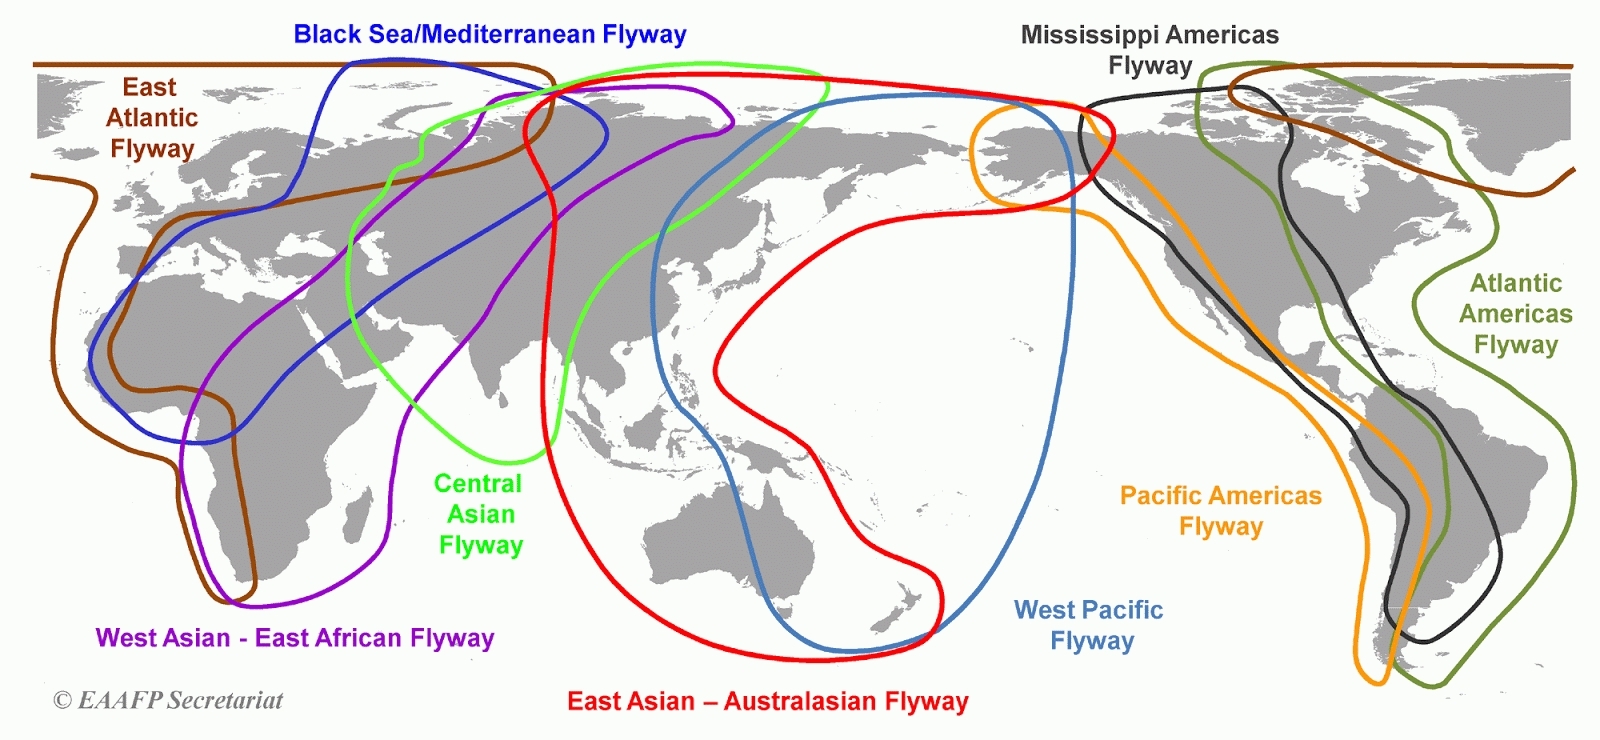
From the above picture, it can be understood that, in a sense, Russia was lucky, because the intersection point of many different, different from each other routes, it turns out it is in Russia.
Actually, it is at the intersection of the regions that one of the world's leading bird research laboratories is located - the Yenisei Biological Station IPEE RAS “Mirnoye”.
However, in this article I want to draw your attention to another method used in the study of birds.
It can be said that just like a microscope can have different resolutions, and it makes no sense to try to examine a fuzzy font with an atomic force microscope, so the ornithological methods have different resolutions. The above method of ringing, has a typical range of thousands of kilometers. The same method that I want to talk about is only tens of meters.
This method is called Common Bird Census.
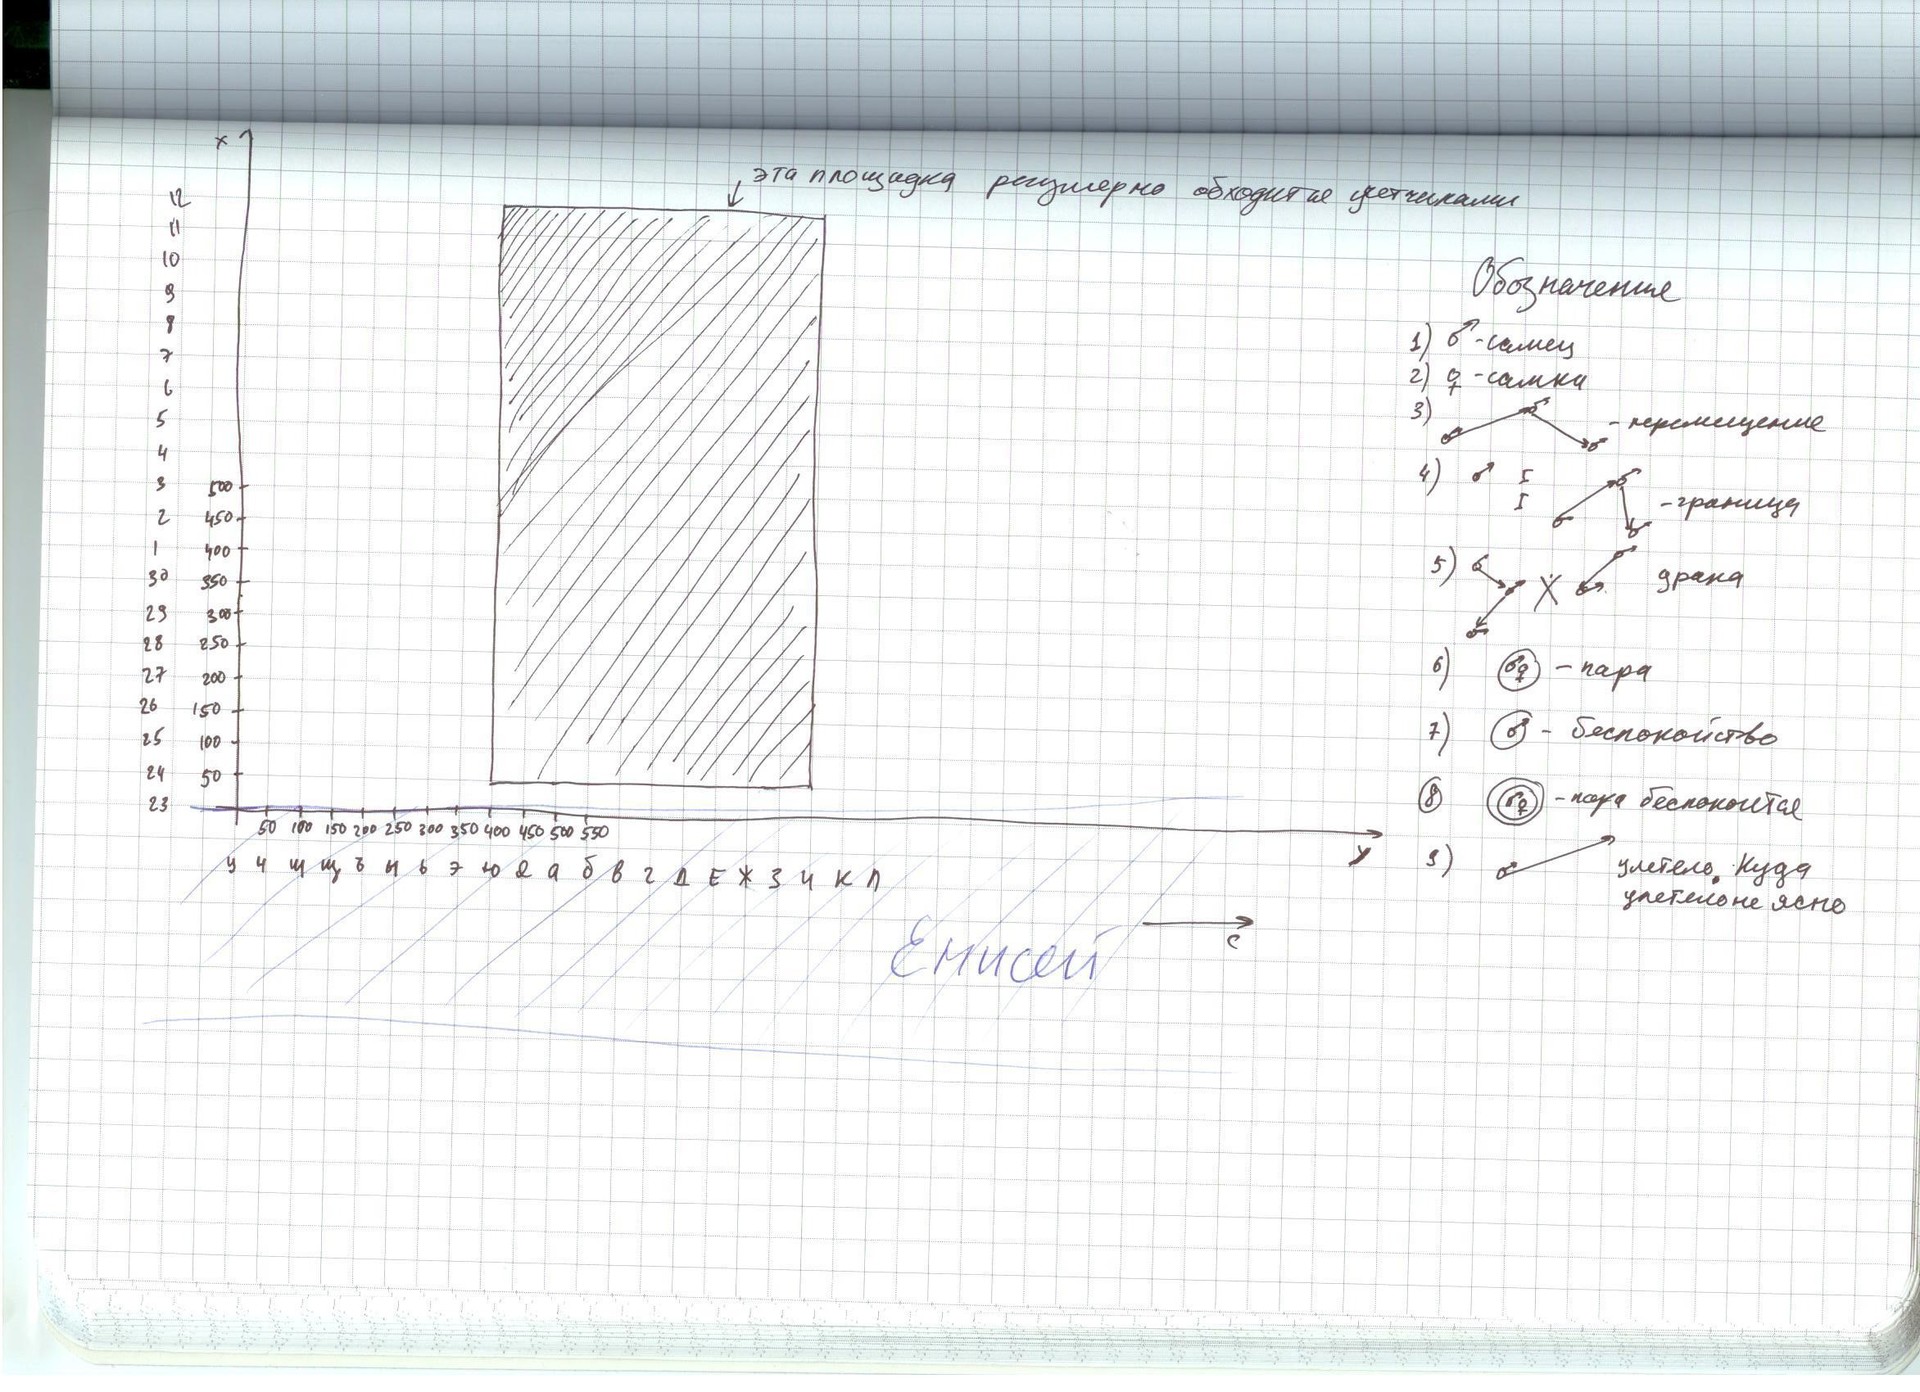
His idea is that every day specially trained people who know how to determine the type of bird by their appearance go to the test site, and mark various observed birds in their working notebook.
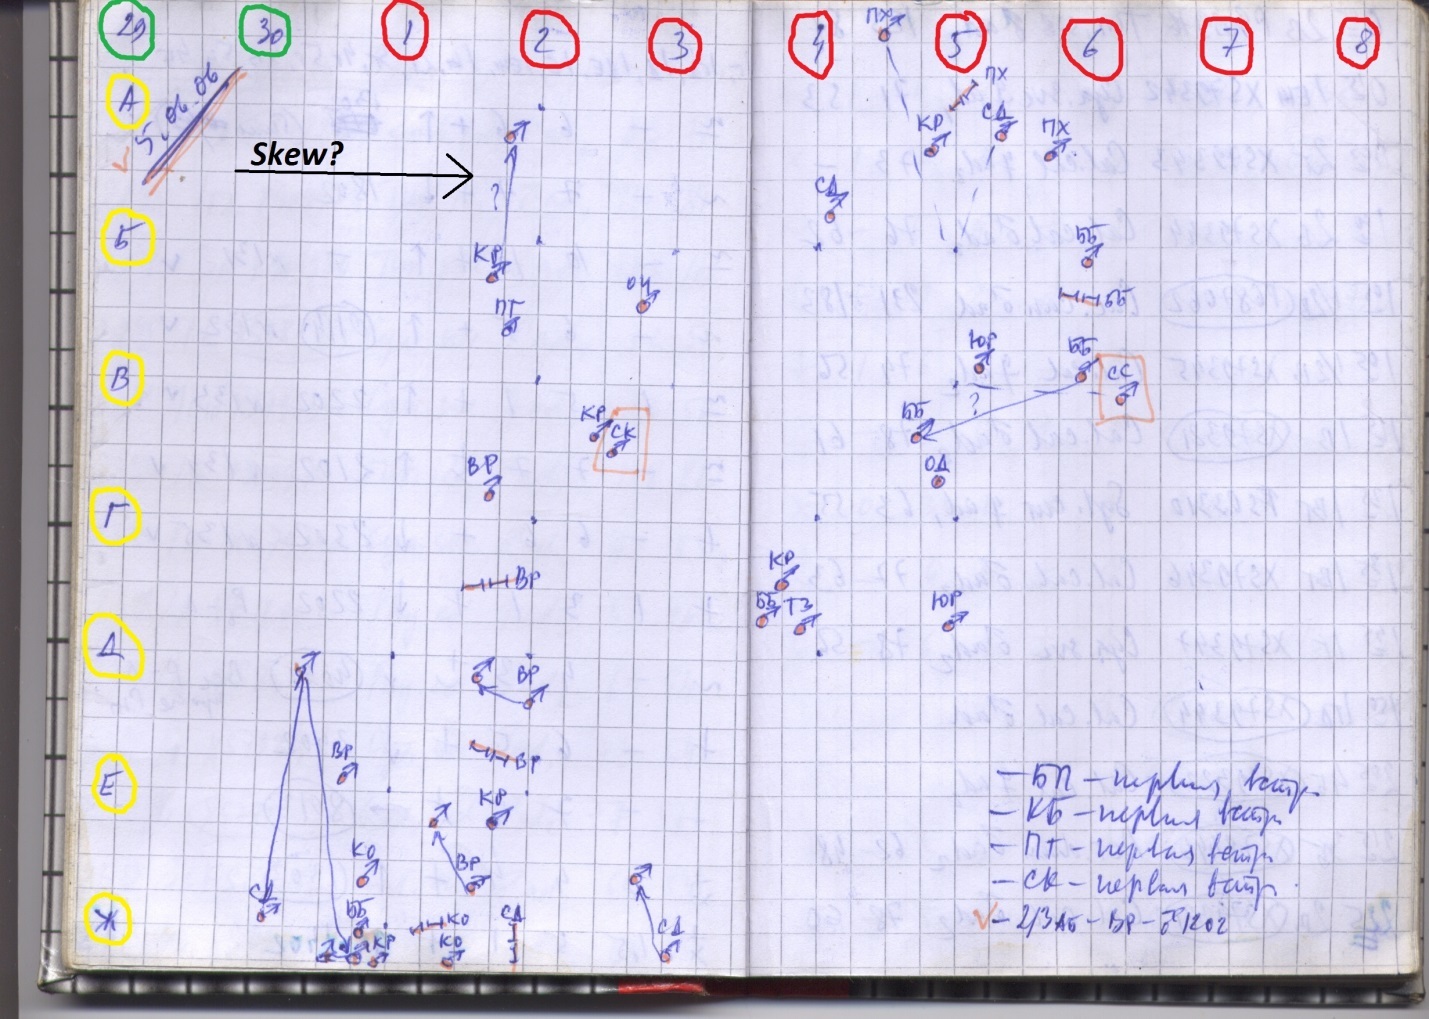
The format of the markers, marked by experts, you can see on the next slide.
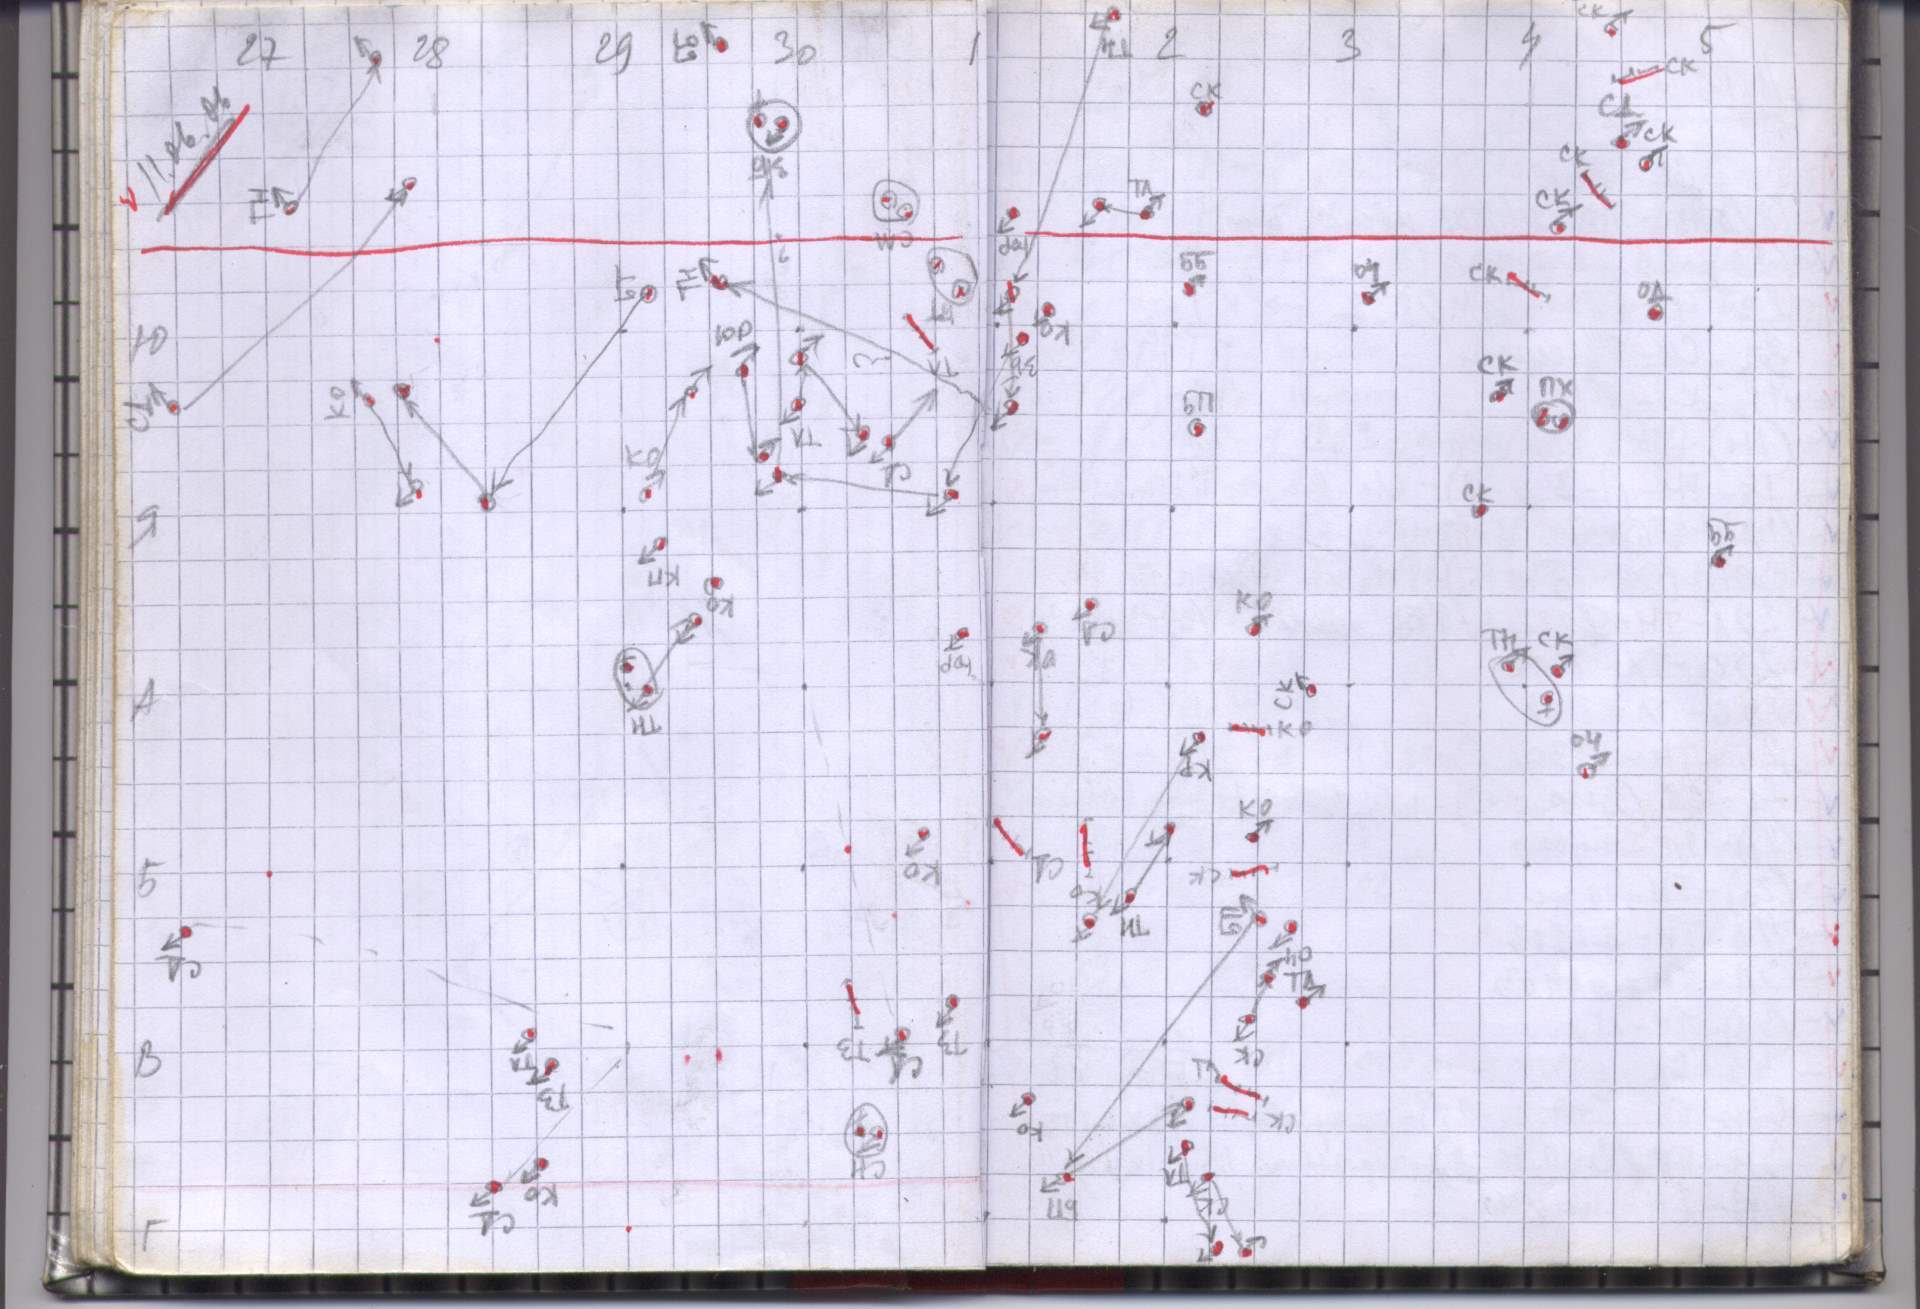
And here is a fragment of data that is collected on the ground:
Oh, how good it would be if robots could do this work! It would be possible to run on each site of his robot, which would fly around every tree and report on everything he saw.
But alas, the technology has not yet reached this point (although, perhaps, it will come in the foreseeable future).
In the meantime, the observation requires specially trained people who need to absorb a huge amount of information about the behavior, appearance, sound profile and social skills of birds. And this information, unfortunately, is still poorly applicable in the ordinary life of a person. On the other hand, it is difficult to overestimate the opportunity to read the forest as an open book. This alone can make a person go to ornithologists.
And all the more impressive is that the whole territory of Great Britain, where this method was invented (in 1962), is covered with squares, which were observed in a similar way every year, for 38 years, until 2000, when the accuracy of the method was considered excessive.
bto.org.uk

By the way, the method was invented by J Dennis Summer-Smith, who, generally speaking, is an amazing person. What else did you translate an article from the wiki about it into English?
However, an attentive reader will tell me another place where you could apply the technology available at the moment.
Well, let it be impossible to collect data automatically. But at least it should be possible to save them in some convenient format?
Alas, the answer to this question is no. Unfortunately, in the places most convenient for observation, there are big problems with electricity, water and mud protection, cold and poor communication with the “big earth”. In the same place, where there are those problems, the problem arises of delivering standardized equipment (as which one could imagine some kind of industrial-grade tablet on Linux / Windows).
What we have, you ask!
Here's what:
Here I will again show the picture with the data:

On the image you see a fragment of the map, drawn in columns and rows with letters and numbers (note the “data format” on the previous slide).
This is the same unsightly, but such an expensive and important reality.
It is here that we see the birds moving from point to point, fighting, getting married, caring for offspring.
Each such sheet is many hours of difficult field work, which ultimately should give us the answer to the most difficult question in the world: how to live correctly? How to live in such a way as to live for a long time, not to get sick, produce offspring, grow up, sing the best (by what parameters?) Song and realize yourself in it.
Why are some birds big and others small? Why do some have a large area, others have a small one? Why do some birds have many children and others have few?
Well, you ask me. But if the data is somehow (albeit analog way) collected. If they are somehow (even on paper) stored.
But you and I are Data Scienceists. Well, is this data somehow processed somehow yes?
And the answer to this question is, although it is not as joyful as we would like.
The most obvious task of preprocessing is to divide the data from the sheet into several layers, where each layer would correspond to only one type. This is a logical, meaningful task, because it is advisable to study birds of different species together, as samples from one set, and it is possible to compare them with other species according to adaptation strategies.
And this problem is solved. Here is the result:

But you see, what a snag. Like most technical processes in such a delicate area, it is solved analogously.
As a result, the construction of even one such map takes a lot of time, and if we consider that (as was already written above), at least the Russian proving ground for Common Bird Census is at an extremely successful point in terms of species diversity, the construction of such a map for all 200 species is a very time consuming task.
However, there is another element on the map that is not visible on the daily fragments: pencil circles.
And what are they?
And they are exactly the same thing, a small step to that same alpha and omega, to understanding the behavior of the species. They are individual territories. You could say the birth of private property. These are the territories that the birds consider to be “their own”, where they actively feed, build a nest and which are ready to protect, even the most terrible consequences.
But how are they drawn?
This is where another important scientific question arises. Because there are two answers to this question.
One is given, for example, in the British Ornithological Trusts Guide for CBC (inventors of this method)
www.bto.org/sites/default/files/u31/downloads/details/CBC-instructions-g100.pdf
Another, for example, purely mechanical, in Philip North's article
www.jstor.org/stable/2347022?seq=1#page_scan_tab_contents
Which one is better?
Very interesting question. The BTO manual says that the method should be applied by the same group of experts for many years to ensure the consistency of the results. In other words, they say “we can train a person, but we cannot formulate the law of nature”. In IEEE RAS do the same.
How good is the North method? Great question! Who wants to do? Calling you on weakly!
In principle, the obvious approach is to somehow cluster the points in order to then circle the clusters ... well, for example, slightly going beyond their convex hull. But how to cluster them? You can see that some clusters have a solid size of emptiness inside. And what degree of smoothness of the border should be observed?
When your humble servant was younger and bolder, and was engaged in issues of computer vision, he presented himself as a white knight on a horse, and decided that such a powerful task deserves to be a challenge.
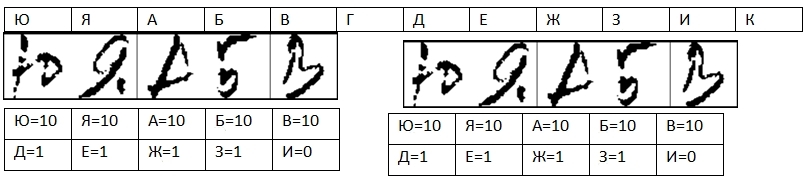
I began to solve the problem by the method of machine vision, trying to pull out and recognize the letters and numbers of columns and rows. Under this case, I even agreed with the company Cognitive Technologies on the use of their industrial engine (!) For handwriting recognition.
Here are some traces of this work:
For example, by projecting an entire image onto one axis, it is relatively easy to trim the edges:

Using a combination of erosion and dilation, you can subtract the background and grid:

Using the Hough transform, you can determine the angle of rotation of the image and fix it:
By the same projection of the picture on one axis, you can pull out individual letters:

And in the end, even find them all on the fragment:

And then feed the recognition engine:
Unfortunately, we had to work with some numbers like this:


The results of this work are still unpublished, because the result was not impressive - 66% recognition accuracy, although it allowed me to defend my diploma in due time. The work could still be completed, but by the end of my graduation time, I realized that I could do nothing without good manual marking, because by that time I had compiled a list of more than fifty different possible jambs in the images, each of which had to be somehow to catch
And then, having finished the institute, I, in my free time, as a hobby, took up writing a manual razmotchik-annotator, which in the end gave me the urge to start writing this article.
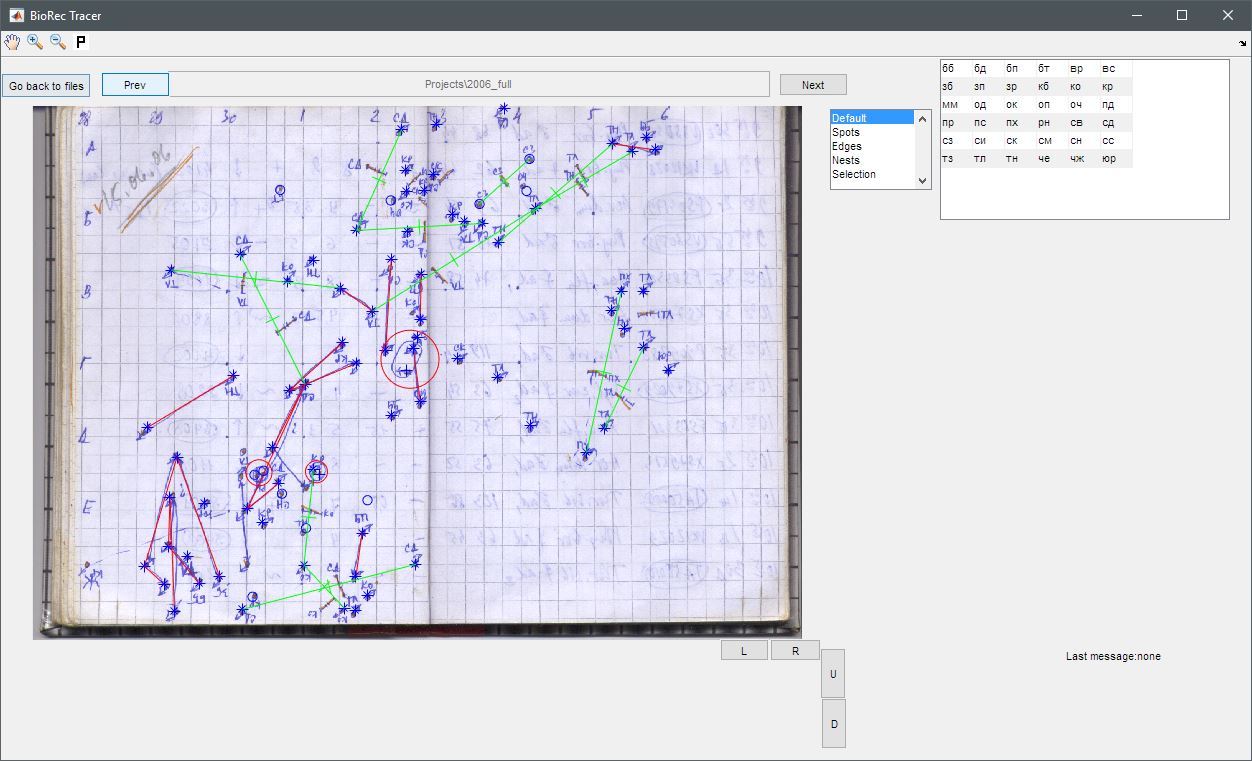
In the following slides you can see the interface elements of this markup.
Project manager:

Positioned means the marking of letters and numbers.
But generally speaking, I did more - I did the markup of ALL markers that come in.
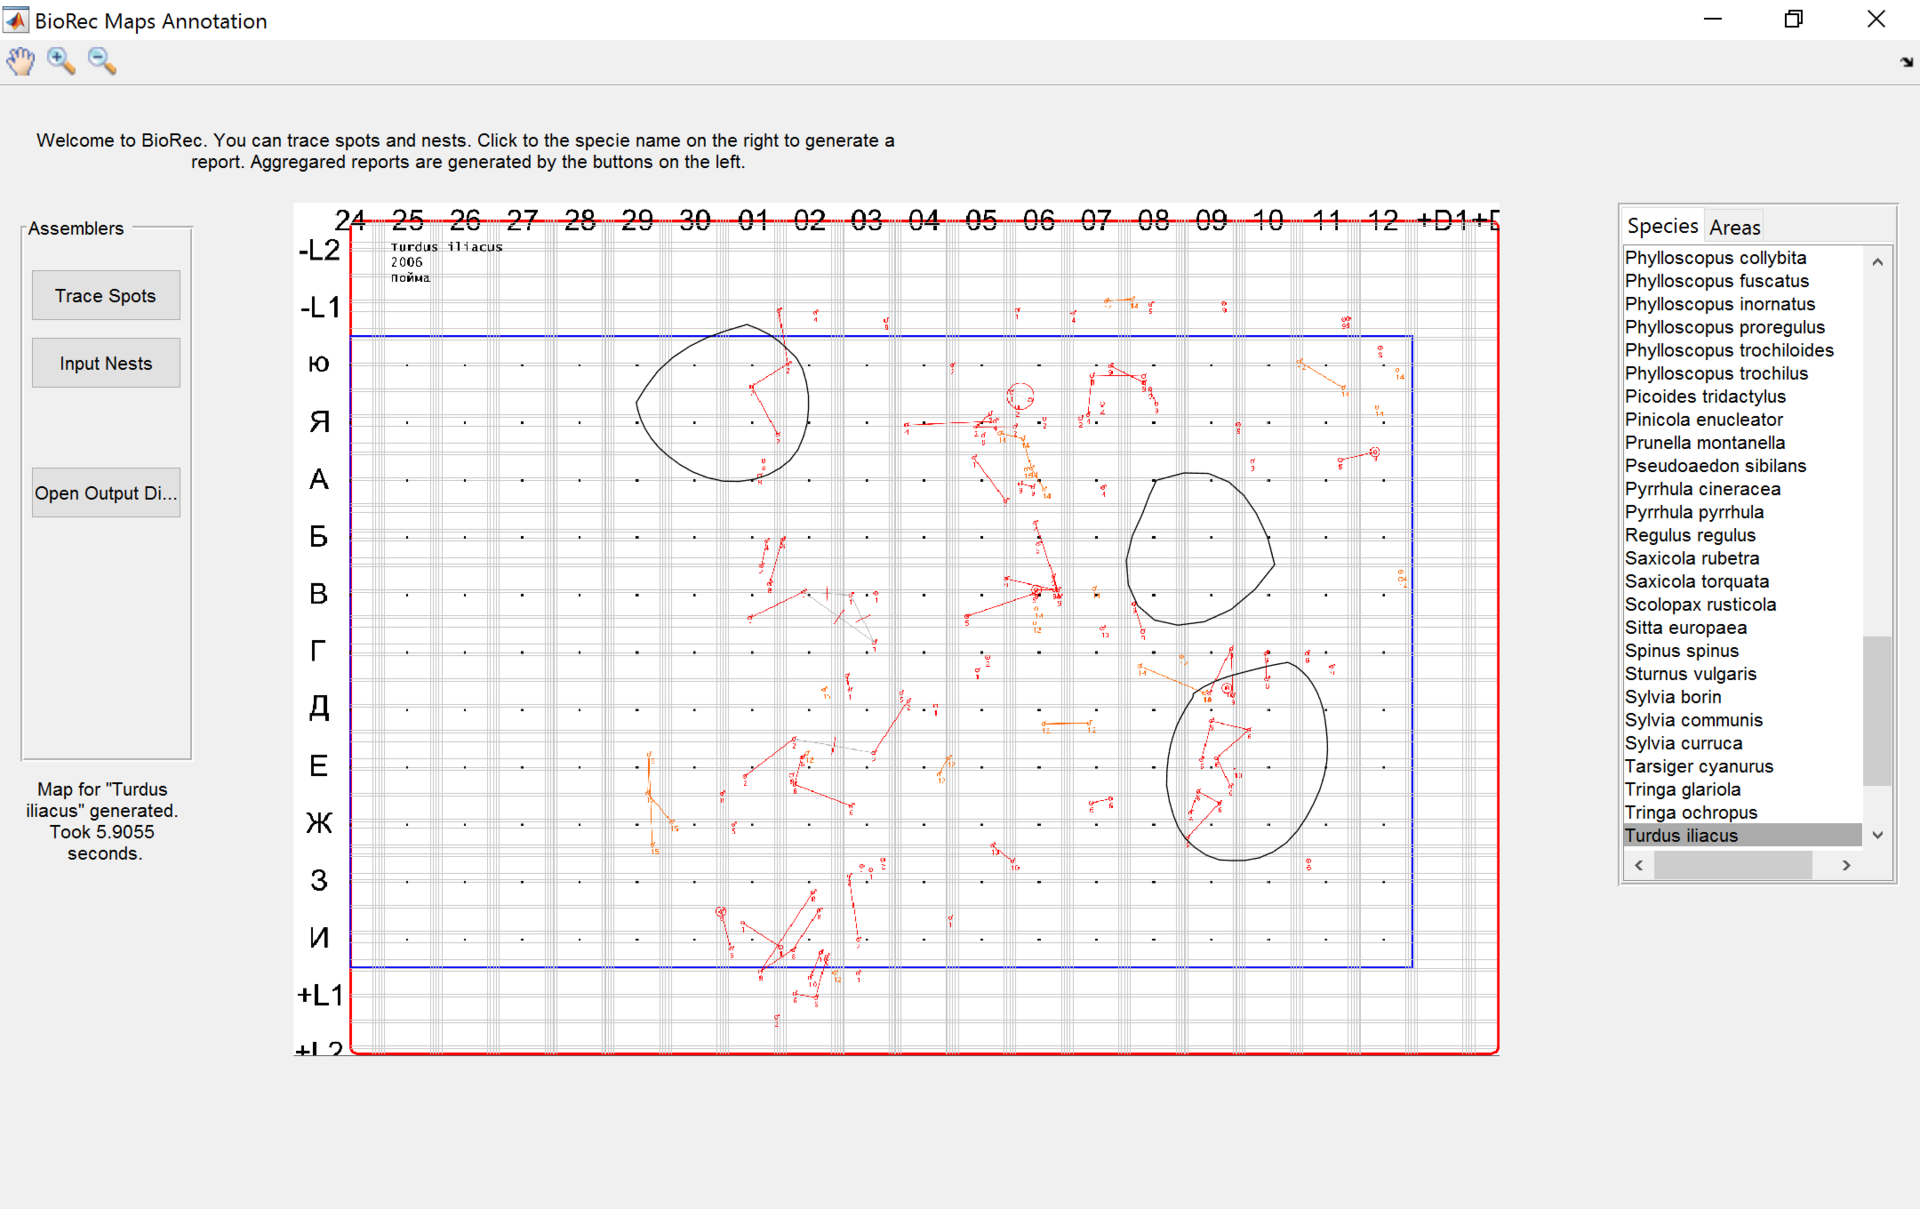
The razmetovchik turned out to be more meaningful than I expected. Just at some point I realized that if I just run it on a tablet, then I could collect data directly into it, bypassing the paper stage.
In the end, instead of a picture of the form
It would be possible to receive a picture of the form:
And even mark the territory. Manually, of course.
Having marked out one year manually, one could have already started regular tests of automation, not to mention the fact that one could undertake substantive analytics (such as calculating territories) and not just digging into machine vision.
Here I would finish this article with some cheerful finale ... But alas, it is not.
At the Institute of Economics and Ecology of the Russian Academy of Sciences lies twenty-five years of data collected, on paper.
The amount of data available in the BTO in the UK seems incalculable. _All_ the territory of the United Kingdom for 38 years.
On the other hand, unfortunately, I quarreled with people who helped me in the work on the project, and in general, I no longer interested in the area.
Therefore, I really want to find a hero who would like to inherit the project from me, and bring him to a logical conclusion. Glory and struggle are waiting for you, and the work will provide invaluable benefits to humanity.
The project is almost ready razmerchik and marked about half of one year of observations in the IEEE. (That is, the basic work of cleaning the data is done.)
The Common Birds Census processing project is called BioRec, and it is written in MATLAB 2015b.
In the project, a meaningful data model, it is ready to work with both “Visit Maps” and “Species Maps”.
The project has a website: biorec.sourceforge.net
The code is uploaded to SVN: sourceforge.net/p/biorec/code/HEAD/tree
The project has a mailing list, bugtracker, everything is like in adults.
There is an algorithm that can be slightly finished so that part of the data is recognized by the machine. Fans of machine vision - according to the already marked data, try to make a marker detector and automatize the second half.
Fans of geospatial analysis - you can try to formalize the BTO algorithm, implement the North algorithm, or try to write your own, for example, based on the Voronoi diagram.
You can then compare the algorithmically allocated territories with the expert ones.
You can try to impose the territory on a map of the area and see how, for example, the sizes of territories and the landscape are connected.
In general, the noble warriors, thirsting for blood and glory - this is your chance.
Write to me at lockywolf@gmail.com, or on Skype 'lockywolf'.
Fork, patches, conversations with descriptions of incomprehensible pieces of code - everything is at your service.
Introduction
When we think of bioinformatics, we usually imagine some complex DNA sequences, protein folding or, at worst, modeling of virus diffusion.
In this article, we will discuss a slightly different topic, much closer, one might say, machine vision and document analysis, or even applied automation, than to high science. But in fact, the topic is important and relevant, if only because it exists in a very interesting ecological niche.
')
KDPV:
Who are interested - I ask under the cat.
TL; DR:
Presentation of the project on the recognition of cards drawn by hand.
The project has a website: biorec.sourceforge.net
The code is uploaded to SVN: sourceforge.net/p/biorec/code/HEAD/tree
/ Tl; dr;
This story has several “roots” and I will try, without going too deep into the wilds, yet briefly describe them in order to create a more complete picture in the mind of the reader.
For a start, what is ornithology? Ornithology is a section of ecology, the science of bird behavior, how they behave and how they choose strategies for survival in this complex world.
It can be said that the main fundamental task of ecology is to find out why we have such types, and not any others. What kind of energy minima exist in a strange multidimensional space, which is our life, allowing some species to survive (for example, domestic cows have adapted very well, and are unlikely to ever die), and some die off (say, mammoths).
Ornithology solves this problem as applied to birds.
Say, for sure, many of the readers, when asked what the ornithologists are doing, will say “they put rings on birds and look where they will fly”.
Indeed, this is one of the methods used by ornithologists. In particular, for example, thanks to him, it is possible to establish on which routes migratory birds move from one end of ours extensively, but still such a small Earth to another.
Picture:
From the above picture, it can be understood that, in a sense, Russia was lucky, because the intersection point of many different, different from each other routes, it turns out it is in Russia.
Actually, it is at the intersection of the regions that one of the world's leading bird research laboratories is located - the Yenisei Biological Station IPEE RAS “Mirnoye”.
Data collection
However, in this article I want to draw your attention to another method used in the study of birds.
It can be said that just like a microscope can have different resolutions, and it makes no sense to try to examine a fuzzy font with an atomic force microscope, so the ornithological methods have different resolutions. The above method of ringing, has a typical range of thousands of kilometers. The same method that I want to talk about is only tens of meters.
This method is called Common Bird Census.
His idea is that every day specially trained people who know how to determine the type of bird by their appearance go to the test site, and mark various observed birds in their working notebook.
The format of the markers, marked by experts, you can see on the next slide.
And here is a fragment of data that is collected on the ground:
Oh, how good it would be if robots could do this work! It would be possible to run on each site of his robot, which would fly around every tree and report on everything he saw.
But alas, the technology has not yet reached this point (although, perhaps, it will come in the foreseeable future).
In the meantime, the observation requires specially trained people who need to absorb a huge amount of information about the behavior, appearance, sound profile and social skills of birds. And this information, unfortunately, is still poorly applicable in the ordinary life of a person. On the other hand, it is difficult to overestimate the opportunity to read the forest as an open book. This alone can make a person go to ornithologists.
And all the more impressive is that the whole territory of Great Britain, where this method was invented (in 1962), is covered with squares, which were observed in a similar way every year, for 38 years, until 2000, when the accuracy of the method was considered excessive.
bto.org.uk
By the way, the method was invented by J Dennis Summer-Smith, who, generally speaking, is an amazing person. What else did you translate an article from the wiki about it into English?
However, an attentive reader will tell me another place where you could apply the technology available at the moment.
Well, let it be impossible to collect data automatically. But at least it should be possible to save them in some convenient format?
Alas, the answer to this question is no. Unfortunately, in the places most convenient for observation, there are big problems with electricity, water and mud protection, cold and poor communication with the “big earth”. In the same place, where there are those problems, the problem arises of delivering standardized equipment (as which one could imagine some kind of industrial-grade tablet on Linux / Windows).
What we have, you ask!
Here's what:
Here I will again show the picture with the data:
On the image you see a fragment of the map, drawn in columns and rows with letters and numbers (note the “data format” on the previous slide).
This is the same unsightly, but such an expensive and important reality.
It is here that we see the birds moving from point to point, fighting, getting married, caring for offspring.
Each such sheet is many hours of difficult field work, which ultimately should give us the answer to the most difficult question in the world: how to live correctly? How to live in such a way as to live for a long time, not to get sick, produce offspring, grow up, sing the best (by what parameters?) Song and realize yourself in it.
Why are some birds big and others small? Why do some have a large area, others have a small one? Why do some birds have many children and others have few?
Data analysis
Well, you ask me. But if the data is somehow (albeit analog way) collected. If they are somehow (even on paper) stored.
But you and I are Data Scienceists. Well, is this data somehow processed somehow yes?
And the answer to this question is, although it is not as joyful as we would like.
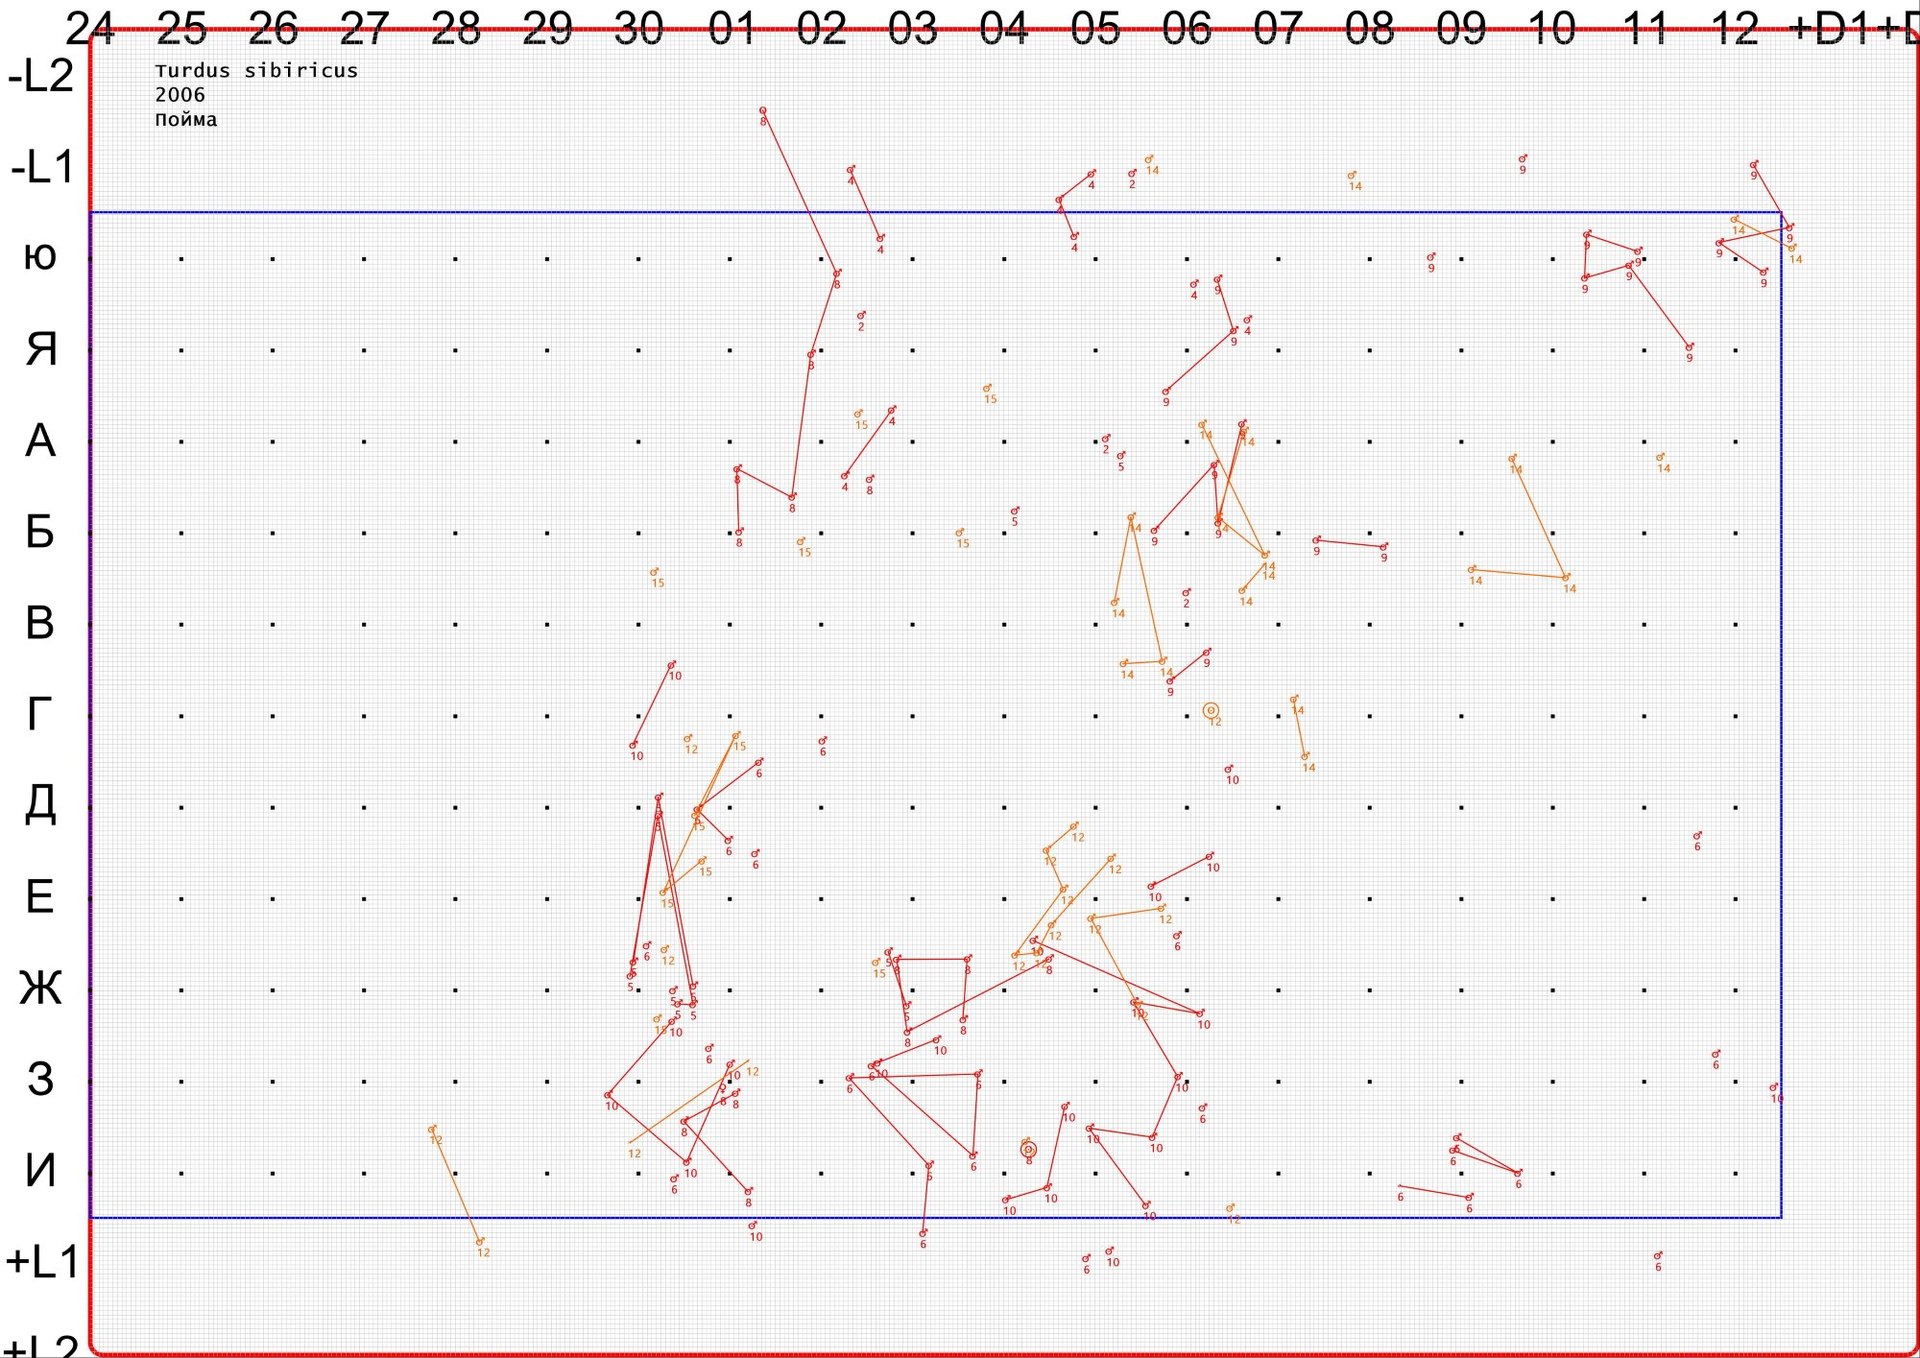
The most obvious task of preprocessing is to divide the data from the sheet into several layers, where each layer would correspond to only one type. This is a logical, meaningful task, because it is advisable to study birds of different species together, as samples from one set, and it is possible to compare them with other species according to adaptation strategies.
And this problem is solved. Here is the result:
But you see, what a snag. Like most technical processes in such a delicate area, it is solved analogously.
As a result, the construction of even one such map takes a lot of time, and if we consider that (as was already written above), at least the Russian proving ground for Common Bird Census is at an extremely successful point in terms of species diversity, the construction of such a map for all 200 species is a very time consuming task.
However, there is another element on the map that is not visible on the daily fragments: pencil circles.
And what are they?
And they are exactly the same thing, a small step to that same alpha and omega, to understanding the behavior of the species. They are individual territories. You could say the birth of private property. These are the territories that the birds consider to be “their own”, where they actively feed, build a nest and which are ready to protect, even the most terrible consequences.
But how are they drawn?
This is where another important scientific question arises. Because there are two answers to this question.
One is given, for example, in the British Ornithological Trusts Guide for CBC (inventors of this method)
www.bto.org/sites/default/files/u31/downloads/details/CBC-instructions-g100.pdf
Another, for example, purely mechanical, in Philip North's article
www.jstor.org/stable/2347022?seq=1#page_scan_tab_contents
Which one is better?
Very interesting question. The BTO manual says that the method should be applied by the same group of experts for many years to ensure the consistency of the results. In other words, they say “we can train a person, but we cannot formulate the law of nature”. In IEEE RAS do the same.
How good is the North method? Great question! Who wants to do? Calling you on weakly!
In principle, the obvious approach is to somehow cluster the points in order to then circle the clusters ... well, for example, slightly going beyond their convex hull. But how to cluster them? You can see that some clusters have a solid size of emptiness inside. And what degree of smoothness of the border should be observed?
Begin automation
When your humble servant was younger and bolder, and was engaged in issues of computer vision, he presented himself as a white knight on a horse, and decided that such a powerful task deserves to be a challenge.
I began to solve the problem by the method of machine vision, trying to pull out and recognize the letters and numbers of columns and rows. Under this case, I even agreed with the company Cognitive Technologies on the use of their industrial engine (!) For handwriting recognition.
Here are some traces of this work:
For example, by projecting an entire image onto one axis, it is relatively easy to trim the edges:
Using a combination of erosion and dilation, you can subtract the background and grid:
Using the Hough transform, you can determine the angle of rotation of the image and fix it:
By the same projection of the picture on one axis, you can pull out individual letters:
And in the end, even find them all on the fragment:
And then feed the recognition engine:
Unfortunately, we had to work with some numbers like this:
The results of this work are still unpublished, because the result was not impressive - 66% recognition accuracy, although it allowed me to defend my diploma in due time. The work could still be completed, but by the end of my graduation time, I realized that I could do nothing without good manual marking, because by that time I had compiled a list of more than fifty different possible jambs in the images, each of which had to be somehow to catch
And then, having finished the institute, I, in my free time, as a hobby, took up writing a manual razmotchik-annotator, which in the end gave me the urge to start writing this article.
In the following slides you can see the interface elements of this markup.
Project manager:
Positioned means the marking of letters and numbers.
But generally speaking, I did more - I did the markup of ALL markers that come in.
The razmetovchik turned out to be more meaningful than I expected. Just at some point I realized that if I just run it on a tablet, then I could collect data directly into it, bypassing the paper stage.
In the end, instead of a picture of the form
It would be possible to receive a picture of the form:
And even mark the territory. Manually, of course.
Having marked out one year manually, one could have already started regular tests of automation, not to mention the fact that one could undertake substantive analytics (such as calculating territories) and not just digging into machine vision.
results
Here I would finish this article with some cheerful finale ... But alas, it is not.
At the Institute of Economics and Ecology of the Russian Academy of Sciences lies twenty-five years of data collected, on paper.
The amount of data available in the BTO in the UK seems incalculable. _All_ the territory of the United Kingdom for 38 years.
On the other hand, unfortunately, I quarreled with people who helped me in the work on the project, and in general, I no longer interested in the area.
Therefore, I really want to find a hero who would like to inherit the project from me, and bring him to a logical conclusion. Glory and struggle are waiting for you, and the work will provide invaluable benefits to humanity.
The project is almost ready razmerchik and marked about half of one year of observations in the IEEE. (That is, the basic work of cleaning the data is done.)
The Common Birds Census processing project is called BioRec, and it is written in MATLAB 2015b.
In the project, a meaningful data model, it is ready to work with both “Visit Maps” and “Species Maps”.
The project has a website: biorec.sourceforge.net
The code is uploaded to SVN: sourceforge.net/p/biorec/code/HEAD/tree
The project has a mailing list, bugtracker, everything is like in adults.
There is an algorithm that can be slightly finished so that part of the data is recognized by the machine. Fans of machine vision - according to the already marked data, try to make a marker detector and automatize the second half.
Fans of geospatial analysis - you can try to formalize the BTO algorithm, implement the North algorithm, or try to write your own, for example, based on the Voronoi diagram.
You can then compare the algorithmically allocated territories with the expert ones.
You can try to impose the territory on a map of the area and see how, for example, the sizes of territories and the landscape are connected.
In general, the noble warriors, thirsting for blood and glory - this is your chance.
Write to me at lockywolf@gmail.com, or on Skype 'lockywolf'.
Fork, patches, conversations with descriptions of incomprehensible pieces of code - everything is at your service.
Source: https://habr.com/ru/post/324098/
All Articles